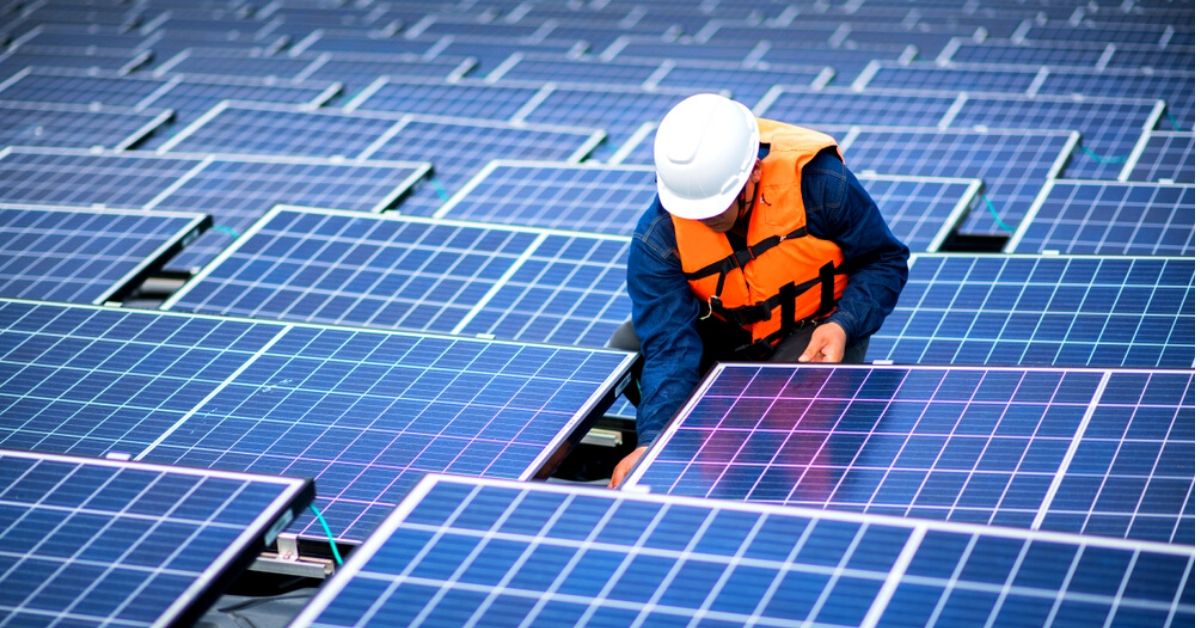
Polycrystalline photovoltaic panel maintenance: 5 tips
Clean polycrystalline panels quarterly with soft brushes and pH 7-8 cleaners (monthly in arid regions); inspect EVA layers semi-annually for cracks, monitor monthly output drops >5%, and tighten mounting screws at wind speeds over 60km/h.
Regular Panel Surface Cleaning
The National Renewable Energy Laboratory (NREL) reports that even light soiling cuts energy output by 6% annually for most systems, a number that jumps to 20% or higher in deserts, agricultural areas, or places with frequent dust storms. For a typical 10kW residential setup, that 6% loss translates to roughly 900 kWh of wasted electricity per year—enough to power a home’s refrigeration for 3 months—or an extra 135onannualutilitybills(at0.15/kWh). In extreme cases, heavy bird droppings or pollen clumps can block 90% of a single panel’s surface, dragging down the entire string’s output by 30-50% until cleaned.
In regions with over 50mm of monthly rainfall (like the Pacific Northwest), natural rinsing often keeps panels 95% clean for 8-10 months a year—only requiring spot cleaning after pollen season or bird activity. But in arid zones (e.g., Arizona, parts of Australia) or near construction sites/roads, you’ll need to act every 4-8 weeks during dry periods. The sweet spot for most systems? A quick rinse with a garden hose every 2-3 months, supplemented by deeper cleans when soiling hits 10-15% coverage (visible as dark streaks or reduced output).
The tools matter more than you think. Hard water (with >120ppm minerals) is a silent enemy—its calcium and magnesium residues form a white, chalky film that blocks 3-5% of light even after drying. Use deionized or softened water instead; if not available, mix one drop of pH-neutral dish soap (avoid vinegar or harsh chemicals that corrode glass) with one gallon of softened water. For tools, a soft-bristle brush (0.5-1cm bristle length) or microfiber cloth works best—steel wool or stiff brushes scratch the anti-reflective coating, reducing efficiency by 1-2% permanently. Pressure washers are risky: most panels have a glass thickness of 3-4mm, and pressures over 700 kPa (100 psi) can crack them or dislodge mounting seals.
Clean early in the morning or on cool, cloudy days: hot panels (60-80°C) exposed to cold water can develop micro-fractures in the glass, a problem that doubles in frequency above 30°C. And avoid wiping dry with a rough towel—letting panels air-dry with a tilt (most are installed at 15-35°) prevents water spots, which can cut output by 2-3% until removed.
Timely Inspection of Connections
A study by the Electrical Power Research Institute (EPRI) found that loose or corroded connections are a leading cause of system under performance, responsible for up to 15% of all preventable power losses in residential installations. A single faulty MC4 connector or a loose terminal on a combiner box can not only bleed hundreds of kilowatt-hours of energy annually but also create a significant fire hazard due to arcing and excessive heat buildup, with temperatures at the fault point capable of exceeding 150°C.
Module | Inspection Frequency | Key Parameter to Check | Acceptable Range |
MC4 Connectors | Every 6 months | Locking Mechanism & Visual Damage | Fully seated, no cracks/melting |
Combiner Box Terminals | Annually | Torque on DC Terminals | 2.5-3.5 Nm (refer to manufacturer spec) |
Grounding Lugs | Annually | Resistance to Ground | < 1 Ohm |
Inverter DC Terminals | Annually (by pro) | Torque | 15-20 Nm (refer to manufacturer spec) |
A thorough connection inspection starts with a complete system shutdown, following your inverter's specific shutdown procedure, which typically involves flipping the AC service disconnect first, followed by the DC disconnect switch. Visually scan all external wiring for obvious issues like rodent damage or insulation that has become brittle from UV exposure after 5-7 years. The primary focus should be on the MC4 connectors that link your panels; ensure each pair is fully snapped together and listen for an audible click when re-engaging them. Look for any signs of plastic discoloration, melting, or cracking, which are clear indicators of past overheating and require immediate replacement of both the male and female connectors. Inside the combiner box, check for any signs of corrosion, especially in humid coastal environments where salt spray can accelerate oxidation. A white or green powdery substance on copper lugs is a major red flag. Use a digital multimeter to perform a continuity check on grounding wires; resistance should be consistently below 1 ohm to ensure proper safety grounding.
For the critical bolted connections on circuit breakers and terminal blocks, a calibrated torque wrench is non-negotiable. Over tightening a terminal rated for 3 Nm to 4 Nm can strip the threads, while under tightening to 2 Nm creates high resistance and becomes a heat source. Annually, it is highly advisable to have a certified technician use a thermal imaging camera to scan all connections under full load (typically on a sunny afternoon when output exceeds 80% of capacity). This thermal scan can identify hots pots showing a temperature elevation of 10°C or more above ambient, pinpointing failing connections long before they cause a total failure. The cost of a professional annual inspection including a thermal scan is typically between 200and400, a fraction of the cost to repair damage from an electrical fire or replace an inverter damaged by a faulty DC arc.
Vegetation and Shade Management
Because most residential strings use simple string inverters, shading just 15% of a single panel can lead to a disproportionate power loss of over 50% for the entire connected string. This occurs as the shaded cells force the entire string to operate at the lowest current, a phenomenon detailed in a 2022 study by the National Renewable Energy Lab (NREL). A single tree branch casting a shadow during peak sun hours from 10 AM to 2 PM can slash your system's annual energy production by up to 25%, effectively nullifying the financial returns of your investment.
Vegetation Type | Growth Rate (per year) | Recommended Buffer Distance | Inspection Frequency |
Fast-Growing Trees (e.g., Willow, Eucalyptus) | 1.5 - 2.5 meters | 6 - 8 meters from array edge | Every 3 months |
Medium-Growth Trees (e.g., Oak, Maple) | 0.6 - 1 meter | 4 - 5 meters from array edge | Semi-Annually |
Slow-Growth Trees (e.g., Pine, Juniper) | 0.2 - 0.5 meters | 3 meters from array edge | Annually |
Shrubs & Hedges | 0.3 - 0.8 meters | 2 meters from array edge | Semi-Annually |
Use a tool like a Solar Pathfinder or a smartphone app with a built-in fisheye lens to capture a 360-degree panorama of your roof's horizon line. This image will show the exact azimuth and altitude of potential obstructions. Mark the winter solstice (around December 21st) on this chart because the sun's lower path in the sky means trees and structures cast their longest shadows, creating the highest risk of cold-season shading that can last for 4-5 hours a day.
For existing vegetation, the goal is to maintain a clear solar window from 9 AM to 3 PM, which captures over 80% of the day's harvestable energy. For fast-growing species like poplars, this means planning a trimming cycle every 6 months, budgeting approximately 150−400 per service for a professional arborist depending on tree height and accessibility. The most cost-effective long-term solution for a tree that will consistently grow above 10 meters is often complete removal, with an average cost between 700and1,800, which can have an ROI of less than 4 years based on recovered energy production.
Monitoring System Performance Data
According to the National Renewable Energy Laboratory, systems with regular performance monitoring produce 8-12% more energy over their lifetime because they enable prompt issue resolution. Without it, problems like a single failing panel or a faulty connection can go unnoticed for months, silently eroding your returns. Consider this: a 2% voltage drop in one string due to a degraded connector might seem minor, but it compounds into a 150 kWh loss per month in a 15kW commercial system—that's over 1,800annuallyat0.12/kWh. Modern inverters update power data every 5-15 minutes, creating over 35,000 data points per panel per year.
During the first 30 days of operation, record your system's peak daily output under ideal conditions (full sun, 25°C ambient temperature). This becomes your 100% performance benchmark—typically around 850-950 W/kW for polycrystalline arrays. Going forward, track these three metrics daily:
· Energy Yield (kWh): Total energy produced. A drop of more than 10% from your seasonal average warrants investigation.
· Performance Ratio (PR): The ratio of actual to theoretical output. Anything below 80% indicates significant losses.
· Peak Power (kW): Maximum output during solar noon. Should be within 5% of your established baseline.
Set up alerts through your inverter's platform or third-party monitoring service for when production drops 15% below expected levels for more than 48 hours. Most systems allow you to configure SMS or email notifications for such events. The goal is to catch issues like string imbalances or shading early—a 20% underperformance persisting for 30 days can cost a homeowner $40-60 in lost savings.
For deeper analysis, use the system's built-in data logging to compare performance across 7-day and 30-day periods. Look for patterns: if output consistently dips between 11 AM and 2 PM despite clear skies, you might have new shading issues. If voltage in one string is 3-5 volts lower than others, you could have a faulty panel or connection. Advanced users should monitor inverter efficiency curves; most units operate at 97-98% efficiency above 30% load but can drop to 92-94% at partial loads, affecting morning/evening output.
Maintaining Mounting Structure Stability
A study by the Renewable Energy Test Center found that vibration-induced loosening of racking modules accounts for nearly 18% of all structural failures in residential arrays. Over a 25-year lifespan, aluminum mounts experience metal fatigue cycles exceeding 10,000 times due to daily thermal expansion (causing 2-3mm movement per panel) and wind loads (exerting up to 3,000 Pa pressure during storms). A single loose bolt can reduce the system's wind uplift resistance by 15%, risking panel displacement in gusts above 90 km/h. More critically, frame misalignment exceeding 5 degrees creates uneven stress on panels, potentially cracking cells and voiding warranties—a repair costing $400-800 per panel including labor.
Routine inspections should focus on three critical areas:
· Foundation and Roof Penetrations: Check for sealant cracking (>2mm width) or corrosion around roof mounts
· Mechanical Connections: Verify torque values on bolts, clamps, and rails
· Material Degradation: Inspect for galvanic corrosion between dissimilar metals
Begin inspections after extreme weather events (winds >80 km/h or hail >25mm diameter). For roof systems, measure torque values with a calibrated wrench during annual maintenance—aluminum bolts typically require 15-20 Nm, while stainless steel needs 12-16 Nm. Loose bolts (below 80% specified torque) should be retightened immediately, but overtightening beyond 110% torque can strip threads, reducing holding capacity by 30%. In coastal areas, check for galvanic corrosion where aluminum rails meet steel bolts—even minor corrosion (covering >10% of surface area) can reduce structural strength by 20%.
For ground-mounted systems, inspect concrete foundations for cracking wider than 0.5mm and check for foundation exposure due to soil erosion. A 3-degree tilt in any direction requires immediate realignment. Rail systems should show no visible sagging—maximum allowable deflection is 1/200 of span length (e.g., 5mm sag per meter rail). During winter, clear snow loads exceeding 35 kg/m² (about 30cm fresh snow) using soft tools to prevent scratching panels.