How Long Can Solar Panels Power a House in a Day
A 5 kW photovoltaic system can provide about 5 hours of peak power generation on sunny days.
If paired with a 10 kWh energy storage cell in actual operation, the excess electricity generated during the day can be directly stored in the cell, which can then continuously discharge during the sunless night, thereby achieving 24-hour uninterrupted power supply for the house.
Daytime vs. Full Day
How to Supply Power During the Day
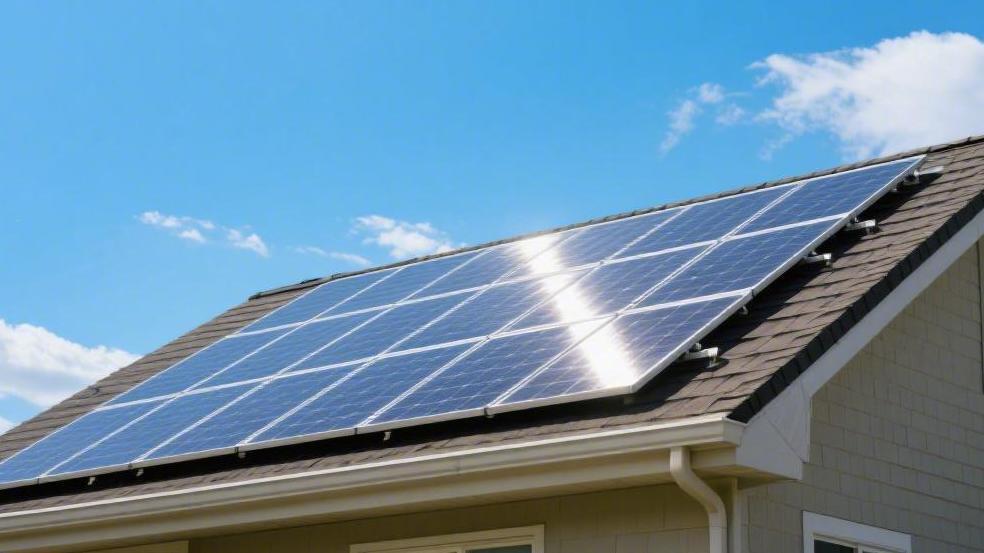
A residential rooftop solar array with a rated capacity of 10 kilowatts can convert absorbed solar radiation into direct current (DC) during the 8-hour sunlight window from 8 AM to 4 PM.
When the external ambient temperature reaches 35°C, the actual physical temperature on the surface of the polycrystalline silicon panels will soar to 65°C. Calculated based on a physical temperature coefficient of 0.35% power degradation per 1°C increase, the actual peak output of a 10 kW installed capacity system will be forcibly reduced to around 8.6 kilowatts.
During the peak power generation period from 12 PM to 2 PM, the inverter converts DC to alternating current (AC) with a circuit conversion efficiency of 96%, and the real-time power finally input into the home distribution box is precisely maintained at around 8.2 kilowatts.
Assume the house's basic standby load during the day includes a refrigerator with a rated power of 800 watts, a 150-watt broadband router and security monitoring combo, and a central air conditioning compressor set at 24°C with a continuous operating power of 2.5 kilowatts. At this time, the instantaneous total energy consumption of the house is 3.45 kilowatts.
l Of the 8.2 kilowatts of real-time AC power generated by the system, 3.45 kilowatts are completely consumed on the spot by the indoor appliances.
l The remaining 4.75 kilowatts of electrical energy surge toward the external utility grid along the wires at a voltage of 240 volts and a current of nearly 20 amps.
l If the local utility company implements a 1-to-1 net metering pricing policy, the energy surplus of 4.75 kWh per hour will be converted into a $0.71 credit on the electricity bill (assuming the local base rate is $0.15 per kWh).
Pure Discharge at Night
The sun sets precisely at 6 PM, and the voltage of the photovoltaic panels plummets below the inverter's starting threshold of 120 volts, instantly dropping the total system power generation to zero. For the 14 hours from 6 PM to 8 AM the next morning, the house completely loses its natural energy supply.
A 55-inch OLED TV steadily consumes 0.12 kWh per hour; a 4-kilowatt high-power electric water heater used by a family for bathing consumes 3 kWh when heated at full load and full speed for 45 minutes; plus 3.5 kWh eaten up by a dryer running for 1 hour. A typical family of four usually consumes 12 to 15 kWh during the sunless nighttime period without a solar supply.
Installing a nickel-cobalt-manganese (NCM) ternary lithium cell pack with a physical capacity of 13.5 kWh is the only hardware means to cut off dependence on the grid. The underlying cell management system built into the home energy storage cell pack forcibly limits the upper limit of available depth of discharge to 90%. Thus, a nominal physical total capacity of 13.5 kWh can actually only release 12.1 kWh to protect the internal chemical cells from irreversible deep degradation.
l When the total nighttime load reaches 15 kWh, the 12.1 kWh cell inventory will completely bottom out and clear to zero around 2:30 AM.
l Cell energy storage equipment experiences a 9% thermal loss due to internal resistance during the charge and discharge cycle. If 13.3 kWh is charged into the cell array during the day, the effective electricity that can truly be released for use at night is only 12.1 kWh.
l Once the cell is depleted, the house will automatically close the switch and connect to the external public grid. During the off-peak electricity price period from 3 AM to 8 AM, it buys the insufficient 2.9 kWh at a cheap rate of $0.12 per kWh, making the single-day electricity cost to maintain power through the night approximately $0.35.
Calculating the All-Day Account
Extending the 24-hour timeline, the logic of the house operating uninterrupted around the clock is built upon the coverage rate of daytime PV production against total consumption. A solar storage hybrid system with a total cost of $22,000 and a total installed capacity of 8 kilowatts, under an annual average of 4.5 hours of effective peak sunshine per day, has a theoretical total daily power generation of 36 kWh.
If the 24-hour total daily power consumption of the house is strictly controlled and constant at 28 kWh, there seems to be an absolute numerical surplus of 8 kWh per day. However, in a long-term operating sampling over 365 days a year, actual power generation will show extreme variance and seasonal fluctuations.
l During the 4-month winter low-light cycle, single-day effective sunshine plummets to only 2.5 hours, and the system's daily power generation drops to 20 kWh. Meanwhile, turning on a 2.5-kilowatt electric heating device for 8 hours in winter will eat up a full 20 kWh, causing the total daily power consumption to soar over 45 kWh, resulting in a single-day power deficit of up to 25 kWh.
l Photovoltaic silicon wafer modules will have a light-induced degradation rate of 2% in the first year, and will continue to age at a rate of 0.45% annually from the second year onwards. When the equipment runs continuously for its 15th year, the production standard of 36 kWh per day will permanently shrink to 31.4 kWh.
l After a residential energy storage cell undergoes 4,000 deep charge-discharge cycles, the internal material impedance will increase by 25%. The original usable capacity health of 12.1 kWh will drop to around 9.6 kWh, further weakening the endurance survival time off the grid at night.
Electricity Prices and Arbitrage
The economic digital ledger of running off-grid around the clock is built on the high-frequency fluctuation patterns of time-of-use electricity prices. In areas like California, rates during the evening peak demand period (4 PM to 9 PM) can skyrocket to $0.52 per kWh, while the off-peak base rate during the day from 10 AM to 2 PM is only $0.18 per kWh.
If the underlying logic of the entire system is programmed to a "time-priority control" mode, the 13.5 kWh cell will fully absorb excess photovoltaic power valued at only $0.18 per kWh during the day (full charging cost is equivalent to about $2.43). By 4 PM, even if the sun is still generating electricity in the sky, the system will forcibly cut off external grid power input and fully release the cell reserves to cope with the high evening peak rate of $0.52 per kWh.
l By using the cell to precisely dodge 5 hours of high peak electricity prices every day and shifting 10 kWh of household electrical load, an absolute difference in electricity costs of $3.40 can be saved in a single day.
l Over the 5,475 day-and-night operating cycles of the cell's 15-year standard design life, relying solely on the energy time-shifting of daily peak-to-valley electricity price differences can accumulate a paper return of real money exceeding $18,000.
l Coupled with the fixed monthly waiver of the $120 base grid electricity bill, a complete hardware system costing $22,000—without calculating any external preferential subsidies such as federal tax credits—will have its average payback period accurately compressed to around 8.3 years. The remaining 16.7 years of its hardware design life operation period will completely produce pure-profit free electricity with zero marginal operating costs.
Peak Sun Hours
What is Good Sunlight?
Evaluating exactly how much electricity a solar system can deliver to a home each day cannot at all be based on the clock span from sunrise in the morning to sunset in the evening. A 14-hour long summer day is not equivalent to 14 hours of full-load working time. The absolute standard used in the industry to quantify energy input intensity is "peak sun hours." This parameter has an extremely strict physical definition: it is the sum of time that every square meter of surface area receives 1,000 watts of solar radiation energy.
At 7 AM or 5 PM, when the sun shines obliquely through the thick atmosphere, the radiation intensity is often only 200 watts per square meter to 300 watts per square meter. Even if this weak scattered light shines for a full five hours, it can only be converted into 1 to 1.5 standard peak sun hours in the energy ledger. A rooftop array with a rated full-load power of 8 kilowatts can only output electrical energy close to its nominal data within an hour under the harsh conditions of noon without any cloud cover, when solar radiation intensity reaches or exceeds 1,000 watts per square meter.
"Under Standard Test Conditions (STC), a monocrystalline silicon photovoltaic module with an area of about 1.9 square meters must output its rated nominal peak power of 400 watts under an irradiation of 1,000 watts per square meter with an air mass of AM1.5 and a constant cell operating temperature of 25°C. Any environment deviating from this illumination threshold will cause the current to experience a linear, cliff-like drop."
Picking the Location
The latitudinal span of the earth's surface and the distribution of high-altitude meteorological systems have completely locked the upper limit of power generation potential for different cities on a geographical level. Phoenix, Arizona, located in the desert region of the southwestern United States, boasts extremely high clear-sky rates and lower latitude year-round, with an annual average daily peak sun hour ranging from 6.5 hours to 7.0 hours.
Around the summer solstice in June, the single-day peak sun hours can even soar past 8.2 hours. If the exact same 10-kilowatt installed capacity photovoltaic equipment is moved to Seattle, Washington on the northwest coast, the annual average daily peak sunshine will be reduced by thick clouds and high latitude to a mere 3.2 hours.
During the deep winter rainy season in December, Seattle's daily peak sun hours will tragically shrink to between 1.1 hours and 1.5 hours. In Phoenix, this 10-kilowatt system can easily churn out 82 kWh in a single summer day, enough to sustain two 4-ton central air conditioners running continuously at high frequency for over 10 hours. But in December in Seattle, the same 10,000 watts of fully paved panels will be mercilessly physically locked at a single-day output of about 11 kWh, barely enough to maintain the basic LED lighting needs of a few rooms, a large-capacity refrigerator, and a broadband router.
"Winter in high-latitude regions not only faces the physical predicament of shortened sunshine duration, but the increased angle of incidence of sunlight leads to an exponentially reduced density of radiant energy intercepted per unit area. This forces off-grid homes to be equipped with expensive lithium iron phosphate cell packs that are three times their usual electricity consumption to cope with low-light cycles lasting for weeks."
How to Arrange the Panels
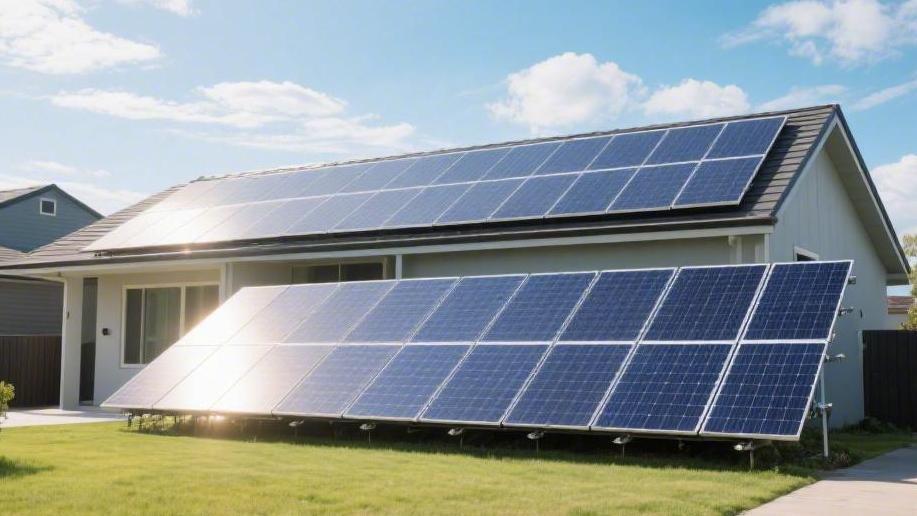
Aside from the geographical coordinates bestowed by nature, the physical orientation and tilt angle of the rooftop panels are artificial variables that govern the utilization rate of peak sunshine.
In the northern hemisphere, a due south orientation (azimuth angle 180 degrees) is the single optimal solution to maximize the capture of the sun's radiation trajectory throughout the day. When panels deviate 90 degrees from due south to either due east or due west, the overall annual peak light interception will suffer a hard evaporation of 15% to 20%.
If a house located at 35 degrees north latitude installs solar panels completely flat on a roof at a gentle tilt angle of 15 degrees, during the four months in winter when the solar elevation angle is extremely low, the reflectivity of the panel surface to sunlight will increase significantly. This results in an additional loss of 12% to 18% in the daily peak sunshine reception amount during winter.
A palm-sized leaf shadow covering just a single cell at the bottom of the panel, if it triggers the bypass diode mechanism inside the module, can instantly cut off one-third of the current of the entire photovoltaic sub-string. This causes a 400-watt rated panel, even under the strongest noon illumination of 1000 watts per square meter, to plummet its output power to below 260 watts.
Factoring in Losses
To convert the tempting peak sun hours on paper into the final AC power input into the distribution box, a long string of energy loss taxes at the physical and chemical levels must be forcibly deducted in the middle. A top-tier N-type monocrystalline silicon solar panel labeled with a maximum photoelectric conversion efficiency of 22.5% has its test data locked under an ideal laboratory temperature control of 25°C.
Under the scorching sun of up to six hours of peak daylight in July, the actual physical temperature on the surface of the dark panel will skyrocket to 70°C. Calculated at a temperature degradation coefficient of minus 0.3% per degree Celsius, crossing the 45°C temperature difference boundary will forcibly eat up 13.5% of the panel's instantaneous generating power.
When high-voltage DC power is transmitted along copper cables to the inverter on the garage wall, line resistance will cause a thermal dissipation of 2% to 3%. When the inverter converts DC power into 60 Hz, 120-volt AC power usable by household appliances, even the highest-end high-frequency equipment on the market will experience a conversion power loss of 4% to 5.5% during the chopping and filtering process.
Aging dust and bird droppings covering the glass surface will obscure roughly another 5% of light transmittance. Multiplying the various loss multipliers together, when 6 hours of peak sunlight hit a system with an installed capacity of 10 kW, the final effective energy input into the household grid will absolutely not reach the theoretical 60 kWh; it is often strictly suppressed within a true safe range of 48 kWh to 51 kWh.
"Without factoring in the internal resistance loss of cell charging and discharging, in the complete physical link of a purely grid-tied photovoltaic system from the silicon wafer absorbing photons to the output of alternating current, the comprehensive system Derate Factor consistently hovers in a narrow range of 0.81 to 0.85 year-round. When estimating daily power generation, a 20% discount must be forcibly applied in the preliminary calculation."
Weather & Season
Changing Seasons
The 23.5-degree tilt angle of the Earth's rotation axis forcibly dictates the absolute upper limit of a photovoltaic array's production capacity in different months. Take a rooftop system with a rated capacity of 10 kilowatts in the Boston area of Massachusetts, USA, as an example. Around the summer solstice on June 21, the local noon solar elevation angle approaches 71 degrees, and the physical span of daylight is stretched to 15.2 hours. Ultraviolet and visible light penetrating the atmosphere are extremely abundant, capable of providing 5.8 peak sun hours in a single day. With the inverter running at full speed, the system can crank out 48 to 52 kWh of AC power a day, completely covering the 8-hour continuous high-frequency operation of a 4-kilowatt central air conditioner plus the whole house's 25 kWh basic standby energy consumption.
When time advances to the winter solstice on December 21, the solar elevation angle plummets to 24.5 degrees, and daylight hours sharply drop to just over 9 hours. Weak oblique sunlight undergoes severe Rayleigh scattering and absorption losses when penetrating the thicker atmosphere, causing the effective single-day peak sun hours to plummet to a mere 1.8 hours. With the same 10-kilowatt physical installed capacity, the maximum single-day production capacity in deep winter is locked between 14 kWh and 16 kWh. A cross-seasonal production drop of up to 300% forces houses running completely off-grid to either endure massive energy spillover waste in the summer or shell out an extra $15,000 to add a backup energy storage cell pack with a physical capacity of 20 kWh, specifically to fill the daily paper deficit of supply and demand of up to 15 kWh in the winter.
Dealing with Cloudy Days
Cloud thickness and water content act as a natural physical sunshade, indiscriminately reducing the intensity of solar radiation reaching the surface. When cumulonimbus clouds appear in the sky, more than half of the standard 1,000 watts per square meter of radiation is swallowed up. The real-time input power parameters on the inverter panel will fluctuate violently as high-altitude clouds drift by. To quantify the destructive power of severe weather on a home's 24-hour continuous power supply cycle, cloud cover is divided into three cliff-like degradation ranges:
l Under a state where the sun is obscured by thin high-altitude clouds, atmospheric light transmittance remains around 60%, and the radiation intensity reaching the rooftop panels drops to 600 watts per square meter. The real-time AC output power of a 10-kilowatt array falls back from a full load of 8.5 kilowatts to around 5 kilowatts, and the total single-day power generation suffers a 25% to 30% loss, usually scraping together about 30 kWh. This barely supports the basic daily consumption of a family of three without turning on high-power heating equipment.
l During moderate continuous rainy weather, thick water vapor clouds forcibly suppress radiation intensity to between 200 watts per square meter and 300 watts per square meter. The photovoltaic effect inside the modules is extremely weak, leaving the system's total all-day output at a mere 8 to 12 kWh. Heating food in a 2-kilowatt microwave for 15 minutes, plus a 1.5-kilowatt hair dryer working for 10 minutes, can instantly drain the weak real-time current that the panels are slowly accumulating. The home's nighttime power supply must extract 100% of the physical inventory of the energy storage cell.
l Encountering extreme thunderstorms or dark blizzards, the light intensity drops below 100 watts per square meter. The DC voltage in the photovoltaic sub-string combiner box cannot reach the lowest starting threshold of 120 volts set by the inverter factory. The system falls into a physical crash state, and the single-day power generation bill completely zeroes out. If a fully loaded 13.5 kWh backup cell cannot carry the house's power consumption load, the house will suffer a complete blackout and shut down within 10 to 12 hours.
Fear of Heat, Not Cold
Photovoltaic silicon wafers inherently possess a negative temperature coefficient attribute. Mainstream N-type monocrystalline silicon panels on the market generally have a maximum power temperature coefficient rated at negative 0.34% per degree Celsius. 25°C is the absolute test baseline for a module's factory nominal power. During a heatwave in California's Central Valley hitting 40°C in July, the physical surface temperature of dark black panels exposed to the blazing sun will skyrocket to 75°C.
Crossing the boundary with a 50°C temperature difference will trigger a hard 17% power penalty. A panel bearing a factory nameplate of nominally 400 watts has its extreme output suppressed to 332 watts at a hot noon. A 10-kilowatt rooftop array evaporates 1.7 kilowatts of real-time production capacity out of thin air.
On a dry, cold, sunny day with an air temperature of minus 10°C, as long as the panel's glass surface is not covered by snow, the icy environment provides excellent physical heat dissipation conditions for silicon-based modules. At this time, the actual operating temperature of the panel may only be 5°C, which is 20°C below the baseline. The system can instead gain a 6.8% extra power bonus, and the inverter can even intercept an over-frequency current that exceeds the panel's rated parameters.
If it is an early morning with newly melting heavy snow, the bright white snow on the surrounding ground and roof has an extremely high albedo of up to 80%. This refracts a massive amount of diffuse reflected light a second time onto the panel surface, prompting bifacial power generation glass modules to reap a surprise single-day capacity dividend of 20% to 30% in deep winter.
Looking at the Ledger
Quantifying all meteorological variables and temperature fluctuations into dollars and kilowatt-hours, a 10-kilowatt residential photovoltaic array installed in Denver, Colorado, equipped with a 13.5 kWh energy storage cell pack and carrying a total hardware price of $25,000, exhibits completely fractured power supply maintenance performances when dealing with different extreme weather conditions throughout the four seasons. Let's set the rigid, unshakeable daily power consumption target of the house at 28 kWh.
Weather Conditions | Real-time Ambient Temp | Panel Operating Temp | Daily Avg Radiation Intensity | Est. Daily Power Gen | Cell Nighttime Charge | Grid Power Bought by House |
Midsummer June, cloudless sunny day | 35°C | 65°C | 950 W/m² | 46 kWh | 13.5 kWh (Fully charged) | 0 kWh |
September, crisp autumn air & breeze | 22°C | 38°C | 880 W/m² | 39 kWh | 11 kWh | 0 kWh |
April, spring cloudy & showers | 15°C | 18°C | 400 W/m² | 18 kWh | 0 kWh (Not fully charged) | 10 kWh |
December, deep winter, extreme cold, overcast & snow | Minus 5°C | 2°C | 150 W/m² | 4 kWh | 0 kWh (Completely empty) | 24 kWh |
Even if the panel is covered by merely two centimeters of fluffy snow, the light transmittance will instantly plummet below 1%. If no one is hired to physically sweep it off, the entire day's system power generation will not even break past 0.5 kWh.
During a week-long stretch of continuous overcast and snowy days, the expensive 13.5 kWh lithium cell pack supported the house for only 8.5 hours on the first night before forcefully shutting down to protect itself after triggering the 10% protective minimum charge limit. For the remaining six days, the house relied entirely on purchasing 165 kWh from the public transmission grid at a retail rate of $0.18 per kWh to tide over the whole house operation crisis, resulting in a pure grid electricity bill expense of nearly $29.70 for a single week.