A solar module can look normal but fail an I-V curve test because visual inspection checks visible damage, while an I-V test measures actual current, voltage, and power. Hidden cell cracks, weak solder joints, high resistance, current leakage, cell mismatch, bypass-diode faults, or incorrect test conditions may all produce a low or distorted curve.
Do not reject a module based on a single low reading. Confirm the module model, serial number, reference data, irradiance, temperature, test connections, and repeatability first. IEC 60904-1 defines procedures for measuring photovoltaic current-voltage characteristics under natural or simulated sunlight.[1]
Why Visual Inspection Can Miss the Fault
Visual inspection can find cracked glass, delamination, burn marks, bent frames, damaged cables, loose junction boxes, broken connectors, dirt, and visible corrosion.
It cannot confirm whether every cell and electrical connection inside the laminate is working correctly. Most current-carrying parts are sealed between the glass, encapsulant, cells, and backsheet or rear glass.
A module can look normal while it contains:
- A cell crack too narrow to see through the glass
- A cracked cell area that is partly disconnected
- A solder joint that still touches but has high resistance
- A damaged ribbon hidden below the encapsulant
- A shorted or open bypass diode
- An internal leakage path
- Electrical mismatch between cells
- Early corrosion without visible discoloration
Some faults only appear under load. A weak connection may work at 2 A but overheat near 13 A. A cracked cell area may stay connected while cold and separate after heating. An open bypass diode may have no effect under uniform light but fail to protect cells during shading.
IEA PVPS treats visual inspection, I-V testing, thermal imaging, and electroluminescence imaging as complementary methods because each method finds a different group of problems.[2]
What Does an I-V Test Failure Mean?
A module should not be called defective simply because its outdoor power is below the nameplate value.
A valid failure decision requires:
- The correct module model and serial number
- The correct factory flash data or agreed baseline
- Valid irradiance and temperature measurements
- The correct monofacial or bifacial test method
- Reliable connectors, leads, clamps, and probes
- Repeatable results under stable conditions
- Consideration of measurement uncertainty
- A defined acceptance limit
The comparison value may come from the nameplate, original factory flash record, purchase contract, commissioning test, previous field measurement, or a known-good module of the same model. These values should not be mixed without correction.
For example, a field-aged module should not be compared only with a new-module nameplate if the contract allows normal degradation. A module operating at 55°C should not be compared directly with its 25°C STC power.
Know the Test Context
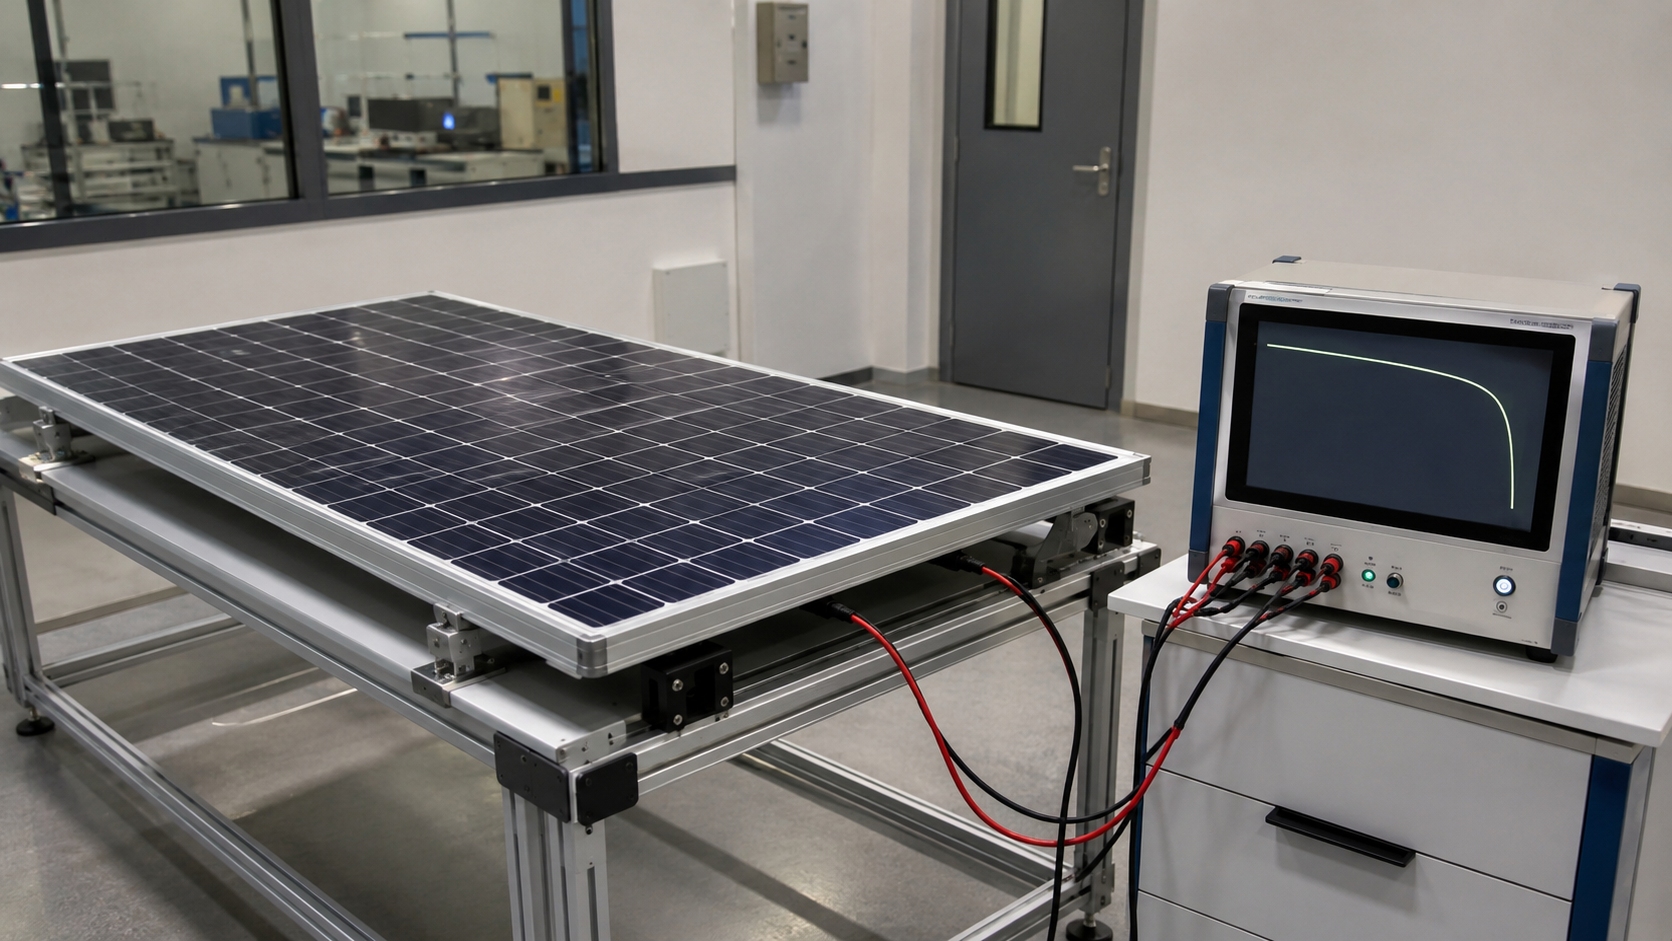
Factory flash testing normally measures one module under a solar simulator. Errors can come from the wrong test recipe, incorrect temperature coefficients, poor irradiance uniformity, unsuitable sweep time, high contact resistance, or mismatched serial-number data.
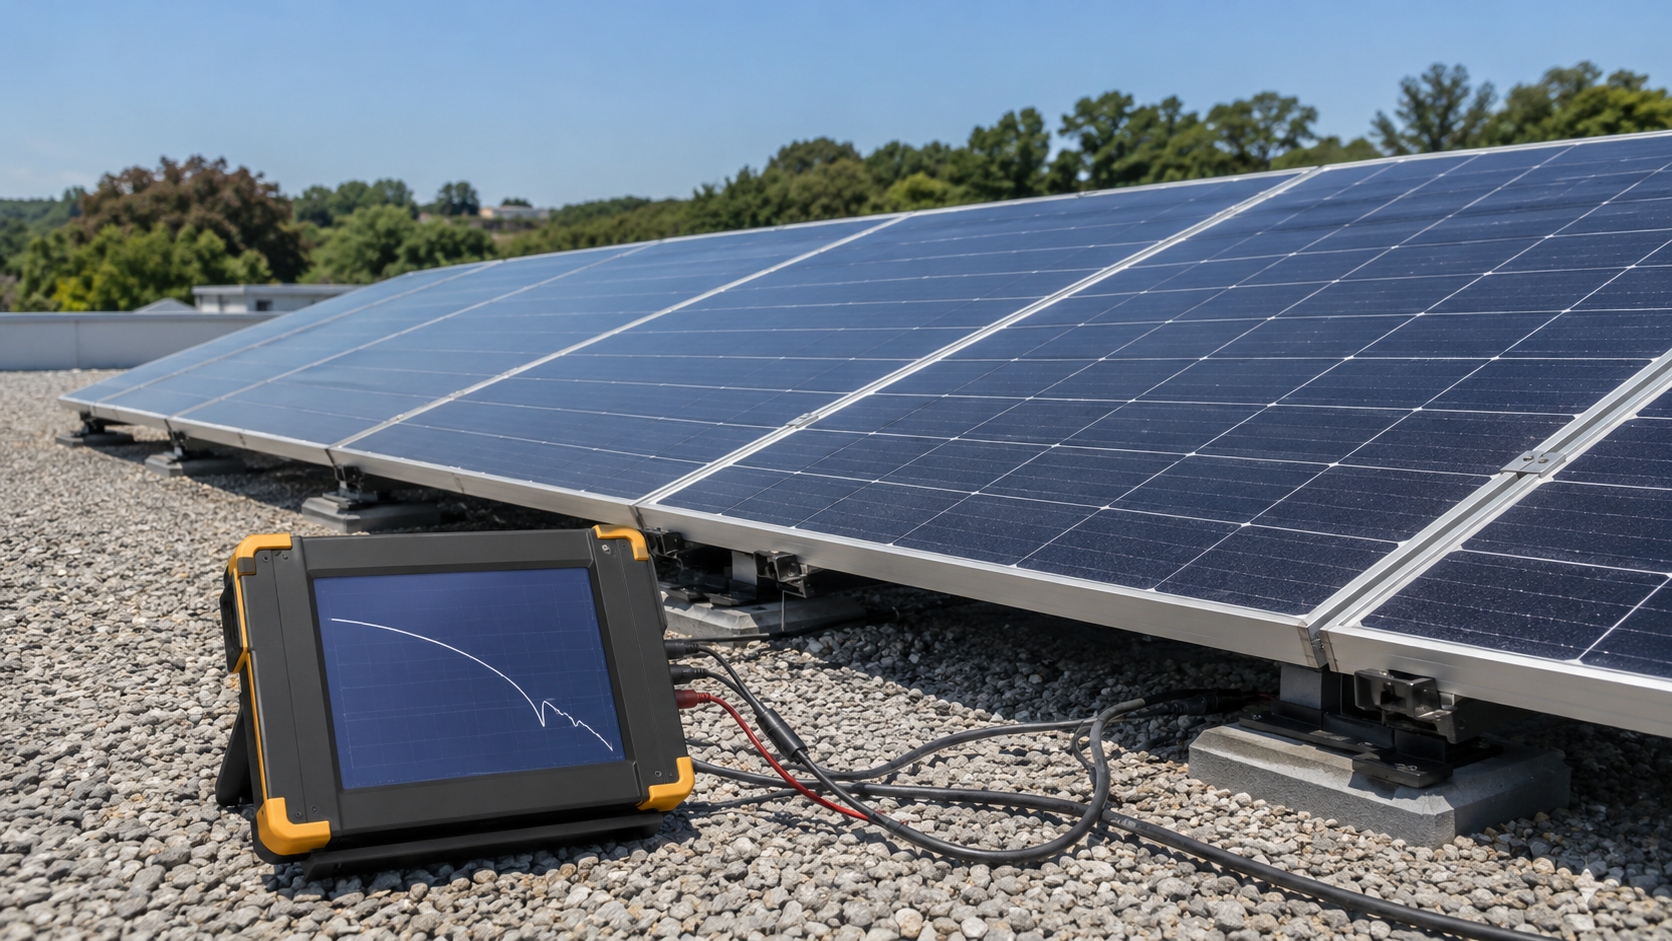
Field module testing is affected by clouds, wind, module temperature, dirt, temporary shadows, sensor placement, and connector condition. Raw outdoor power should be corrected before comparison with STC power.
String I-V testing measures several modules and the connected DC circuit together. A string abnormality may come from one shaded module, a weak substring, a damaged connector, mixed module orientations, wiring errors, or current differences between modules.
A string curve can show that a problem exists, but it may not identify the exact module. Module-level testing, thermal imaging, or selective testing may still be required.
The difference between STC and normal operating conditions is large. A 550 W module may produce about 410–420 W under typical NMOT rating conditions, around 75%–77% of its STC value. That difference is mainly caused by irradiance dropping from 1,000 W/m² to 800 W/m² and cell temperature rising from 25°C to about 42–46°C. Tongwei's guide to STC and NMOT module ratings explains this comparison in more detail.
The test recipe must also match the exact product. Tongwei's high-efficiency module range includes modules with different power levels, cell layouts, interconnection designs, and bifacial configurations.
Read the Main I-V Values
An I-V curve should not be judged from maximum power alone. The main values are Isc, Voc, Imp, Vmp, Pmax, and fill factor.
Isc — Short-circuit current
Isc is the current measured when module voltage is close to zero. Low Isc usually points to low irradiance, dirt, broad shading, inactive cell area, or current mismatch.
Voc — Open-circuit voltage
Voc is measured when no load current is flowing. Low Voc may come from high cell temperature, a missing cell section, a bypassed substring, a shorted diode, or voltage-related degradation.
Imp — Maximum-power current
Imp is the current at the maximum power point. Low Imp often appears with shading, cell mismatch, isolated cracked areas, low irradiance, or current leakage.
Vmp — Maximum-power voltage
Vmp is the voltage at maximum power. It may fall because of high temperature, series resistance, a bypassed substring, a shorted diode, or poor test contacts.
Pmax — Maximum power
Pmax is calculated as:
Pmax = Vmp × Imp
A module producing 13.2 A at 41.5 V has:
13.2 × 41.5 = 547.8 W
Pmax shows the final output but not the cause of a failure. Two modules may lose the same number of watts for completely different reasons.
Fill factor
Fill factor is calculated as:
Fill factor = Pmax ÷ (Voc × Isc)
Isc and Voc describe the ends of the curve. Fill factor shows whether the useful middle part remains healthy. A module may have normal Isc and Voc but low Pmax because resistance or leakage has changed the curve shape.
Sandia's single-diode model describes module output through light-generated current, diode behavior, series resistance, shunt resistance, and other electrical parameters.[3]
Example of Real Module Data
One current Tongwei 630 W bifacial module configuration lists the following STC values:
| Parameter | Example value |
|---|---|
| Pmax | 630 W |
| Voc | 49.50 V |
| Isc | 16.18 A |
| Vmp | 41.10 V |
| Imp | 15.33 A |
| Module efficiency | 23.3% |
| Bypass diodes | 3 |
The maximum-power values agree:
41.10 V × 15.33 A = 630.06 W
This small rounding difference is normal because datasheet voltage and current values are typically shown with limited decimal places.
If the same module measures 15.33 A but Vmp falls from 41.10 V to 38.50 V, its power becomes:
38.50 V × 15.33 A = 590.21 W
The current is still normal, but the module has lost about 39.8 W because its operating voltage has fallen. This pattern points toward temperature, high series resistance, a bypassed section, or a contact problem rather than a simple irradiance shortage.
Current Tongwei module electrical and temperature data can be checked on the module application and product page.
Match the Curve to the Likely Cause
| Curve result | Likely causes |
|---|---|
| Low Isc and low Imp | Low irradiance, dirt, broad shading, inactive cell area, current mismatch |
| Low Voc and low Vmp | High temperature, bypassed substring, shorted diode, missing cell section |
| Isc and Voc near normal but Pmax low | High series resistance, low shunt resistance, poor fill factor |
| Curve rounds near Voc | Weak solder joints, damaged ribbons, connector resistance, test-lead resistance |
| Current falls as voltage starts rising from zero | Low shunt resistance, cell leakage, some PID modes, junction damage |
| Step or second knee | Partial shading, mismatch, isolated cell area, bypass-diode operation |
| Large voltage section missing | Permanently bypassed substring or shorted bypass diode |
| Repeated curves change | Moving clouds, temperature drift, loose contacts, intermittent internal connection |
| Curve recovers after replacing leads | Test connection, adapter, clamp, or probe problem |
| Step disappears after removing a shadow | Temporary partial shading |
| Step remains after cleaning and retesting | Internal mismatch, disconnected area, or diode-related fault |
These patterns are clues, not final proof. A cell crack, a shadow, and a weak cell may all create a curve step. Another test is needed to confirm the physical cause.
Check the Module Circuit
The same fault can produce different curves in different module designs.
Common designs include:
- Full-cell modules
- Half-cut modules
- Multi-busbar modules
- Multi-wire and zero-busbar modules
- Shingled modules
- Modules with parallel half-sections
- Bifacial modules
A substring is a group of series-connected cells protected by a bypass diode.
In a traditional module with three similar substrings, each substring contributes roughly one-third of the total voltage. If the normal Voc is 49.5 V, each section contributes about:
49.5 V ÷ 3 = 16.5 V
If one diode becomes permanently shorted, the measured Voc could fall toward:
49.5 V − 16.5 V = 33.0 V
This is only an example of three similar protected sections. Half-cut, shingled, and special interconnection designs may not lose exactly one-third of their voltage.
Before diagnosing a missing voltage section, check:
- The cell count
- The number of bypass diodes
- The substring layout
- The parallel and series paths
- The junction-box circuit
- The product datasheet
Tongwei's comparison of MBB and 0BB solar cell technologies explains how interconnection layouts affect current collection, resistance, shading, and crack tolerance.
Hidden Cell Cracks
Cell cracks can form during cell processing, soldering, lamination, framing, packaging, transport, unloading, rooftop handling, clamp installation, wind loading, snow loading, or thermal cycling.
A crack does not always cause immediate power loss. Fingers, busbars, or wires may continue to connect both sides of the damaged area.
The electrical result depends on:
- The direction of the crack
- Whether it crosses busbars
- Whether fine fingers remain connected
- Whether wires bridge the crack
- Whether the damaged area is fully isolated
- The cell and substring layout
- Temperature and mechanical movement
A crack crossing 30% of a cell does not automatically cause a 30% power loss. If the conductors still connect the damaged area, the immediate loss may be small. If that area becomes fully isolated, the affected cell can limit the current of an entire series section.
Connected crack: The crack is visible in an EL image, but current still crosses the damaged area. Immediate power loss may be small.
Intermittent crack: The connection changes with temperature, bending, or vibration. Repeated I-V curves may not match.
Isolated crack: Part of the cell no longer contributes normal current. Isc, Imp, fill factor, and Pmax may fall, and a curve step may appear.
Electroluminescence imaging is better than normal photography for locating cracks and inactive regions. IEC TS 60904-13 gives methods for capturing, processing, and interpreting PV module EL images.[4]
An EL dark area does not show the exact watt loss. The image must be compared with the I-V curve. Tongwei's guide to EL testing before module installation explains how cracks, inactive areas, soldering defects, and mismatch appear in EL images.
High Series Resistance
Series resistance is unwanted resistance in the normal current path.
It can come from:
- Cell fingers and busbars
- Interconnect ribbons
- Solder joints
- Junction-box terminals
- Output cables
- Module connectors
- Test leads, adapters, and clamps
A weak solder joint may still pass a continuity test because the parts are touching. The problem becomes clearer when current rises and voltage is lost across the resistive point.
Electrical heating follows:
Heat loss = Current² × Resistance
If a resistive point is 0.02 Ω:
At 2 A: 2² × 0.02 = 0.08 W
At 13 A: 13² × 0.02 = 3.38 W
The heat loss rises from 0.08 W to 3.38 W, an increase of more than 42 times, even though current rises by only 6.5 times. This explains why a weak connection may look normal during a low-current test but become a hot spot under strong sunlight.
The example does not mean every solder joint carries the full 13 A. In a half-cut or parallel-branch module, local current depends on where the fault is located.
Typical curve signs include:
- Isc close to normal
- Voc close to normal
- Vmp clearly lower
- Fill factor lower
- A rounded curve near Voc
- A larger loss at high irradiance
NREL research has linked increases in module series resistance with solder-bond failures by comparing I-V measurements with thermal and luminescence images.[5]
Before blaming an internal ribbon or solder joint, replace the leads, clean the contacts, test a known-good module, and confirm that the abnormal curve stays with the suspect module.
Shunt Leakage
A shunt fault creates an unwanted path inside a cell or module. Part of the generated current flows through this shortcut instead of reaching the external circuit.
Possible causes include:
- Cell-edge damage
- Metallization defects
- Conductive contamination
- Moisture
- Encapsulant contamination
- Cell-junction damage
- Electrical overstress
- Some forms of PID
Common signs are low fill factor, weak low-light performance, lower Pmax, and a noticeable current drop as voltage begins rising from zero.
Series resistance and shunt leakage are different:
- Series resistance blocks the correct current path
- Shunt leakage creates an incorrect parallel path
- Series resistance mainly changes the high-voltage side of the curve
- Low shunt resistance mainly changes the low-voltage side
Both can reduce fill factor, so the entire curve must be reviewed.
Cell Mismatch and Partial Shading
Cells in one series path must carry nearly the same current. If one cell can produce 11 A while the others can produce 13 A, the weaker cell may limit that series section.
The difference between 11 A and 13 A is about 15.4%. If the weak cell controls the operating current, the loss can affect more than that single cell because the other cells in the same series path cannot operate at their preferred current.
Mismatch can come from cell efficiency differences, cracks, uneven temperature, contamination, poor solder connections, uneven encapsulant transmission, shading, or different degradation rates.
Mismatch can occur at three levels:
- Cell level: One cell produces less current than nearby cells
- Substring level: One diode-protected section is weaker than the others
- Module level: One module has lower current capacity than the other modules in a string
Possible curve signs include lower Imp, lower Pmax, shoulders, multiple knees, and bypass-diode operation.
A curve step does not prove that a bypass diode has failed. The diode may be working correctly — it may simply be responding to a shaded or weak cell or substring.
Temporary shading can come from clamps, cables, grass, leaves, bird droppings, dirt patches, test equipment, nearby structures, or uneven simulator illumination.
A temporary shading step usually disappears when the shadow is removed. A fixed internal step normally remains after cleaning and repeats under stable conditions.
Tongwei's guide to reducing PV string mismatch losses covers module current sorting, grading, shading, and string design.
Bypass Diode Faults
A bypass diode protects a group of cells when that section becomes strongly current-limited.
Shorted diode
A shorted diode permanently bypasses its protected substring. Voc and Vmp fall, Isc may remain close to normal, and a large voltage section may be missing.
In some traditional three-substring modules, one shorted diode can remove about 33% of the module voltage. Always compare the result with the actual circuit instead of applying a fixed percentage to every module.
Open diode
An open diode may not change the normal I-V curve under uniform illumination because the diode is not expected to conduct in that condition.
The risk appears during shading or mismatch. Without a working bypass path, weak cells may be forced into reverse bias and become hot. A normal curve under uniform light therefore does not prove that every bypass diode is working.
Loose diode connection
The diode may be healthy while its terminal or solder connection is loose. This can cause intermittent curve steps, junction-box heating, unstable results, or high resistance when the diode conducts.
Do not open junction boxes or disconnect PV connectors while current is flowing.
PID, Moisture, and Aging
Potential-induced degradation, or PID, is linked to electrical stress between the cells and grounded or conductive parts of the module and system.
Risk depends on system voltage, polarity, grounding, temperature, humidity, glass, encapsulant, cell design, and module construction.
PID is not one single fault. Some crystalline-silicon PID modes create shunt leakage. Other modes mainly affect voltage, recombination, polarization, passivation, corrosion, or other material interfaces.
IEC TS 62804-1:2025 includes separate procedures for evaluating PID-shunting and PID-polarization in crystalline-silicon modules.[6]
PID should not be diagnosed from low power alone. Useful evidence includes the I-V curve, EL pattern, system voltage, grounding design, string position, insulation condition, and comparison with nearby modules.
Moisture and corrosion can also change electrical output before visible discoloration appears. Corrosion at fingers, busbars, ribbons, solder joints, connectors, or junction-box terminals can increase resistance. Moisture may create leakage paths or reduce insulation.
IEA PVPS reports that module degradation often involves interacting mechanisms such as moisture ingress, encapsulant changes, corrosion, delamination, and electrical leakage.[7]
Tongwei's article on comparing solar module reliability explains how EL images, thermal results, damp-heat tests, PID tests, material changes, and field records should be reviewed together.
Wrong Irradiance
Standard Test Conditions use:
- Irradiance of 1,000 W/m²
- Cell temperature of 25°C
- The reference solar spectral distribution
A 600 W module tested outdoors at 800 W/m² should not be expected to produce 600 W before correction. Ignoring temperature for a quick estimate:
600 W × 800 ÷ 1,000 = 480 W
If the module is also hotter than 25°C, its expected power will be lower than 480 W.
Irradiance errors may come from:
- A dirty or uncalibrated reference cell
- The sensor and module being at different angles
- Sensor shading
- Moving clouds
- Reflected light
- A delay between the irradiance reading and I-V sweep
- Uneven simulator illumination
Low overall irradiance usually reduces current across the curve while keeping the basic shape similar. Uneven irradiance may create shoulders, steps, or multiple knees.
A reference sensor measures a small area. A correct sensor value does not prove that every cell across a module measuring more than 2 m² received the same light.
Tongwei's comparison of STC and NMOT module ratings explains why laboratory power and outdoor power differ.
Wrong Temperature
Module voltage normally falls as cell temperature rises. Current may increase slightly, but the voltage loss is usually larger, so total power falls.
Current Tongwei module data gives representative temperature coefficients of:
- Pmax: −0.28%/°C
- Voc: −0.24%/°C
- Isc: +0.046%/°C
- NMOT: about 45°C
If cell temperature rises from 25°C to 55°C, the difference is 30°C.
Estimated Pmax change:
30 × −0.28% = −8.4%
Estimated Voc change:
30 × −0.24% = −7.2%
Estimated Isc change:
30 × +0.046% = +1.38%
This shows why a hot module may have current close to or slightly above its 25°C value while voltage and total power are clearly lower.
For a 630 W module at the same irradiance, an 8.4% temperature loss gives:
630 × 0.916 = 577.08 W
If irradiance is also only 900 W/m²:
630 × 0.90 × 0.916 ≈ 519.37 W
A measured value near 519 W would be about 17.6% below the 630 W nameplate, but it could still be close to the expected output for those operating conditions.
Another example using a 650 W module, 900 W/m² irradiance, 55°C cell temperature, and a −0.29%/°C coefficient gives:
Temperature loss: 30 × 0.29% = 8.7%
Estimated power: 650 × 0.90 × 0.913 ≈ 534 W
A measured value of 525 W is about 1.7% below this simple estimate, not automatically 19% defective because it is 19% below the STC nameplate.
These calculations are only quick checks. Formal acceptance should use an approved I-V correction method. IEC 60891 defines procedures for correcting measured curves for irradiance and temperature.[8]
Temperature measurements can be wrong when the sensor is loose, placed near the frame, affected by wind, or used before the module reaches stable temperature.
Backsheet temperature is a local surface reading and may not exactly match effective cell temperature. IEC 60904-5 describes the open-circuit-voltage method for determining equivalent cell temperature.[9]
Spectrum, Contact, and Sweep Errors
Spectral mismatch
An irradiance sensor measures how much light arrives, but module current also depends on the wavelengths in that light.
Spectral mismatch matters when the simulator spectrum is poor, the reference device and module have different spectral responses, or thin-film, tandem, perovskite, or other unusual technologies are tested.
IEC 60904-7 gives a method for calculating spectral mismatch correction.[10]
Contact resistance
Bad test contacts can make a healthy module look as though it has high internal series resistance. Check connector pins, clamps, probes, adapters, cables, oxidation, and loose terminals.
If the abnormal curve disappears after changing the lead or adapter, the original result came from the test setup. If the resistance stays with the module, its connector or internal circuit requires investigation.
Sweep error
An I-V tester measures many current and voltage points during one sweep. A sweep that is too fast may not allow a slow-response or capacitive device to settle. A sweep that is too slow outdoors gives sunlight and temperature more time to change.
Check sweep settings when forward and reverse curves disagree, Pmax changes with sweep duration, or two verified testers produce different results.
Bifacial Test Errors
Bifacial modules receive light from both sides. Their test results may be wrong when rear irradiance is ignored, uneven, blocked, or increased by an uncontrolled reflective surface.
Bifacial testing may aim to:
- Measure front-side performance only
- Illuminate both sides under controlled conditions
- Convert front and rear irradiance into an equivalent condition
These methods should not be mixed.
A white floor may increase measured current. A rack, beam, junction box, or cable behind the module may block rear light and create local mismatch.
IEC TS 60904-1-2:2024 with its 2026 amendment defines additional requirements for bifacial I-V measurements, including rear-side conditions, irradiance non-uniformity, background control, and equivalent irradiance.[11]
Bifacial cell rear-side efficiency may range from more than 60% to over 90% of front-side efficiency. This does not mean a project will produce 60%–90% more energy. Actual bifacial gain is normally much smaller because rear irradiance is weaker than front irradiance and depends on ground reflectance, height, tilt, row spacing, and shading.[12]
For example, an 80% bifaciality value means the rear side can produce about 80% of front-side output when both sides receive the same test irradiance. If rear irradiance is only 150 W/m² while front irradiance is 1,000 W/m², the equivalent rear contribution is much smaller:
150 × 80% = 120 W/m² equivalent contribution
This simplified example gives an equivalent total of about 1,120 W/m² before considering non-uniformity, temperature, mounting losses, and other test corrections. It does not justify adding a fixed gain percentage to every bifacial project.
Tongwei's guide to reducing rear-side loss in bifacial modules covers rail blockage, junction boxes, row spacing, and uneven rear illumination.
Check the Reference Data
A healthy module can appear to fail when it is compared with the wrong data.
Check for:
- Wrong model number
- Wrong power class
- Incorrect serial number
- Flash data linked to another module
- Wrong cell count
- Wrong Voc or Isc limits
- Incorrect temperature coefficients
- A monofacial recipe used for a bifacial module
- An old datasheet revision
- Wrong degradation baseline
Power classes are often separated in 5 W steps. Comparing a 630 W module with the flash record of a 620 W or 625 W unit can immediately create an apparent 5–10 W difference before any real fault is considered.
An active-area setting normally affects efficiency or area-normalized results. It does not usually change the directly measured current, voltage, or Pmax.
Useful serial-number records include the original flash curve, test date, simulator ID, temperature, irradiance, power classification, EL image, production batch, rework history, and diode-test record.
Current product datasheets, installation manuals, warranty documents, and related records are available through Tongwei's module download center.
Use the Right Diagnostic Tool
| Method | What it can find | What it cannot prove alone |
|---|---|---|
| Visual inspection | External damage, dirt, burn marks, delamination, visible corrosion | Hidden electrical performance |
| I-V testing | Current, voltage, power, fill factor, curve steps | Exact physical fault location |
| EL imaging | Cracks, inactive regions, broken fingers, interconnection abnormalities | Exact watt loss |
| Thermal imaging | Hot cells, resistive joints, connectors, active bypass diodes | Every reason for low power |
| Diode testing | Shorted, open, or abnormal bypass-diode behavior | Cell cracks or full-module mismatch |
| Insulation testing | Insulation weakness and leakage | Normal sunlight power |
| Factory flash comparison | Change from the original electrical baseline | Exact cause or location |
IEA PVPS recommends combining infrared and EL imaging with I-V curves and system monitoring because the methods detect different faults.[13]
Follow a Practical Test Order
- Confirm the module: Check the model, serial number, Pmax, Voc, Isc, Vmp, Imp, power class, cell count, temperature coefficients, and bifacial design.
- Confirm the baseline: Choose the nameplate, original flash data, contract limit, commissioning result, or valid historical result.
- Clean the module: Remove dirt, fingerprints, residue, and bird droppings.
- Remove shadows: Check clamps, cables, sensors, nearby objects, and the rear side of a bifacial module.
- Record conditions: Measure plane-of-array irradiance, module temperature, wind, cloud movement, tilt, and sensor calibration.
- Repeat the curve: Perform several sweeps under stable conditions.
- Replace external parts: Change leads, adapters, probes, and the irradiance sensor where necessary.
- Read the curve shape: Identify low current, low voltage, low fill factor, fixed steps, or unstable results.
- Choose the next test: Use EL for cracks, thermal imaging for hot resistance points, and diode testing for missing voltage sections.
- Check safety: Inspect connectors, junction boxes, insulation, hot spots, cables, and signs of arcing.
Unstable curves do not always mean the tester is wrong. If unstable behavior can be reproduced under controlled conditions, the module may have an intermittent crack, solder joint, or connector fault.
Consider Measurement Uncertainty
Every I-V test has uncertainty from irradiance calibration, temperature measurement, spectral mismatch, current and voltage measurement, lead resistance, illumination uniformity, curve correction, and repeatability.
NREL has reported a specialized crystalline-silicon module calibration method with maximum-power uncertainty of about ±1.1% at a coverage factor of k = 2.[14]
That figure represents controlled laboratory calibration, not every field tester. Outdoor irradiance measurement uncertainty can be much larger. Published NREL analysis found that total pyranometer measurement uncertainty can approach 5% in some calibration and field-measurement conditions.[15]
If a corrected result is 1.5% below the acceptance limit while the combined test uncertainty is also near 1.5%, one reading may not be enough to prove failure.
The decision should consider:
- The size of the measured shortfall
- The stated test uncertainty
- Repeatability
- The contract limit
- The original flash result
- The curve shape
- Supporting EL or thermal evidence
A small difference with a normal curve may require a better test. A large, repeatable loss with a clear curve abnormality is stronger evidence.
Accept, Reject, or Isolate?
Separate three decisions.
I-V performance failure: The corrected electrical result is outside the agreed power or curve limit.
Protection failure: A bypass diode or another protective part does not work correctly, even though uniform-light power may appear acceptable.
Safety failure: The module has connector overheating, junction-box heating, insulation weakness, arcing, burn marks, damaged cables, or a serious hot spot.
A module should be quarantined or investigated further when:
- Corrected power remains below the agreed limit
- The curve abnormality repeats
- An intermittent fault can be reproduced
- A fixed curve step remains after shading is removed
- A substring has lost voltage
- EL shows inactive areas linked to power loss
- Thermal imaging shows serious heating
- A bypass diode is shorted or open
- A connector or junction box overheats
- An insulation or fire risk exists
IEC 61730-1:2023 covers module construction requirements intended to reduce electrical shock, fire, and mechanical safety risks.[16]
Passing IEC 61215 design qualification does not prove that every production module is free from defects. The standard also states that qualification results should not be treated as a numerical prediction of exact module life.[17]
Factory and Buyer Controls
Manufacturers can reduce hidden faults through cell sorting, pre- and post-lamination EL, solder-process control, ribbon pull testing, diode testing, calibrated flash testing, insulation testing, and serial-number traceability.
A defect may still escape the factory when it forms during transport, grows after thermal cycling, appears only under high current, is intermittent, or involves an open diode that does not conduct during normal flash testing.
For large orders, buyers should define:
- The electrical acceptance limit
- The temperature and irradiance correction method
- The allowed measurement uncertainty
- The EL sampling and rejection rules
- The retest procedure
- The required serial-number flash data
- Separate power and safety rejection rules
- Pre-shipment and arrival inspection records