What 5 factors affect photovoltaic cell efficiency
Key factors are sunlight intensity, cell temperature (efficiency drops ~0.5%/°C), shading, panel angle, and material quality. High-efficiency monocrystalline cells outperform polycrystalline. Dirt accumulation can reduce output by over 5%.
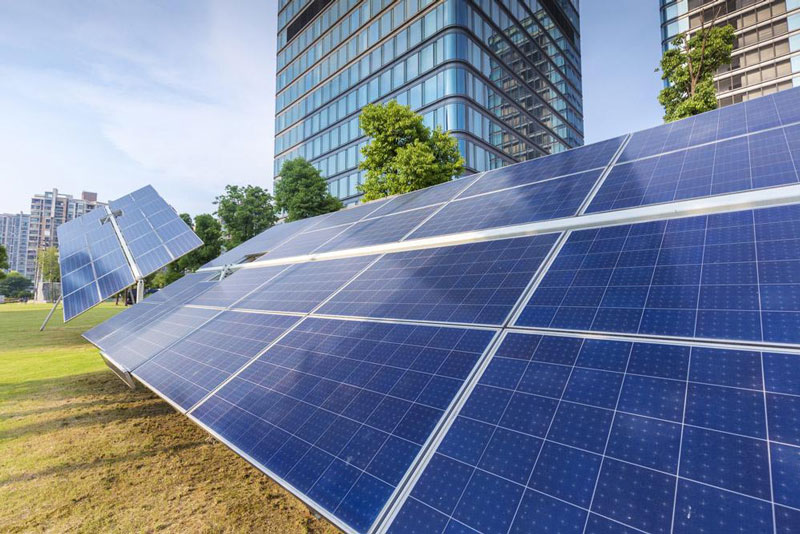
Sunlight Angle and Intensity
The power output of your solar panels isn't just about having a sunny day; it's about how the sun's rays actually hit them. The angle of sunlight, known as the angle of incidence, and the solar irradiance (intensity measured in watts per square meter - W/m²) are the fundamental drivers of efficiency. Simply put, when sunlight strikes a panel directly at a 90-degree angle, it delivers its maximum possible energy. For every degree of deviation from this perfect perpendicular strike, you lose a fraction of that potential power. This is why a panel's geographical location, the season, and the time of day cause such significant fluctuations in energy production, often creating efficiency swings of over 30% throughout a single day.
The core principle here is cosine loss. As the sun moves across the sky, the angle at which its light hits your panels changes. When the light is not perpendicular, the same amount of energy is spread over a larger panel area, reducing its effective intensity. For example, if the sun is at a 45-degree angle to the panel, the energy density is reduced by approximately 30% because the cosine of 45 degrees is 0.7. This is not a minor issue; it's a primary factor in daily energy generation curves.
This is where solar trackers come into play. These systems actively tilt panels to follow the sun's path from east to west. By maintaining a near-perpendicular angle of incidence for more hours of the day, single-axis trackers can boost energy output by 25-35% annually compared to fixed-tilt systems. However, they add 5-10% to the initial system cost and require maintenance. For most residential setups, the added cost and complexity of trackers often don't justify the gain. A more common and cost-effective solution is to optimize the fixed tilt and azimuth of the installation. For a permanent fix, panels are typically set at a tilt angle equal to the location's latitude to maximize annual yield. In the U.S., this means a 30- to 45-degree tilt for most states. A south-facing (azimuth of 180 degrees) orientation is standard in the Northern Hemisphere to capture the most sun throughout the day.
The time of day and season are direct applications of this. Solar irradiance peaks at around 1000 W/m² on a clear day at solar noon but can drop to 200 W/m² or lower in the early morning and late afternoon due to the extreme angle. Similarly, output in winter can be 50-60% lower than in summer not just because of shorter days, but also because the sun is lower in the sky, increasing the average angle of incidence.
Cell Temperature and Heat
It might seem counterintuitive, but stronger sunlight can make your solar panels less efficient. The culprit is heat. As photovoltaic cells absorb solar energy, their internal temperature rises, which directly hurts their performance. For every degree Celsius increase above the standard test condition of 25°C (77°F), a panel's efficiency typically drops by -0.3% to -0.5%. On a hot summer day, cell temperatures can easily reach 65-70°C (149-158°F), leading to a 12-20% absolute loss in power output compared to their lab-rated peak. This thermal derating is a critical, and often overlooked, factor in real-world energy yield.
The relationship between heat and performance is rooted in the physics of semiconductors. As temperature increases, the bandgap of the silicon material narrows. This causes a notable rise in electrical current (Isc), but a severe drop in voltage (Voc). Since the maximum power output (Pmax) is the product of current and voltage, the voltage loss dominates and overall power decreases. You can observe this clearly on a panel's datasheet in the temperature coefficients. For instance, a panel with a Pmax coefficient of -0.37%/°C will see its peak power drop by 3.7% for every 10°C increase in cell temperature.
Managing this heat is paramount for protecting your energy production and the panel's long-term lifespan. Prolonged exposure to high temperatures, especially above 85°C, can accelerate the degradation of encapsulants and other materials, potentially reducing the panel's operational life from 25-30 years to a much shorter period.
Factor | Impact on Cell Temperature | Typical Effect on Efficiency |
Ambient Air Temperature | A 35°C day can lead to cell temps over 70°C | Can cause >15% power loss |
Roof Type & Color | Dark shingles vs. light tiles can create a 10-15°C difference | A ~5% variance in output |
Mounting & Airflow | Poor airflow (flush mount) can be 20°C hotter than well-ventilated | ~7% more loss than racked systems |
Solar Irradiance | A jump from 800 W/m² to 1000 W/m² adds significant heat | Power loss increases despite more light |
The most effective mitigation strategy is passive cooling through airflow. Installing panels with a 5-6 inch gap between the module and the roof deck allows convective air currents to draw heat away. This simple design choice can lower operating temperatures by 15-20°C compared to flush-mounted systems, effectively reclaiming 5-8% of potential power losses on a hot day.
Material Quality and Type
Not all solar panels are created equal. The core materials—specifically the silicon used in the photovoltaic cells—dictate the fundamental efficiency ceiling, cost, and real-world performance of your solar array. While most panels may look similar, the choice between monocrystalline, polycrystalline, or thin-film technologies can result in a 15-20% absolute difference in efficiency ratings and a 25-30% variance in price per watt. This material choice is the first and most critical decision that sets the stage for energy production and financial payback.
Material Type | Avg. Module Efficiency | Cost per Watt (USD) | Key Characteristics |
Monocrystalline (PERC) | 22-23% | 0.95−1.20 | High purity, single-crystal silicon. Best efficiency & space efficiency. |
Polycrystalline | 17-19% | 0.70−0.90 | Multi-crystal silicon. Lower cost but also lower efficiency and heat tolerance. |
Thin-Film (CdTe) | 16-18% | 0.60−0.80 | Flexible, lightweight. Better performance in high heat & shade. |
The efficiency gap between panel types is primarily due to the crystal structure. Monocrystalline silicon is made from a single, pure crystal, which allows electrons to flow with less resistance. This translates to a higher conversion rate of sunlight into electricity. A typical 370-watt mono panel might measure about 1.8 meters by 1 meter. To output the same power, a 19% efficient polycrystalline panel would need to be roughly 10-15% larger in area, a crucial consideration for roofs with limited space.
Beyond the base material, manufacturing quality causes significant performance variation even within the same category. A key metric is the power tolerance. A panel with a 0 to +5% tolerance guarantees it will perform at or above its nameplate rating (e.g., a 400W panel will output 400-420W). Conversely, a panel with a ±3% tolerance could output as low as 388W, a 12-watt deficit right from the start. Over a 25-year lifespan, that small initial deficit compounds into a major energy loss.
For the budget-conscious, polycrystalline panels offer a lower upfront cost, potentially saving 1,500−3,000 on a 6 kW system. However, their lower efficiency and higher temperature coefficient (often -0.43%/°C vs. -0.35%/°C for mono) mean they will produce 8-12% less annual energy in a hot climate. This slower energy production extends the payback period by 2-4 years. For most homeowners, the long-term energy harvest of monocrystalline panels provides a 10-15% better return on investment, making them the overwhelmingly popular choice for new installations. Always prioritize the manufacturer's warranty—a 25-year performance guarantee that ensures the panels will still produce at 88-92% of their original output after 25 years is a key indicator of quality.
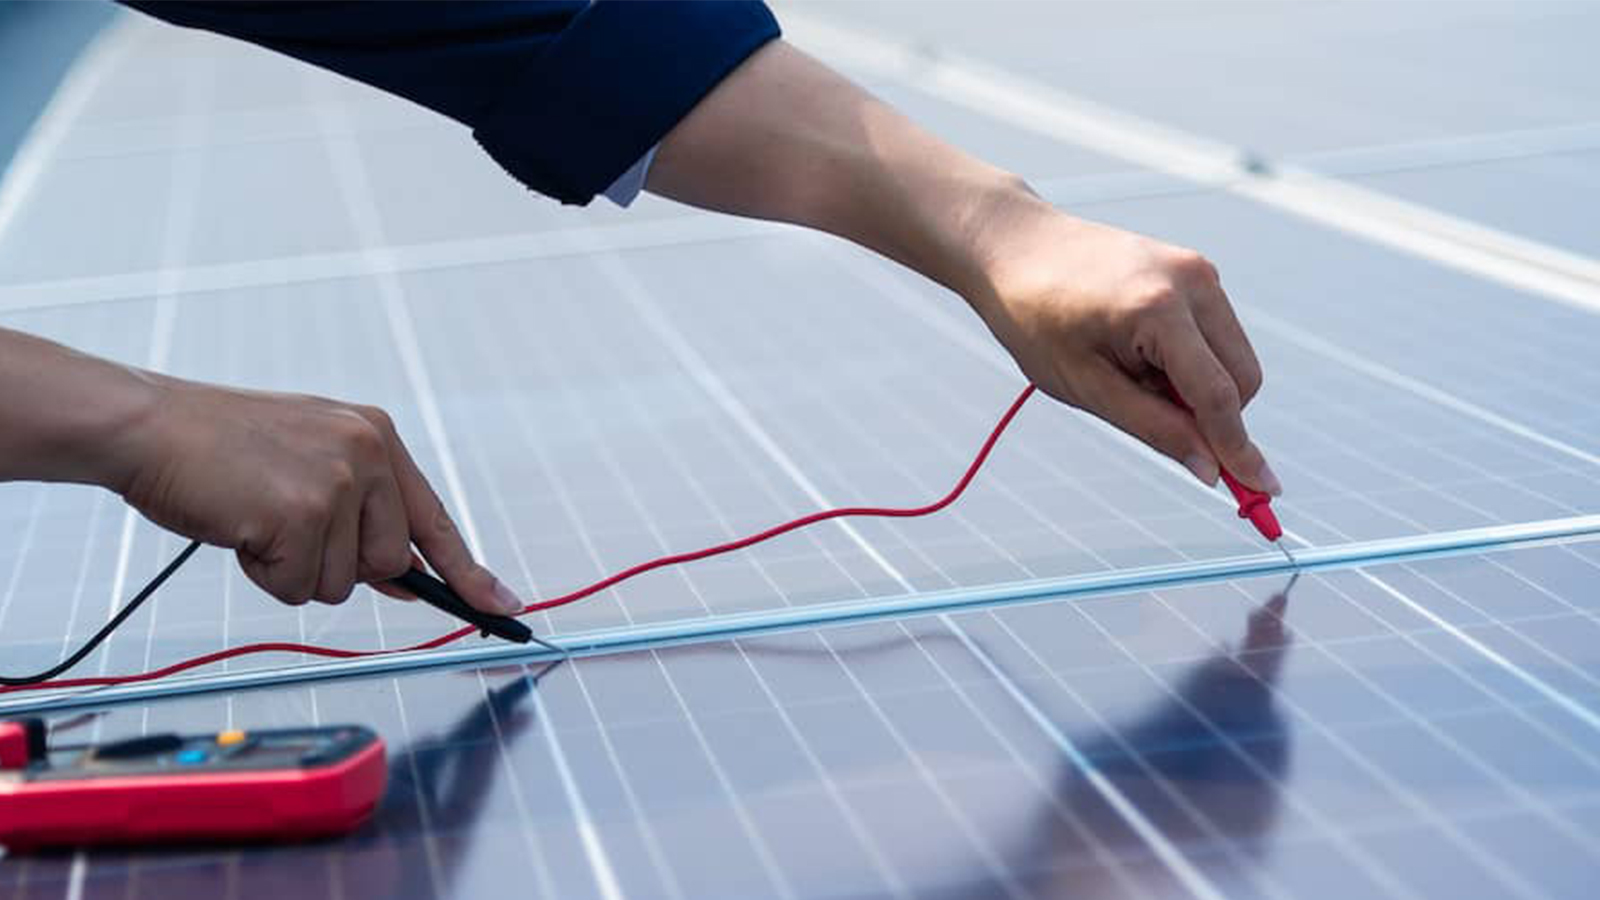
Electrical Losses in Circuits
Once your solar panels generate DC electricity, the journey to your outlets isn't 100% efficient. Between the panels and the grid, a portion of that hard-won power is lost as heat due to electrical resistance in the system's wiring and modules. These losses, often called "parasitic losses," can typically shave 5-10% off your total potential energy production. For a 10 kW system producing 16,000 kWh annually, that's 800-1,600 kWh lost—equivalent to 120−240 worth of electricity each year (at $0.15/kWh). Minimizing these losses is a direct path to maximizing your return on investment.
The primary culprits of electrical loss are resistance in cables and voltage drop. When electricity travels through a wire, the inherent resistance converts some power into heat, which is wasted energy. The longer and thinner the wire, the greater the resistance. This results in a voltage drop between the panel array and the inverter. A 2% voltage drop is generally considered the maximum acceptable limit for DC cabling in solar projects. For a system operating at 400 volts, a drop exceeding 8 volts signifies significant power loss. To combat this, installers must use cables with a sufficient cross-sectional area (thickness). For a 10 kW array, 10-gauge (or 6mm²) DC cable is often the minimum recommended size for runs under 30 feet. For longer runs of 60 feet or more, upgrading to 8-gauge (or 10mm²) cable can reduce resistive losses by 1.5-2%, paying for itself over the system's lifetime.
Beyond wiring, other modules contribute to overall system losses:
l Inverter Conversion Efficiency: Modern string inverters have peak efficiencies of 98-99%, but their weighted average efficiency (which accounts for varying power levels throughout the day) is a more realistic 96-97%. This means 3-4% of the DC power sent to it is lost during the conversion to AC.
l Mismatch Losses: When panels are connected in strings, the performance of the entire string is limited by its weakest-performing panel. Shading on one panel, soiling, or slight manufacturing variations can lead to mismatch losses of 1-3%.
l AC Side Losses: After the inverter, AC electricity travels to your main panel. Using undersized AC wiring here can create additional losses of 0.5-1%.
The cumulative effect of all these factors is substantial. A poorly designed system with high voltage drop (3%), a mid-tier inverter (96% weighted efficiency), and mismatch losses (2%) could have total electrical losses exceeding 10%. A well-designed system, using thick cabling and a high-efficiency inverter, can keep total losses closer to 5%. This 5% difference in performance on a large system is a significant financial consideration over 25 years.
Dirt, Shade, and Coverings
A thin layer of dust, a single shadow from a vent pipe, or a seasonal blanket of pollen can silently rob your system of 5-25% of its expected output. For a typical residential system, this can mean losing 1,000 kWh or more of generation annually, representing a 150−200 financial loss. Understanding and mitigating these physical blockers is essential for protecting your investment.
The impact of these factors isn't always linear. Partial shading is particularly damaging because of how panels are wired together. Modern modules usually contain 60 or 72 cells wired in series. If just one cell is shaded, it can act as a resistor, drastically reducing the power output of the entire panel and, consequently, the entire string. Key sources of obstruction include:
l Dust, Pollen, and Bird Droppings: A light coating of dust can reduce efficiency by 5%. In arid climates or after long dry spells, this layer can build up and cause losses exceeding 10%.
l Tree Shadow and Seasonal Foliage: The dappled shade from a tree throughout the day can easily cut production by 15-20%. Deciduous trees may only be a problem for 6-8 months of the year, but the impact is severe during that period.
l Structural Shadows: Chimneys, satellite dishes, and even the mounting rails of other panels cast small shadows. While they may seem tiny, these shadows can disproportionately reduce output by 3-5% each during peak sun hours.
The most effective and cost-efficient solution for soiling loss is regular cleaning. The optimal cleaning frequency is highly location-dependent. In areas with frequent rain (>1 inch per month), natural rainfall may be sufficient. In drier, dustier climates, a bi-annual cleaning—once in late spring (after pollen season) and again in early fall—can recover 95-98% of lost production. For a 6 kW system, this simple maintenance can restore over 600 kWh of energy per year, paying for the cost of a professional cleaning in 1-2 service cycles.
For shading issues, the solution lies in both system design and technology. The gold standard is to avoid shading altogether during the key production hours of 9 AM to 3 PM through careful array placement during the initial installation. If unavoidable, using module-level power electronics (MLPE) like power optimizers or microinverters is critical. Unlike traditional string inverters, where shading on one panel drags down the entire string, MLPE units isolate and maximize the output of each individual panel. This technology can reduce shading losses from a potential 25% down to just the percentage of the array that is actually shaded, a massive improvement. For a system plagued by a chimney shadow, this upgrade alone could boost annual output by 5-7%, often justifying the 0.08−0.15 per watt additional cost over the system's life.