What are 6 maintenance requirements for poly solar modules
Perform bi-annual cleaning with water and a soft brush to remove dirt, reducing efficiency losses by up to 30%. Regularly inspect for physical damage, check electrical connections are tight, and monitor for shading from new obstructions to ensure optimal performance.
Regular Cleaning of Surfaces
Research by the National Renewable Energy Laboratory (NREL) shows that dirty solar panels can lose 15-25% of their efficiency. In arid climates or near construction sites, losses can even exceed 30% annually. For a typical 6 kW residential system, that’s a potential loss of over $300 per year in energy production. Regular cleaning is not about aesthetics; it’s a direct maintenance action to protect your financial return and ensure the system operates at its peak performance.
The accumulation of dirt creates a shading effect, blocking photons from reaching the solar cells. The rate of soiling isn't constant; it depends entirely on your local environment. The key is to find a cost-effective cleaning schedule.
Location Profile | Recommended Cleaning Frequency | Estimated Soiling Loss (if uncleaned) |
Low Dust (Suburban, high rainfall) | 1-2 times per year | < 5% annual loss |
Moderate Dust (Agricultural, light pollen) | 2-4 times per year | 5-10% annual loss |
High Dust (Arid, desert, near highways) | 4-8 times per year | 15-25%+ annual loss |
For most homeowners, a semi-annual cleaning—once in late spring (after pollen season) and again in early fall—is sufficient. If you experience less than 10 inches of annual rainfall, you will likely need to clean more frequently.
Cleaning Methods and Cost Analysis
The goal is to remove grime without scratching the panel's anti-reflective glass coating.
· DIY Cleaning: The safest method is using a soft brush or a sponge with a long handle and a hose with deionized or softened water. Hard water can leave mineral deposits (scale) that are difficult to remove. A ~40-foot extension pole allows you to clean ground-mounted arrays or single-story roofs safely from the ground. The cost is essentially just your water bill and a small initial investment in tools (50−100).
· Professional Cleaning: For larger systems, multi-story homes, or for convenience, hiring a pro is effective. The average cost for a ~6 kW system ranges from 150to300 per service. Weigh this cost against the ~$900 of lost production you would avoid over a year if your system was losing 25% efficiency.
Actionable Tip: Visually inspect your panels monthly. If you see a noticeable layer of dirt or a 5% drop in your energy output compared to a clear day at the same time last year (check your inverter's monitoring app), it's time to clean.
Checking Electrical Connections
A single faulty connection within a string of panels can lead to a >30% drop in power output for that entire series. Furthermore, a high-resistance connection generates excessive heat, creating a fire risk. According to industry insurance data, ~18% of solar-related fire incidents are attributed to electrical faults, many preventable with simple biennial (every 2 years) checks. This isn't just about efficiency; it's a critical safety protocol that protects your 25-year investment.
The electrical integrity of your solar system is its lifeline. Connections at the MC4 connectors on the back of panels, within the combiner box, and at the inverter terminals are subject to thermal cycling. As panels heat to 65°C (149°F) and cool down daily, metals expand and contract, which can gradually loosen terminals over ~5 years. This increased resistance converts valuable electricity into waste heat instead of power for your home.
You should perform a visual and physical inspection of accessible connections every 2 to 3 years. The optimal time is during a scheduled cleaning when the system is already shut down. Crucially, always shut down the system completely via the AC and DC disconnects before inspecting any wiring. Start at the combiner box, checking for any signs of melting, discoloration, or corrosion on wire nuts and terminal blocks. A tell-tale sign of a problem is a black sooty residue around a connection.
Next, move to the panels. Gently tug on MC4 connectors to ensure they are fully snapped together and locked. A loose MC4 connector can cause arcing and a >50% power loss in its string. For a more advanced check, use a thermal camera or infrared thermometer ~1 hour after peak production to scan connections. A connection that is >20°C (36°F) hotter than surrounding ones indicates a serious problem that needs immediate attention.
While a DIY visual inspection is feasible, hiring a certified electrician every 5 years for a thorough torque check and thermal scan is a wise investment. The average cost for this service is 200−400, but it can identify a failing connection that, if left unchecked, could lead to thousands in lost production or, in a worst-case scenario, catastrophic system failure. This simple, infrequent task ensures every watt your panels generate makes it to your meter.
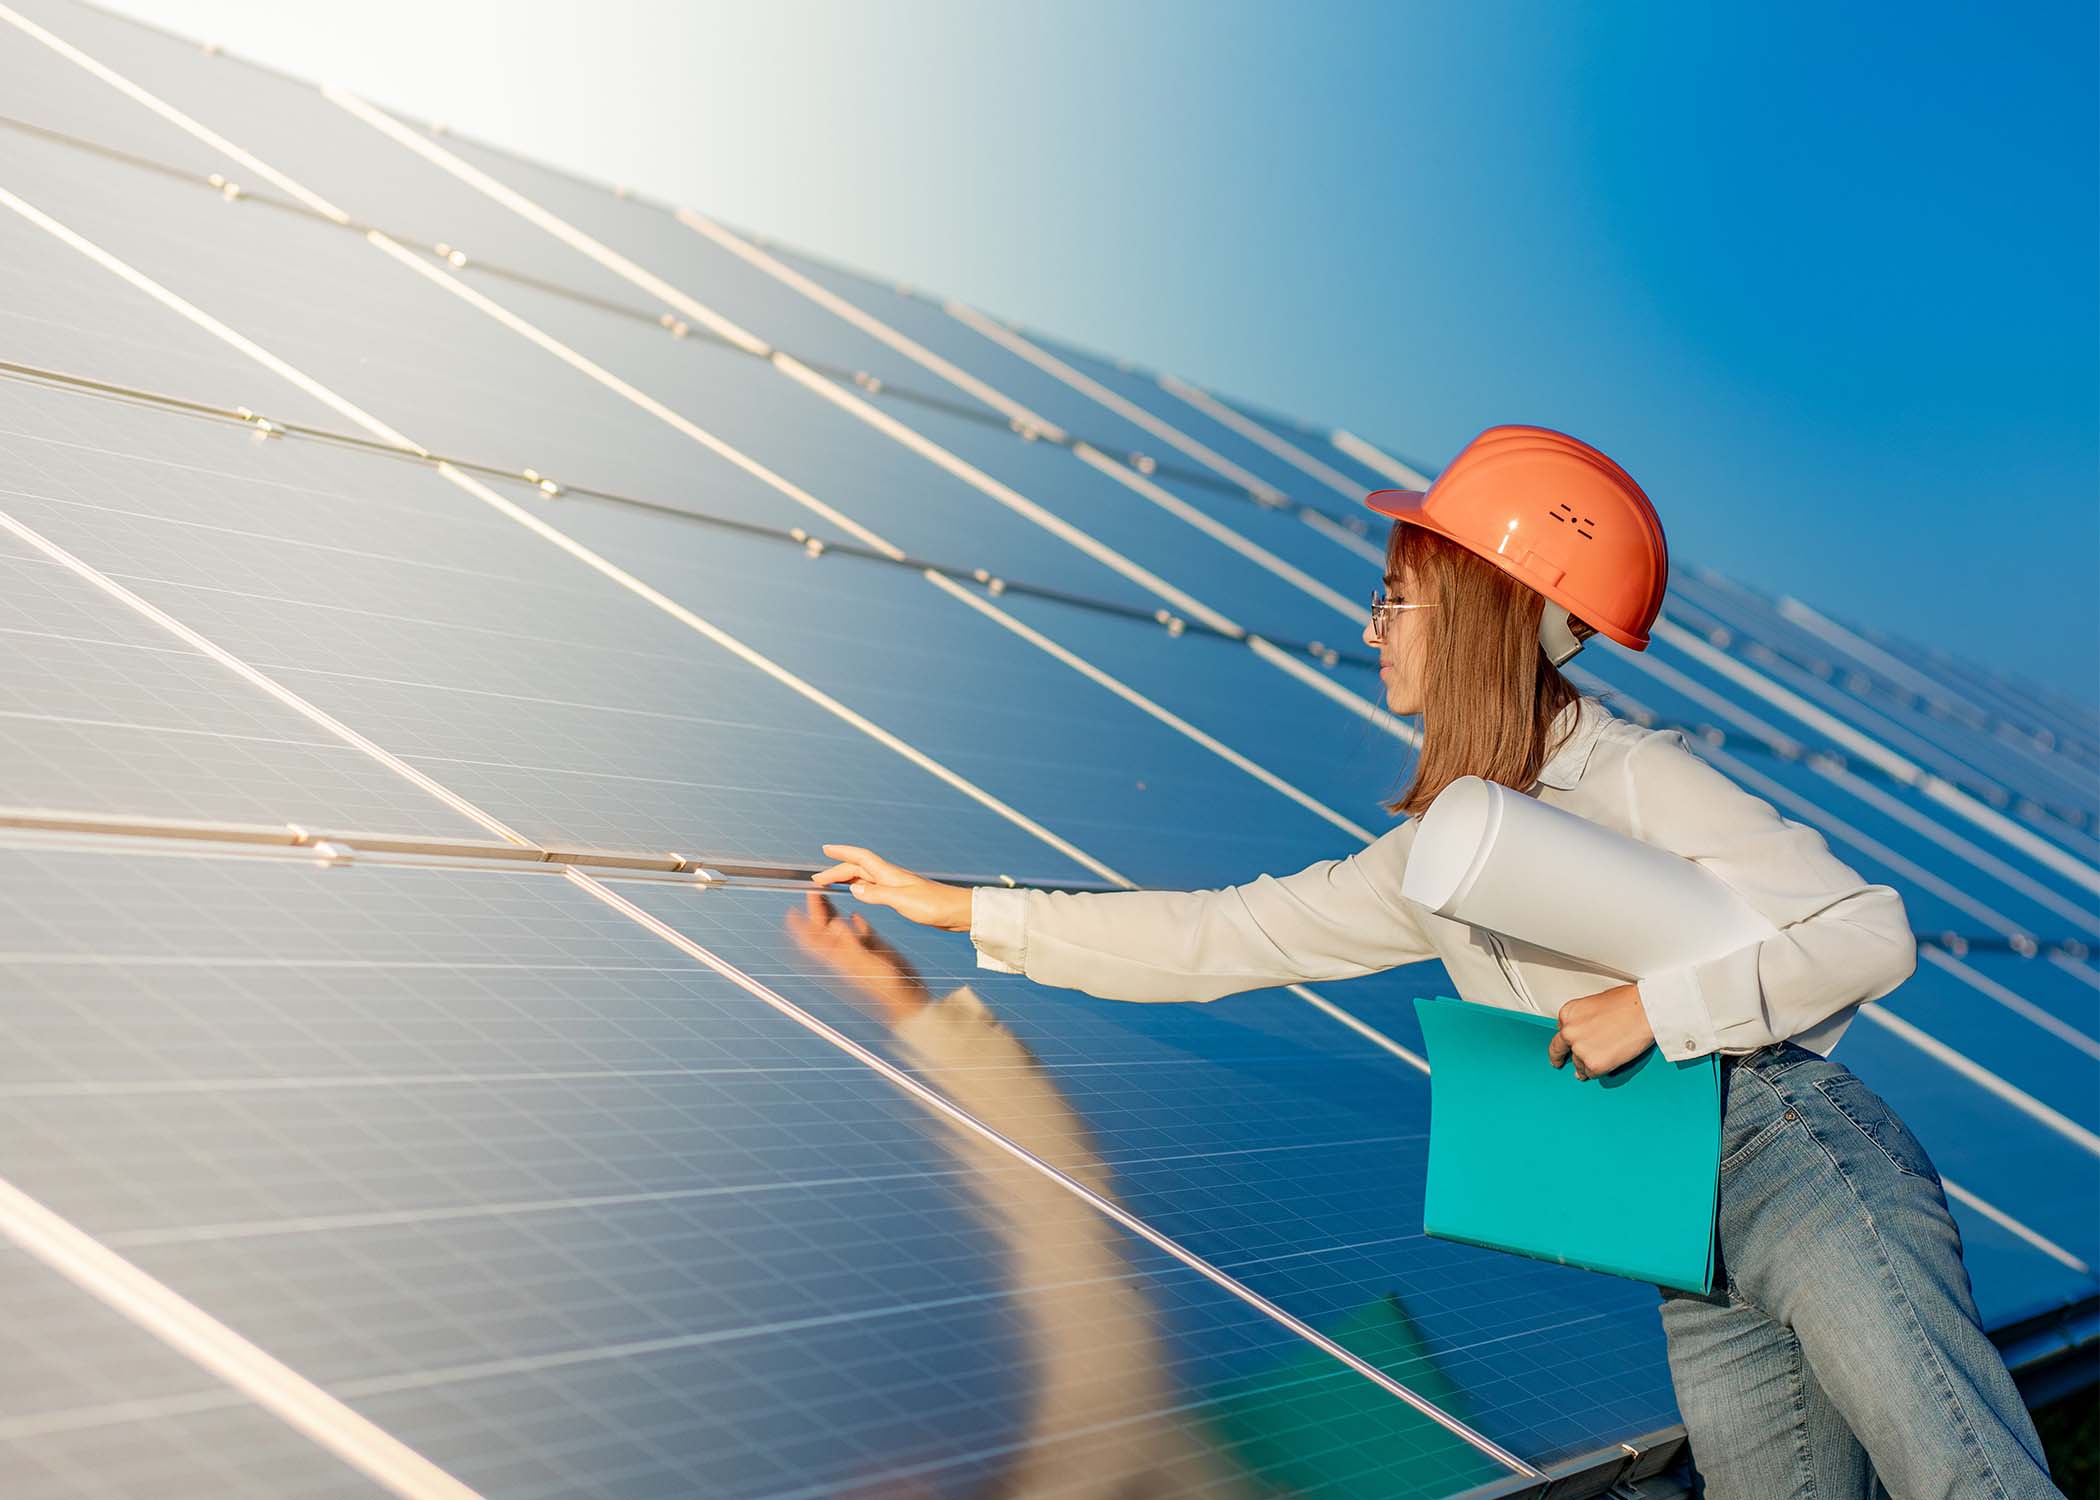
Inspecting for Physical Damage
A study by the National Renewable Energy Laboratory (NREL) found that microcracks in cells can propagate over time, reducing a module's power output by 1-2% per year, compounding annually. Hailstorms are a major culprit, with ~5% of claims involving broken glass. A single cracked panel can drag down the performance of an entire string by over 20%. Catching damage early is critical; a 300 panel replacement is far cheaper than years of lost energy production and potential wateringress that can cause a 2,000+ inverter failure.
Routine visual inspections are your first line of defense. You should conduct a ground-level visual scan with binoculars every month and perform a closer, hands-on inspection (after system shutdown) at least once a year. The goal is to identify issues while they are small and manageable.
Pro Tip: The best time to inspect is early morning or late afternoon when the sun is low. The angled light makes scratches, cracks, and imperfections cast visible shadows, making them much easier to spot.
Focus your inspection on these key areas:
1. Glass Surface:
Look for cracks, chips, and deep scratches. A hairline crack might seem insignificant, but it can compromise the panel's moisture barrier. Over ~3 years, humidity ingress can lead to internal corrosion and cell degradation, potentially reducing the module's output by >15% and voiding its 25-year warranty. Pay special attention to the edges of the glass, where stress fractures are most likely to originate.
2. Backsheet and Frame:
The polymer backsheet protects the internal modules. Look for any whitening, bubbling, or cracks, especially near the junction box. A compromised backsheet exposes wiring to UV radiation and moisture, increasing the risk of ground faults. Inspect the aluminum frame for any signs of deformation or twisting. A frame bent more than ~2 mm out of alignment can indicate a potential mounting issue or stress point that needs addressing.
3. Cell Condition:
Use a digital camera or your phone's camera to zoom in on the cells. Look for a pattern of fine lines, known as microcracks. These are often caused by hail impact or improper installation stress. While a few microcracks may only cause a 1-3% power loss in the module initially, they can grow under thermal cycling, leading to a >10% loss over 5 years. Also, look for "snail trails," which are dark, silvery lines that often indicate an underlying crack that has already begun to oxidize and degrade.
Document Everything. If you find damage, take high-resolution photos from multiple angles with a ruler or coin in the frame for scale. This documentation is essential for filing a warranty claim or an insurance claim. Most manufacturers will deny a warranty claim if the damage is deemed "physical" and not a material defect, so your homeowner's insurance is often the primary path for repair. The average deductible for such a claim is 500−1,000, so it's only cost-effective for more significant damage affecting multiple panels. For a single panel replacement, the total cost, including labor, typically ranges from 400to800, making it often an out-of-pocket expense.
Monitoring Performance Output
A sudden or gradual drop in output is the first sign of issues like shading, soiling, or module failure. Industry data shows systems losing >1.5% of output per year often have an underlying, fixable problem. For a 10 kW system, that’s a 40 annual loss that compounds over time. Modern inverters provide granular data; ignoring it is like ignoring a 10 mpg drop in your car's fuel economy. Proactive monitoring protects your 15,000-$25,000 investment and ensures you get the promised 90%+ output for the first 10 years.
Consistently tracking your system's key performance metrics allows you to identify problems before they significantly impact your wallet. You should check your inverter's monitoring app or portal at least once a month to spot trends.
Metric | What to Look For | Actionable Threshold |
Daily Energy Production (kWh) | A gradual decline over 3-6 months, not explained by seasonality. | A >10% drop from the same month last year. |
Peak Power (kW) | The maximum power the system produces on a clear, sunny day around solar noon. | A >5% reduction in peak power year-over-year. |
Specific Yield (kWh/kWp) | Energy produced per 1 kW of installed capacity. The best efficiency metric. | A value consistently >10% below the estimated average for your location. |
Pro Tip: The most accurate comparison is to use PVWatts (a free NREL tool) to get a monthly production estimate for your system's size and location. Compare your actual data to these estimates. A consistent >8% underperformance against the PVWatts model indicates a likely system issue.
Don't just look at the totals; dig into the time-based data. A string inverter showing a ~30% dip in output every afternoon points to a new shading issue, like a growing tree branch. Microinverter systems can pinpoint a single panel underperforming by >15%, signaling a potential fault. This level of detail turns a vague feeling of "my bill seems high" into a targeted diagnosis.
Set up email or text alerts for zero production events, which indicate a complete system shutdown, often from a grid outage or inverter fault. Also, monitor for low production alerts, which you can set at, for example, < 50% of expected output on a clear day. This immediate notification can shave days or weeks off your response time to a problem, saving you 2−5 in lost production every day the issue goes unfixed. If your system lacks built-in monitoring, a third-party energy monitor like Sense or Emporia Vue, costing 200−300, can provide the necessary data granularity. This investment often pays for itself in < 2 years by identifying efficiency losses early.
Ensuring Mounting Stability
A single loose bolt can create a point of failure; in high winds, a panel experiencing >50 psf of uplift pressure can become a dangerous projectile. Industry studies indicate that ~12% of warranty claims related to physical damage stem from mounting system failures, not the panels themselves. For a 7 kW system, a racking failure that damages multiple panels and the roof could lead to a 8,000−15,000 repair bill. An annual 15-minute visual check is a cheap insurance policy against this low-probability, high-cost risk.
The mounting system—rails, clamps, lag bolts, and flashings—is subject to constant stress. In a 70 mph wind event, a single panel can experience over 400 lbs of uplift force. Over ~10 years, thermal expansion and contraction from daily 40°F temperature swings can cause metal fasteners to relax slightly. This is why a proactive inspection regimen is critical. You should perform a visual inspection from a safe vantage point (e.g., using binoculars from the ground) every 3 months after severe weather and a more thorough check by a qualified professional every 5 years.
Focus your inspection on three key areas. First, check for corrosion, especially on galvanized steel or aluminum modules near the coast or in industrial areas. Even minor surface rust can weaken a critical connection by ~5% annually. Second, look for physical deformation. Are any rails bent or twisted more than ~2 mm out of alignment? This could indicate an impact or excessive snow load beyond the system's 40 psf design rating. Finally, and most importantly, listen and look for movement. On a windy day, the array should be silent and rock-solid. Any audible rattling or visible vibration of more than ~1/4 inch is a red flag that requires immediate attention.
While a visual inspection can identify obvious issues, a professional inspection every 5 years is non-negotiable for safety. A certified installer will use a torque wrench to check that all critical bolts are tightened to the manufacturer's specification, typically between 15-45 ft-lbs, depending on the module. This re-torquing addresses the natural relaxation of metal fasteners over time. The average cost for this service is 200−400, a trivial amount compared to the potential cost of structural failure. This simple maintenance task ensures your system remains anchored, safe, and producing energy for its entire 25-year lifespan.
Vegetation and Shade Management
Trees are dynamic assets that grow, on average, 1-2 feet per year. A branch that was 5 feet from your array during installation can become a significant source of shading in just 36 months. Even partial shading from a single thin branch can cause a disproportionate ~30% power loss in an entire string of panels due to how modern inverters manage current. For a typical household system, this can mean losing 25−40 in potential energy production every month during peak sun hours. Proactive vegetation management isn't landscaping; it's a direct and calculable maintenance activity to protect your system's 20-year ROI.
Shading is one of the most detrimental and preventable causes of energy loss. Unlike dust, shade doesn't just reduce light; it can cause complex electrical imbalances. The impact varies drastically based on the type of shading and your inverter technology.
Shading Type | Impact on String Inverter | Impact on Microinverters | Recommended Action |
Light Morning/Afternoon (Leaf Shadows) | Moderate. Can reduce string output by 15-25%. | Minimal. Only the affected panel's output drops by ~80%. | Trim branches back by ~3 feet from the array's edge. |
Heavy Mid-Day (Thick Branches/Trunks) | Severe. Can reduce string output by >50%. | Significant. The affected panel(s) output drops by ~95%. | Remove the offending branch entirely or consider ~8 ft tree trimming. |
New Seasonal Growth (New Buds/Leaves) | Gradual. A ~5% monthly output decline in spring. | Gradual. Only affects panels under new growth. | Schedule an annual pre-spring trimming before full foliage. |
The financial calculus is clear. Hiring an arborist for a 250 annual trimming service is a direct investment if it prevents 400 in lost energy production over the following 12 months. You can calculate this yourself: use your monitoring app to note the power output drop when a shadow crosses a panel. A 15% dip for 3 hours a day equates to nearly ~50 kWh of lost production per month.
For new plantings, enforce a strict 20-foot rule from the edge of your array for any species expected to exceed 15 feet in height at maturity. For existing trees that cannot be trimmed sufficiently, a more permanent solution might be economically justified. The cost of removing a large tree can range from 700 to 5,000, which is a significant expense. However, if that tree is causing a 30% annual production loss on a 10 kW system (a ~$900 value), the removal investment can have a payback period of ~4-6 years. Monitor your system's performance data religiously to make these financial decisions with confidence, not guesswork.