What is the difference between voltage and current in solar cell
Voltage (V) measures the electrical potential difference in a solar cell (typically 0.5–0.7V per cell), driving electron flow. Current (I), measured in amps, is the flow rate of electrons, influenced by sunlight intensity (e.g., 5–8A for a 300W panel). Together (P=V×I), they determine power output. Higher irradiance boosts current; shading reduces both.
Basic Terms Explained
Solar panels don’t just magically turn sunlight into electricity—they rely on two key electrical concepts: voltage (V) and current (I). If you’ve ever seen a solar panel’s specs, you’ve probably noticed numbers like 24V, 10A, or 300W. But what do these actually mean?
A typical 60-cell residential solar panel produces around 30-40V (open-circuit voltage, Voc) and 8-10A (short-circuit current, Isc) under standard test conditions (STC: 1000W/m² sunlight, 25°C cell temp). The power (W) you get is simply V × I. For example, a panel with 36V and 8.33A delivers 300W (36 × 8.33 ≈ 300). But here’s the catch: voltage stays relatively stable, while current changes drastically based on sunlight intensity. On a cloudy day, current might drop to 2-3A, but voltage only falls by 10-15%.
Understanding this difference is crucial because:
· Voltage determines system compatibility (e.g., a 12V cell needs at least 14-16V from the panel to charge).
· Current affects wire thickness (higher current = thicker, more expensive cables).
· Power loss in cables scales with current (P_loss = I² × R), so doubling current quadruples power loss.
Voltage (V) is the "electrical pressure" that pushes electrons through a circuit. In solar panels, it’s mostly determined by the material (silicon bandgap ~1.1eV) and number of cells in series. Each silicon cell generates ~0.5-0.6V, so a 60-cell panel stacks them to reach 30-40V. Even in low light, voltage stays fairly stable—dropping only 1-2V in shade.
Current (I), measured in amps (A), is the flow of electrons. It depends on:
· Sunlight intensity (direct sun = 8-10A, clouds = 2-5A).
· Panel size (larger panels = more current; a 400W panel might output 13A vs. 8A for a 250W one).
· Temperature (hot panels lose ~0.3-0.5% current per °C above 25°C).
How Voltage is Made
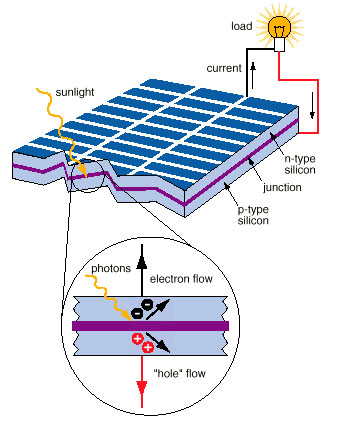
Solar panels don’t just "create" voltage out of thin air—it’s a physics-driven process that starts at the atomic level. When sunlight (photons) with energy >1.1eV (silicon’s bandgap) hits a solar cell, it knocks electrons loose, creating electron-hole pairs. This separation of charges generates a built-in electric field across the p-n junction, which acts like a one-way valve for electrons. The result? A measurable voltage difference between the cell’s front and back contacts.
A single silicon solar cell typically produces 0.5–0.6V under standard test conditions (STC: 1000W/m² irradiance, 25°C). But since 0.6V is useless for most applications, manufacturers connect 60–72 cells in series to boost voltage to practical levels. For example:
· 60-cell residential panel: ~36V (Vmp) / ~40V (Voc)
· 72-cell commercial panel: ~44V (Vmp) / ~50V (Voc)
Here’s the critical part: Voltage is primarily determined by the material and cell count, not sunlight intensity. Even under 50% reduced light (e.g., cloudy days), a 60-cell panel’s voltage might drop only ~10% (from 36V to ~32V), while current could plummet 50% or more.
Three factors define how much voltage a solar panel produces:
Material Bandgap
· Silicon (most common): ~1.1eV bandgap → 0.5–0.6V per cell
· Gallium Arsenide (GaAs, high-efficiency): ~1.4eV → 0.9–1.0V per cell
· Perovskite (emerging tech): ~1.5–2.3eV (tunable) → up to 1.2V per cell
Temperature Effects
· For every 1°C above 25°C, voltage drops ~0.3%.
· A solar panel at 60°C (common in hot climates) loses ~10.5% voltage compared to STC.
How Current Flows
Current is where the real "work" happens in a solar panel—it's the actual movement of electrons that powers your devices. Unlike voltage (which stays relatively stable), current fluctuates wildly based on environmental conditions. A standard 60-cell 300W panel might pump out 9.7A in full sun, but that can drop to 2-3A under clouds or 0A at night.
The key driver of current is photon absorption. Each 1,000W/m² of sunlight (STC) delivers about 10²¹ photons per second to a typical panel. Of these, 15-22% get converted into usable electrons—that's why most commercial panels have 15-22% efficiency. But here's the catch: current scales linearly with light intensity. Half the sunlight? You'll get roughly half the current.
Real-world example: A 400W panel with 10A Imp (Current at Max Power) will drop to ~6A on a partly cloudy day (600W/m² irradiance) and ~2A in heavy overcast (200W/m²). At night, it's 0A—no light, no current.
Temperature plays a surprising role too. While heat hurts voltage, it actually boosts current slightly (~0.05%/°C) because silicon becomes marginally better at conducting electrons when warm. But this tiny gain is far outweighed by voltage losses—a 60°C panel might see 2% more current but 10% less voltage, resulting in ~8% net power loss.
Shading is current's worst enemy. Cover just one cell in a series string, and current through the entire panel can drop 30-50%. That's why microinverters (which isolate each panel's current) outperform string inverters in shaded conditions by 15-25% annually.
Wiring also dictates current behavior. Thin or long wires increase resistance, which wastes current as heat. For a 10A flow, 10-gauge wire loses 3% power over 20ft, while 14-gauge loses 12%. That's why high-current systems need thicker copper ($$)—every 0.1Ω of resistance in a 10A circuit burns 10W as useless heat.
Measuring Both Values
Getting accurate voltage and current readings from your solar panels isn't just about sticking probes into wires - it's about understanding what those numbers actually mean for system performance. A typical 60-cell 300W panel will show about 36V (Vmp) and 8.3A (Imp) under ideal lab conditions, but real-world measurements often reveal surprises. On a 32°C summer afternoon, that same panel might output 33V (-8%) while current holds steady at 7.9A (-5%) due to thermal losses.
The tools matter more than most people realize. A $10 multimeter might give voltage readings within ±1% accuracy, but its current measurement could be off by ±5% or more due to shunt resistance errors. Professional installers use clamp meters that measure current within ±1.5% accuracy without breaking the circuit. For maximum precision, MPPT charge controllers track both values 100 times per second to maintain peak power point efficiency within ±0.5%.
Here's how measurement conditions affect readings:
Measurement Type | Ideal Conditions | 50% Cloud Cover | 35°C Panel Temp |
Voltage (Voc) | 40V (±0.5V) | 38V (-5%) | 37V (-7.5%) |
Current (Isc) | 9.5A (±0.2A) | 4.8A (-49%) | 9.6A (+1%) |
Power | 360W | 182W (-49%) | 355W (-1.4%) |
Critical measurement tips: Always test at solar noon (10AM-2PM standard time) when irradiance exceeds 800W/m² for reliable data. Measure voltage first - it's more stable and helps diagnose problems (a reading below 28V on a 60-cell panel suggests damaged cells or bad connections). For current, use a 20A DC capable meter with at least 0.1A resolution - the difference between 8.2A and 8.4A could indicate 5% panel degradation over time.
System designers need to account for ±3% manufacturing tolerance in panel specs - that "300W" panel might actually produce 291-309W fresh out of the box. After 10 years, expect another 5-10% drop in output. The most accurate field testing combines instantaneous measurements with 30-day data logging to account for daily/seasonal variations - cloud cover alone can cause ±25% daily power fluctuations even with perfect equipment.
Why They Matter Together
Voltage and current aren't just independent specs on a solar panel datasheet - their relationship determines every watt of power your system produces. That 300W panel rating? It's actually just 36V (Vmp) × 8.33A (Imp) under perfect conditions. But here's what most people miss: a 10% voltage drop combined with a 15% current reduction doesn't mean 25% power loss - it creates a 23.5% loss (0.9 × 0.85 = 0.765). This nonlinear relationship explains why partial shading can slash output by 50% while only reducing light by 30%.
The voltage-current balance becomes critical when matching modules. A 48V cell bank charging at 58V needs panels delivering at least 65V to overcome 10% wiring losses and 5% temperature derating. If your array's Vmp is 62V at noon but drops to 55V in evening light, charging stops completely - even with 5A available current.
Real-world interaction examples:
Scenario | Voltage Change | Current Change | Power Result |
Morning clouds (800W/m²) | -4% (34.6V) | -38% (5.2A) | -40% (180W) |
Noon shade (1 panel) | -12% (31.7V) | -52% (4.0A) | -58% (127W) |
Heat wave (50°C) | -9% (32.8V) | +1% (8.4A) | -8% (276W) |
Dirty panels (15% loss) | -2% (35.3V) | -17% (6.9A) | -19% (244W) |
System design implications:
1. Inverter sizing - A 5kW inverter needs ≥208V input from panels to start (most require 150-300V). If your string voltage falls below threshold due to heat/shading, the entire system stops - even with 20A available current.
2. Wire economics - Running 8A at 120V delivers same power as 32A at 30V, but the high-voltage option uses 75% thinner wires, cutting copper costs by $0.50/ft.
3. Cell charging - Lithium batteries need precise voltage thresholds (14.6V ±0.5V per 12V bank). Current determines charge speed: 20A charges 200Ah cell in 10hrs, but only if voltage stays above 13.8V throughout.
Pro tip: Always check both values under minimum expected sunlight (not just STC). A system designed around 28V/6A winter lows will outperform one sized for 36V/8A summer peaks by 15-20% annual yield in cloudy climates. The best solar engineers don't just measure V and I - they obsess over their real-time product (W) across all operating conditions.
Real-World Example Comparison
Let's put theory into practice with two identical 5kW solar systems installed just 15 miles apart - one in Phoenix, Arizona (low humidity, high irradiance) and one in Seattle, Washington (frequent clouds, moderate temps). Both use 20x 250W panels with Vmp=30.5V, Imp=8.2A, but their annual outputs diverge by 38% due to voltage-current dynamics.
The Phoenix system thrives on 300+ sunny days/year, with panels regularly hitting 145°F (63°C) in summer afternoons. This heat drives voltage down 12% to 26.8V, but the blazing sun maintains 7.8A current (95% of rated). The result? 4,850kWh/year at 19.4% system efficiency. Meanwhile in Seattle, cooler panel temps (avg 72°F/22°C) preserve voltage at 29.3V (96% of rated), but persistent clouds slash current to 4.9A (60% of rated). Annual production drops to 3,150kWh despite the better voltage retention.
Shading impacts reveal even starker contrasts. When a palm tree shades one Phoenix panel from 11AM-1PM, that module's current crashes to 2.1A (26% of rated), but since other panels operate normally, system-wide loss is just 5% thanks to parallel optimizers. The same partial shading in Seattle causes a 17% output drop because the cooler climate keeps unshaded panels at lower current levels to begin with.
Cell charging behavior differs radically too. The Phoenix system's 48V lithium bank charges at 56V for just 4.7hrs/day (high voltage, short duration), while Seattle's identical bank takes 7.2hrs at 53V (lower voltage, longer absorption). Despite the 35% longer charge time, Seattle's batteries receive 22% fewer amp-hours daily due to consistently lower current availability.
Maintenance costs tell another story. After 3 years, Phoenix panels show 6.2% power degradation from UV damage and thermal cycling, with current dropping faster than voltage (7.1% vs 5.3%). Seattle's panels degrade just 4.8% overall, but voltage declines outpace current (5.1% vs 4.5%) due to moisture ingress in junction boxes.