Why are my solar panels not producing enough power?
First is shading and dirt: even if only 10% of the area is obscured by fallen leaves or bird droppings, total power generation can plummet by over 30% or more through the "hot spot effect."
Second is Conversion Efficiency and Temperature: commercial monocrystalline silicon panel efficiency is usually between 17%-22%, but for every 1°C increase in panel temperature, output power drops by about 0.4% (based on 25°C), so extreme summer heat may actually reduce production.
In addition, Inverter Loss and Line Aging (usually accounting for 3%-5% loss) are also major causes.
It is recommended to check the panel tilt angle quarterly (the optimum is usually the local latitude) and clean off dust, which can effectively increase power output by 5%-15%, ensuring your green investment achieves maximum returns.
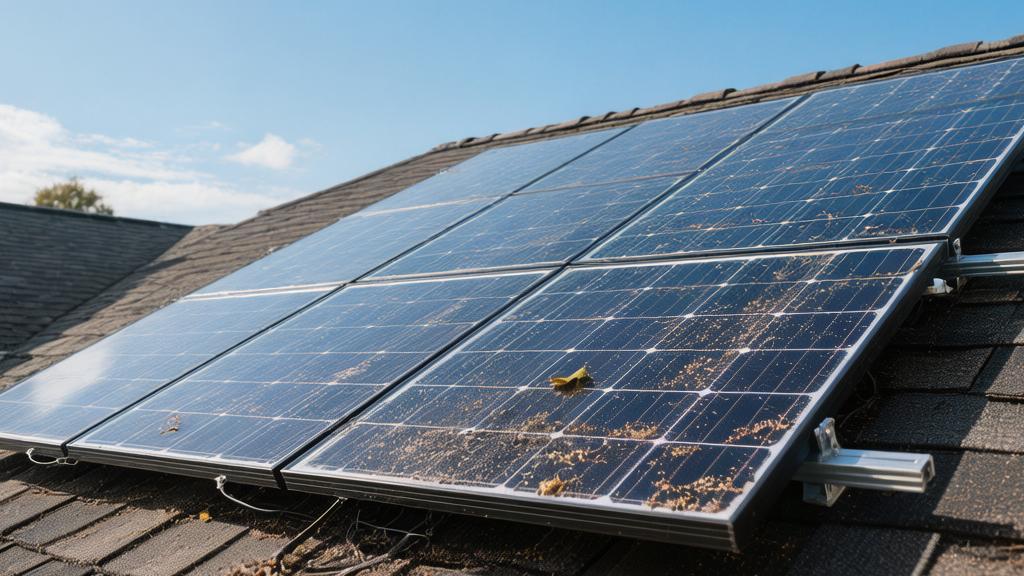
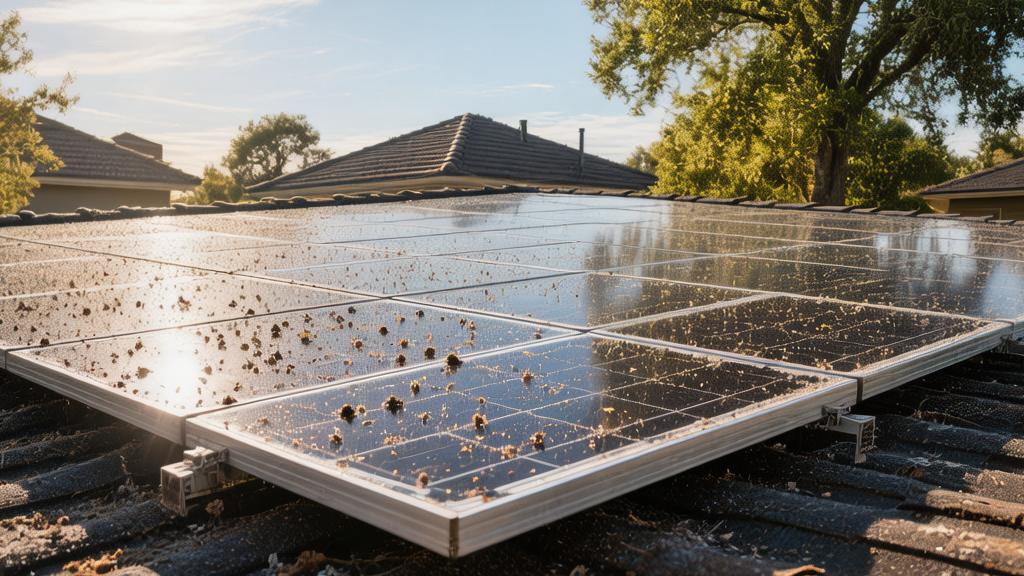
Dirt and Debris
For solar panels installed on roofs or ground mounts, the 3.2 mm thick tempered glass layer on the surface is the first barrier protecting the internal silicon cells, but it is also a medium that is extremely susceptible to contamination by natural environmental attachments.
When suspended particulate matter in the air, with diameters between 2.5 and 10 microns, settles on the glass surface with the breeze, it fills the microscopic pores of the glass surface.
Suppose your panel installation tilt is lower than 15 degrees, lacking gravity assistance and the kinetic energy of natural rain rinsing; 60 consecutive rainless days will lead to an accumulation of approximately 3 g to 5 g of dust per square meter of glass surface.
This seemingly insignificant dust film creates a diffuse reflection phenomenon, blocking the solar spectrum in the 300 nm to 1100 nm wavelength range that should have penetrated the glass, causing the overall transmittance of the glass to plummet from its factory value of 95% to around 82%.
Reflected in electrical parameters, a 400W panel with a rated short-circuit current of 10.5A will see its working current shrink to 8.9A due to the drop in transmittance, and the daily average power generation per panel will fall from 1.6 kWh to 1.35 kWh.
If there are dirt roads nearby with heavy truck traffic or construction sites with periods of 3 to 6 months, the dust deposition rate will increase by 300%, and the proportion of power loss will continue to climb at a slope of 4% to 5% per month.
Bird Droppings and Branches
Modern solar panels are typically composed of 60 or 72 monocrystalline or polycrystalline silicon cells measuring 156 mm x 156 mm, soldered in series.
When a thick bird dropping with an area of only 10 square centimeters or a pile of oak leaves dropped in autumn covers any one of these cells, that cell instantly transforms from a power generation unit into a power consumption load.
Due to the physical characteristics of series circuits, the original 9.5A working current in the entire loop will be forced to the minimum current threshold allowed by the shaded cell (which might only be 3A).
To prevent the shaded cell from burning out due to excessive reverse voltage, the bypass diodes connected in parallel in the panel's junction box will be forced to conduct.
Once a diode conducts, it directly cuts off the output of the entire one-third series string containing that cell, causing the working voltage of the entire panel to drop from a normal 33V to 22V, and approximately 130W of output power for that single panel evaporates instantly.
Furthermore, the area shaded by bird droppings will trigger a local hot spot effect. Under a light intensity of 1,000 W/m² at noon, the surface temperature of that area can soar from a normal 45°C to 85°C or even 105°C within 15 minutes. Sustained high temperatures will accelerate the aging and yellowing of the backsheet EVA encapsulation material, shortening the physical life of the cell by 3 to 5 years.
Pollen Adhesion
During the spring period from April to May, large amounts of pollen released by plants form high concentrations of floating matter in the air, with microscopic structures often featuring barbs or sticky lipids.
When a pale yellow pollen layer only 0.5 mm thick adheres uniformly to the panel surface, due to the biological pigment characteristics of the pollen itself, it specifically absorbs visible light with wavelengths between 400 nm and 700 nm, which is precisely the spectral band where crystalline silicon cells have the highest photoelectric conversion efficiency.
Test data shows that pollen coverage leads to an 18% to 22% drop in photon absorption for the system in this specific band.
Unlike ordinary dust, the lipids contained in pollen are insoluble in ordinary cold water. An average rain shower of 10 mm to 15 mm not only fails to wash it clean but instead causes the pollen to absorb water and swell, forming patches with stronger adhesion after evaporation, resulting in an extremely uneven distribution of transmittance deviations across different areas of the panel.
Cleaning Costs
If the TDS (Total Dissolved Solids) value of the tap water in your area exceeds 150 ppm, the calcium and magnesium ions rich in the water will crystallize on the panel glass after the water evaporates, forming white calcium carbonate scale spots about 0.1 mm thick. This scale has a refractive index of over 1.5 for light, triggering a secondary shading effect.
Therefore, professional cleaning operations must use RO reverse osmosis pure water or deionized water with a TDS below 10 ppm.
In terms of budget, hiring a professional cleaning team equipped with high-pressure pure water poles and soft nylon brushes typically requires a service fee of 150 USD to 250 USD.
Taking a 5 kW system as an example, if 4 kWh of electricity is lost daily due to dirt, calculated at 0.15 USD per kWh, the daily economic loss is 0.6 USD, and the monthly loss is 18 USD.
This means a single 200 USD cleaning fee requires approximately 11 months of power generation recovery to reach the break-even point.
In addition, during the wiping process, it is strictly forbidden to use cleaning sponges containing abrasive particles or scrapers with a hardness exceeding Mohs 5. These will leave permanent physical scratches 2 to 5 microns deep on the anti-reflective (AR) coating, which is only 100 nm to 150 nm thick. This not only fails to restore transmittance but instead permanently increases the probability of diffuse reflection by 3% to 5%.
According to statistical models of rainfall probability distribution and dust accumulation rates, setting the cleaning frequency to once every 8 to 12 months is the quantitative standard for maximizing the difference between maintenance costs and power generation revenue.
Shading and Weather
Photovoltaic systems with traditional series-connected configurations are extremely sensitive to local shading. A DC branch loop connected to 12 panels of 380W usually maintains a total input voltage in the 400V to 480V range.
When an oak tree 8 meters away from the house grows at a rate of 0.4 to 0.6 meters per year, its extending canopy casts a shadow with a cross-sectional area of approximately 0.5 square meters on two panels at the edge of the array between 3:30 PM and 5:00 PM, triggering the "barrel effect" of the series circuit.
In the absence of photon excitation, the impedance of the P-N junction inside the crystalline silicon will instantly climb from less than 0.1 ohms to dozens of ohms, forcing the original 8.5A rated current flowing through the loop down to 1.2A or even lower.
To keep the loop from being completely cut off, the three bypass diodes configured inside the panel will be forced to activate and short-circuit the shaded one-third of the cell string, resulting in the output voltage of a single panel being directly reduced by 10V to 12V.
According to long-term degradation model data collected by the National Renewable Energy Laboratory (NREL) at outdoor test sites, if a standard residential PV array is shaded daily by hard shadows (such as a physical chimney or a neighbor's new two-story house) covering only 2% of the total array, the total annual power generation of the system will evaporate by 11% to 15% without Module-Level Power Electronics (MLPE) intervention. By installing micro-inverters or DC power optimizers priced between 60 USD and 85 USD per unit, the MPPT (Maximum Power Point Tracking) of each panel can be made independent, controlling the power variance caused by uneven shading within a 3% error range.
High Temperatures
The rated power (e.g., 400W) on all photovoltaic panel nameplates is determined based on Standard Test Conditions (STC), where the ambient temperature is strictly controlled at 25°C.
Crystalline silicon materials have negative temperature coefficient characteristics, typically calibrated at -0.35%/°C. This means that for every 1°C the panel surface temperature exceeds the 25°C standard, its maximum output power will linearly degrade by 0.35%.
During the dog days of July, when the outdoor ambient air temperature reaches 35°C, panels laid on dark asphalt shingle roofs—lacking an air circulation convection layer of more than 15 cm at the back—will see their aluminum frames and glass surfaces easily break through an actual measured temperature of 65°C.
At this time, the working temperature of the panel exceeds the STC standard by a full 40°C.
Multiplying 40°C by the negative temperature coefficient of 0.35% results in a power reduction rate of 14%.
A panel rated at 400W, at the moment of most abundant sunlight at 12:00 PM in summer, will have its actual output peak power suppressed to around 344W by thermal energy loss, with the loss of power generation revenue reaching 0.05 kWh per hour for a single panel.
Cloud Cover
On a clear, cloudless day, the solar radiation intensity received at sea level can reach the standard baseline of 1,000 W/m².
When cumulonimbus or altostratus clouds with a thickness exceeding 3,000 meters cover the sky, water droplets and ice crystals in the clouds will reflect or absorb over 70% to 85% of the direct photons through Rayleigh and Mie scattering physical processes.
At this time, the irradiance received by ground-based PV detectors will drop off a cliff to the range of 150 W/m² to 250 W/m².
The DC input power recorded at the inverter end will instantly plummet from a full load of 5,000W to a low of 750W to 1,250W.
If the local area experiences a continuous 4 to 5 day rainy weather system passing through, the system's average daily power generation during this cycle is usually only 15% to 20% of the normal level on a sunny day, and the monthly expected revenue in the overall ROI model will face a book shrinkage of over 30%.
Unmelted Snow
When the panel surface is covered with dry powder snow over 5 cm thick, or wet snow with extremely high water content only 2 cm thick, the blockage rate of the visible light band will reach 100%, and the system's instantaneous power generation during the day will drop to zero.
If the installation tilt angle of the rooftop array is below 30 degrees, the static friction coefficient between the snow layer and the panel glass surface increases. Additionally, night temperatures dropping below -5°C cause the bottom edge of the snow layer to freeze, meaning gravity will be unable to prompt the natural sliding displacement of the snow.
A 30 square meter rooftop PV array, after sustaining 15 cm of snowfall, faces not only zero power output for several days or even a week but also an additional physical static load totaling 450 kg to 600 kg.
The time for the system to resume power generation depends entirely on the natural cycle of temperatures rising above 3°C to melt the snow layer, or wind speeds reaching over 8 m/s to generate enough wind shear force to disperse the snow surface.
Extreme Heat
The Hotter the Less Electricity
Many households with rooftop PV arrays instinctively assume that the peak of summer in July and August, when the sun is most dazzling, should be the peak months for the entire system's AC output.
In the semiconductor physics of crystalline silicon, the material's reaction to thermal energy is the opposite of human intuition: they need pure photons, not the accompanying infrared heat.
The peak power (e.g., 420 W) marked on the nameplate of all solar panels from regular manufacturers is measured in a laboratory under Standard Test Conditions (STC), where the physical temperature of the cells inside the module is strictly controlled at 25°C.
When the weather bureau reports an ambient temperature of 38°C, the surface temperature of a roof covered with dark asphalt shingles will absorb a large amount of short-wave radiation, rapidly climbing to a range of 55°C to 60°C.
At this time, the 160-micron-thick silicon wafer inside the panel, under strong noon sunlight of 1,000 W/m², will see its true working temperature easily break 65°C and even approach the extreme value of 70°C.
Current mainstream monocrystalline silicon panels have power temperature coefficients varying between approximately -0.34%/°C and -0.38%/°C.
When the panel temperature reaches 65°C, it exceeds the 25°C standard test value by exactly 40°C.
Multiplying this excess 40°C by the fixed rate of -0.35% results in a power reduction rate as high as 14%.
This means that a panel originally rated at 420W will have its actual DC peak output forced down to about 361W by the heat load, with a single panel losing nearly 60W of capacity instantly.
Looking at the curve of electrical parameters, high temperature primarily causes the open-circuit voltage (Voc) of the module to drop off a cliff by 0.28% per degree Celsius, while the short-circuit current (Isc) only produces a tiny increase of 0.04% per degree Celsius; the slight increase in current is completely unable to compensate for the total power loss caused by the plummeting voltage.
Ambient Air Temp (℃) | Roof Surface Temp (℃) | Actual Panel Temp (℃) | Rated Power (W) | Temp Coefficient Loss Rate | Actual Output Power (W) | Power Deviation (W) |
20 | 25 | 25 | 420 | 0.00% | 420.0 | 0.0 |
28 | 38 | 45 | 420 | -7.00% | 390.6 | -29.4 |
35 | 50 | 58 | 420 | -11.55% | 371.4 | -48.6 |
38 | 60 | 68 | 420 | -15.05% | 356.7 | -63.3 |
42 | 68 | 75 | 420 | -17.50% | 346.5 | -73.5 |
Back Must Be Ventilated
During the installation design phase, the physical gap size reserved by the aluminum bracket system between the back of the panel and the roof surface determines the efficiency of passive heat dissipation.
If the gap is compressed to within 5 cm for the sake of visual flatness and aesthetics, the Bernoulli effect cannot effectively form in this narrow passage even if the wind speed reaches 3 meters per second due to air resistance.
Hot air will stagnate behind the module, forming a "dead water zone" with temperatures as high as 60°C or more.
By increasing the installation height of the brackets to maintain a standard gap of 15 cm to 20 cm between the panel back and the roof, the volume and rate of airflow will rise exponentially.
When the external wind speed is maintained at 2.5 meters per second, this wide channel can replace approximately 4.5 cubic meters of high-temperature air per minute.
Data recorded by testing instruments shows that a good back ventilation environment can lower the panel's working temperature by 8°C to 12°C.
Calculating by the previous temperature coefficient model, this 8°C drop can reclaim about 2.8% of power generation efficiency for a single panel. For a system with an installed capacity of 6,000 W, during the high-temperature period from 1:00 PM to 3:00 PM, it can recover approximately 0.16 kWh of AC electricity revenue per hour.
Parts Age Fast
The EVA (ethylene-vinyl acetate copolymer) film used inside the panel to encapsulate fragile silicon wafers will undergo irreversible cross-linking degradation reactions after long-term exposure to high-temperature baking above 75°C and high-intensity UV radiation.
Normally transparent EVA material will gradually turn yellowish-brown, causing the glass layer's transmittance for the 300 nm to 1100 nm spectrum to permanently slip from 95% to below 88%.
The expansion at 68°C during the day and contraction at 15°C in the early morning generates a severe temperature variance of 53°C.
Sustained pulling over 3 to 5 years easily leads to microscopic fractures in the silver paste busbars, which are only 0.2 mm thick, increasing the internal contact resistance from 0.02 ohms to 0.5 ohms.
This not only further consumes current to produce more waste heat but also lowers the overall life expectancy of the system for its 25-year span.
For string inverters installed on garage exterior walls or sides, the internal IGBT (Insulated Gate Bipolar Transistor) will automatically start a Derating mechanism when the ambient temperature exceeds 45°C to protect electronic modules from burning out, forcibly cutting the output load limit by 10% to 20%. This is another layer of power loss that cannot be ignored.