Early bypass activation usually needs three things to happen at the same time: one cell group is receiving much less effective irradiance than the cells around it, those weak cells sit in the same electrical path, and the module is carrying enough current to push them into reverse bias. If only the rear light is a little uneven, the usual result is mismatch loss rather than bypass activation.
NREL modeling gives a useful sense of scale. In an unusually close rooftop setup with only 0.15 m clearance, annual mismatch loss reached about 1.5%. In the higher-clearance rooftop and tracking cases from the same study, the loss stayed below about 0.5%.[1]
So a rear-side difference of 20%, 30%, or even 50% is not enough to tell you whether a bypass diode will turn on. The more useful question is simple: can the weakest cell still produce enough current for what is already flowing through that series path?
The Three Conditions That Matter
| Condition | What to Check | Why It Matters |
|---|---|---|
| Deep local irradiance loss | Rear irradiance at the weakest cells | Reduces their available photocurrent |
| Shadow concentrated in one electrical path | Cell layout and bypass-diode grouping | Prevents the mismatch from being spread across the module |
| High enough series current | Actual module/string operating current | Can push the weak cells into reverse bias |
A deep shadow on its own may only reduce power. The situation becomes more serious when that shadow lands on cells that share the same electrical path and the string is still asking those cells to carry relatively high current.
The electrical process is:
low local irradiance → low photocurrent → cell voltage falls → reverse bias → section voltage falls → bypass diode conducts
Rear-Irradiance Numbers That Matter
Rear irradiance should never be read on its own. A bifacial cell is also receiving light from the front, so two areas with very different rear readings can still be much closer electrically than the rear numbers suggest.
A simple way to compare them is:
Equivalent irradiance ≈ front irradiance + rear irradiance × current bifaciality
This is useful for comparing cells or parts of the same module. It is not a bypass threshold. IEC guidance for bifacial I-V measurement also treats front/rear contribution and irradiance nonuniformity as separate parts of the measurement.[2]
Using an illustrative current bifaciality of 0.75:
| Front | Rear Bright | Rear Dark | Equivalent Bright | Equivalent Dark | Difference |
|---|---|---|---|---|---|
| 1,000 W/m² | 200 W/m² | 100 W/m² | 1,150 W/m² | 1,075 W/m² | 6.5% |
| 900 W/m² | 200 W/m² | 100 W/m² | 1,050 W/m² | 975 W/m² | 7.1% |
| 400 W/m² | 250 W/m² | 50 W/m² | 587.5 W/m² | 437.5 W/m² | 25.5% |
| 350 W/m² | 280 W/m² | 30 W/m² | 560 W/m² | 372.5 W/m² | 33.5% |
These are calculation examples, not bypass limits.
The first two rows are a good example of why the rear-side percentage can be misleading. Rear irradiance is cut by 50%, but strong front-side light keeps the equivalent irradiance difference to only about 6.5%-7.1%.
The last row is a much tougher condition. Rear irradiance falls from 280 to 30 W/m², an 89.3% rear-side reduction, while the equivalent irradiance difference is about 33.5%.
Reverse Bias Can Start Before Bypass
One point often gets missed in field checks: a cell can already be in reverse bias while the bypass diode is still off.
A bypass diode normally protects a group of cells rather than one single cell. Suppose the healthy cells in one protected section together produce +10 V, while one badly shaded cell has dropped to -3 V.
The section still produces:
+10 V - 3 V = +7 V
That weak cell is already under reverse stress, but the section as a whole is still positive.
If the mismatch gets worse:
+7 V → +3 V → 0 V → negative section voltage
Substantial bypass current starts only when the protected section reaches the diode's forward-conduction condition.
| Electrical State | Cell Condition | Bypass Diode |
|---|---|---|
| Mild mismatch | Lower forward voltage | Off |
| Strong mismatch | One or more cells may be reverse biased | May still be off |
| Section voltage collapses | Severe mismatch | Conducting |
For maintenance teams, this matters because a hotspot can start before the I-V curve shows a clean, obvious bypass step.
Shadow Depth and Position
Two shadows can cover roughly the same area and still create very different electrical problems. The depth of the shadow and the cells underneath it matter more than the visual size alone.
| Rear Pattern | Weakest Point | Local Reduction |
|---|---|---|
| 180 → 165 → 150 W/m² | 150 W/m² | 16.7% |
| 180 → 180 → 20 W/m² | 20 W/m² | 88.9% |
In the second case, one small part of the module has lost almost 89% of its rear irradiance. That is a very different situation from a gentle reduction spread across a larger area.
Position also changes the outcome. Six shaded cells sitting in one series path can create a stronger bottleneck than the same shaded area spread across three different paths.
Typical causes of these deep local shadows include:
- torque tubes;
- tracker bearings;
- mounting rails;
- clamps;
- cable bundles;
- roof supports;
- mud or bird contamination;
- debris trapped behind the module;
- opaque labels over active cell areas.
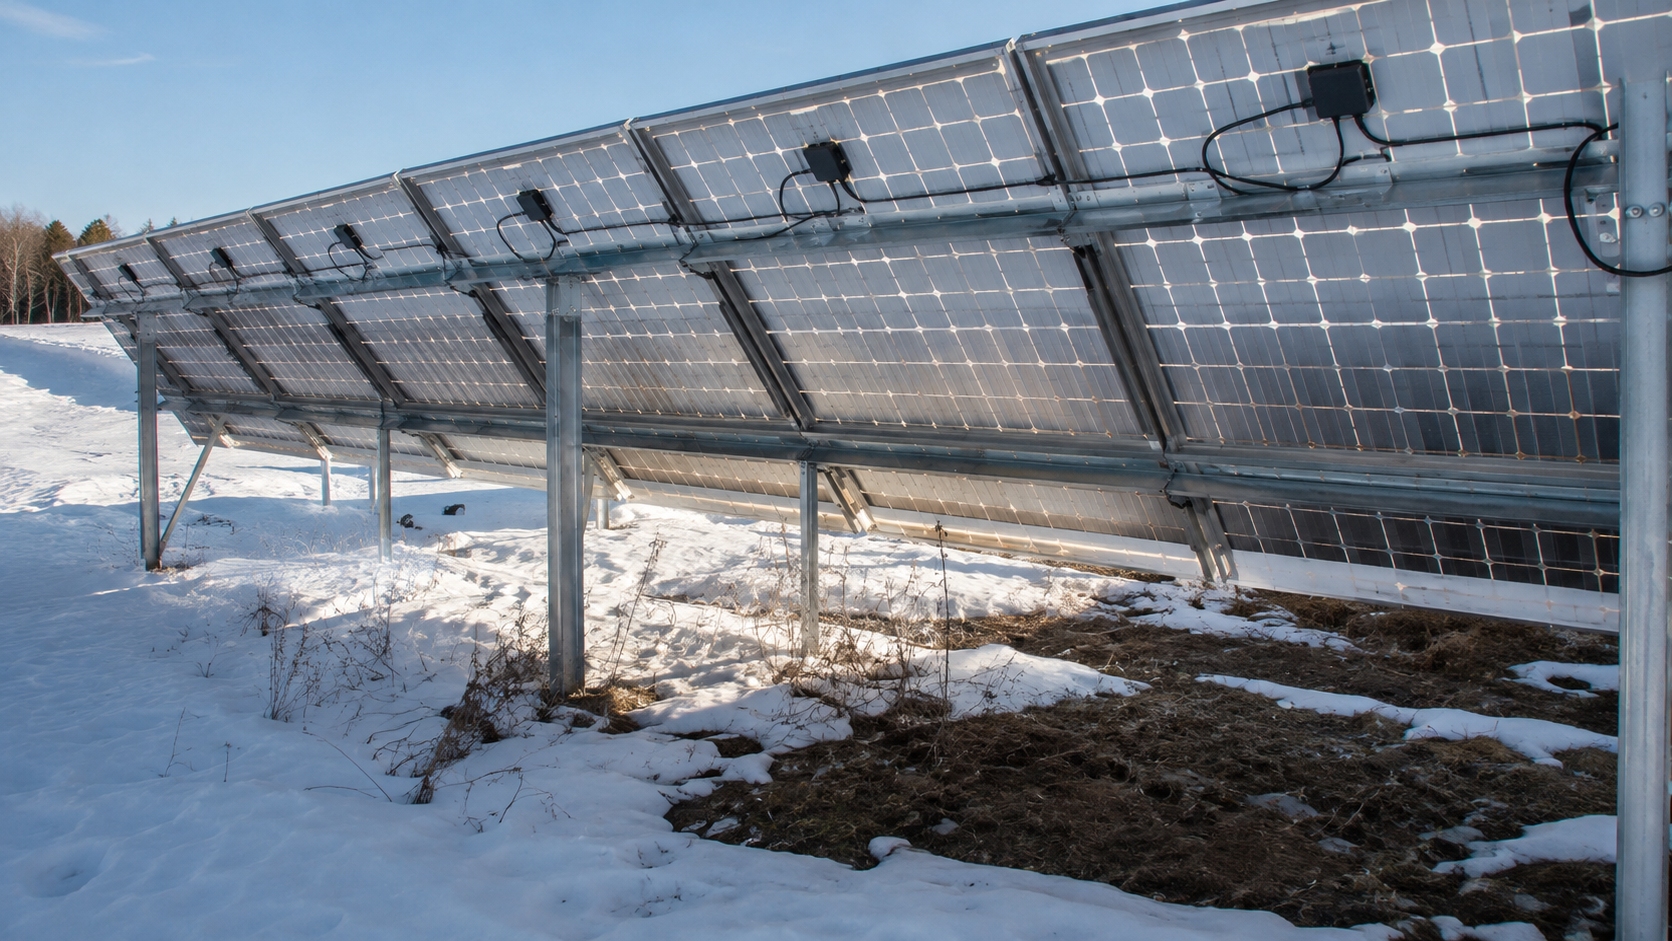
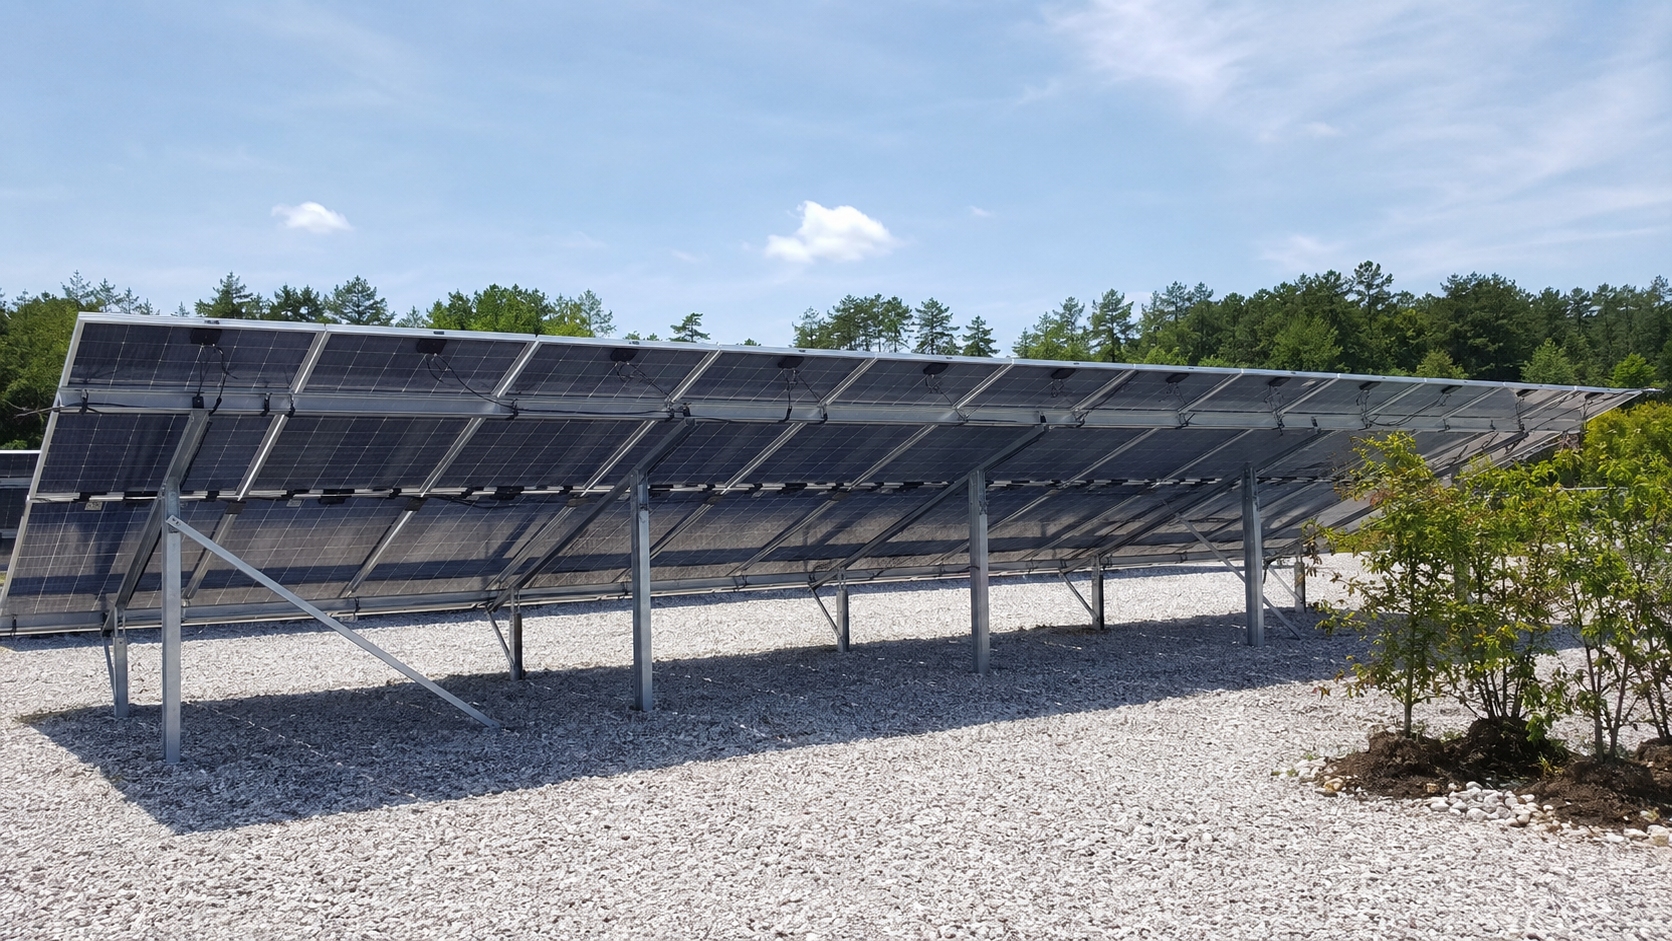
For the same reason, rail location, cable routing, and module clearance all matter when trying to reduce rear-side loss in bifacial modules.
Half-Cut Wiring Changes the Result
With a 144-half-cell module, the shaded rectangle you can see from the outside does not tell the whole story. Internal parallel branches and bypass-diode groups decide how the mismatch is shared.
| Shading Pattern | Likely Result |
|---|---|
| Small shadow mainly on one parallel branch | The second branch can still contribute current |
| Both parallel paths in one protected section are heavily affected | That section loses much more current capability |
| Shadow crosses several protected sections | Loss is spread across several electrical paths |
If only one branch is hit, another branch may still carry part of the load. If both paths inside the same protected section are heavily shaded, that section becomes much weaker and bypass activation becomes more likely.
For a real project, the better approach is to check the cell layout, operating current, junction-box design, and bypass-diode grouping. These details vary across current high-efficiency module designs, so cell count alone is not enough.
Operating Current Decides the Severity
A rear shadow is not equally serious at every operating point. The deciding factor is how the actual series current compares with the current the weakest cell can still generate.
Take an illustrative weak-cell region producing about 7 A of available photocurrent under its present illumination:
| Series Current | Likely Behavior |
|---|---|
| 5.5 A | The weak cell may remain forward biased |
| 6.8-7.0 A | Cell voltage can fall sharply |
| Above the available photocurrent | Reverse bias becomes possible |
The 7 A figure is only an example. The real value depends on the cell type, irradiance, temperature, module design, and operating point.
That is why the same shadow may cause only a small power penalty in one condition and a much stronger I-V step in another.
Albedo and Clearance Change the Rear Pattern
A bright surface can raise rear-side output, but the gain will not be even if a rail, tube, or other structure blocks part of the reflected light.
| Example | Open Rear Area | Shadowed Area | Absolute Difference |
|---|---|---|---|
| Lower rear contribution | 80 W/m² | 40 W/m² | 40 W/m² |
| Higher rear contribution | 300 W/m² | 60 W/m² | 240 W/m² |
The second example has six times the absolute rear irradiance difference. That can create a much larger current mismatch if the shaded cells cannot pick up reflected or diffuse light from another direction.
Sandia's bifacial models treat rear irradiance as a spatial value because albedo, module height, sun position, tilt, row spacing, and nearby structures all change the rear pattern.[3]
Clearance can make the same issue more obvious. Take this illustrative measurement:
| Rear Position | Irradiance |
|---|---|
| Open area | 230 W/m² |
| Near rail | 150 W/m² |
| Behind rail | 35 W/m² |
| Open area | 220 W/m² |
The point behind the rail receives about 84.8% less rear irradiance than the 230 W/m² open area.
NREL's very close 0.15 m rooftop configuration reached about 1.5% annual mismatch loss. The higher-clearance rooftop and tracking cases in the same study stayed below about 0.5%.[1]
Those figures are useful for judging rear-side nonuniformity, but they are not a distance threshold for bypass activation. On ground projects, clearance, row spacing, and albedo still need to be looked at together when planning ground-mounted N-type bifacial modules.
Tracker Angle Can Expose the Cause
Repeating faults are useful clues. If a voltage step or hotspot keeps showing up at roughly the same tracker angle, geometry is a stronger suspect than a random diode problem.
For example, if the same I-V step appears between approximately +5° and +15° tracker angle and disappears outside that range, check:
- torque-tube alignment;
- bearing position;
- clamp position;
- module-to-tube distance;
- cable position;
- cell orientation;
- bypass-diode grouping.
The +5° to +15° range is only an example; every tracker has different geometry.
If the problem is less obvious on cloudy days, do not assume it is gone. Diffuse light can soften a hard shadow, while lower irradiance can also reduce the current being forced through the weak cells.
I-V Curve Evidence
| I-V / P-V Pattern | Most Useful Interpretation |
|---|---|
| Smooth curve with slightly reduced current | Normal mismatch is more likely |
| Distorted current region | One cell group may be limiting current |
| Clear voltage step | Bypass-diode conduction becomes more likely |
| Several P-V peaks | Several possible bypass operating states |
IEA PVPS field guidance notes that partial shading can create steps in a string I-V curve when bypass diodes carry current. It also recommends repeating the measurement when the shading is absent.[4]
One shortcut is worth avoiding: a module with three bypass diodes does not automatically lose exactly 33.3% of its measured voltage when one diode conducts.
The real voltage change depends on:
- number of cells in the affected section;
- half-cell parallel connections;
- cell voltage at the actual operating current;
- module temperature;
- diode forward voltage;
- the manufacturer's internal circuit.
One Rear Sensor Can Miss an 86% Deficit
A central rear sensor can look perfectly normal while a rail shadow only a short distance away is much darker.
| Position | Rear Irradiance |
|---|---|
| Upper area | 190 W/m² |
| Center sensor | 185 W/m² |
| Lower area | 175 W/m² |
| Rail shadow | 25 W/m² |
In this example, the rail-shadow value is about 86.5% lower than the center sensor reading.
That is why one monitoring sensor can be good enough for general rear-yield tracking but still miss the cell-level shadow that is causing an electrical fault. For bypass investigation, several rear measurements or a spatial rear-irradiance model are more useful. Sandia's bifacial modeling work resolves rear irradiance at multiple positions for exactly this reason.[3]
Hotspot Data Need Electrical Context
When a cell is in reverse bias, it can absorb electrical power instead of delivering it.
For example, a cell carrying 8 A at -5 V is dissipating about:
5 V × 8 A = 40 W
This is an illustrative fault calculation, not a normal operating condition. Tens of watts concentrated in one cell area can create strong local heating.
Thermal images also need to be read carefully:
| Thermal Pattern | Possible Cause |
|---|---|
| One strongly hot cell | Reverse bias or cell defect |
| Warm junction-box diode area | Bypass current |
| Hot connector | High contact resistance |
| Whole module slightly warmer | Airflow or operating-temperature difference |
IEC 61215-2 treats hot-spot endurance and bypass-diode thermal behavior as separate tests.[5] NREL research has also shown that conventional bypass diodes do not remove every cell-level hotspot condition caused by reverse bias.[6]
A fixed number such as 70°C or 80°C should not be used as proof of bypass activation. Ambient temperature, wind, irradiance, current, emissivity, and camera angle all change the surface temperature seen by an infrared camera.
A 33.5% Equivalent-Irradiance Deficit Example
Take an illustrative rooftop module with:
- front irradiance: 350 W/m²;
- rear irradiance over exposed cells: 280 W/m²;
- rear irradiance behind a rail: 30 W/m²;
- current bifaciality: 0.75.
The exposed region receives approximately:
350 + 280 × 0.75 = 560 W/m²
The rail-shadow region receives:
350 + 30 × 0.75 = 372.5 W/m²
The difference is 187.5 W/m², or about 33.5% relative to the exposed region.
Rear irradiance by itself fell about 89.3%, but the total equivalent irradiance fell by 33.5% because the front side is still supplying a large part of the available light.
| Electrical Condition | Result |
|---|---|
| String current remains below the weak-cell capability | Mismatch loss, no bypass required |
| String current pushes the weak cells into reverse bias | Hotspot risk increases |
| Protected-section voltage falls into diode conduction | Bypass current flows |
No Rear-Shading Percentage Is a Bypass Threshold
These shortcuts are not reliable:
- 20% rear mismatch activates bypass;
- 30% rear mismatch is safe;
- 50% rear mismatch always turns on the diode.
The numbers in the earlier examples show the problem. A 50% rear irradiance difference can become only a 6.5%-7.1% equivalent irradiance difference when front irradiance is strong. In another setup, a deep local rear shadow can create a 25%-35% effective deficit in one important electrical path.
The comparison that matters is:
weak-cell photocurrent capability versus actual series operating current
Design Changes That Reduce the Risk
| Problem | Useful Design Change |
|---|---|
| Rail creates a narrow dark band | Increase rail-to-module distance or change rail position |
| Cable covers one rear cell area | Reroute and secure the cable away from active cells |
| Low clearance creates strong rear gradients | Increase module clearance where structure allows |
| Tracker tube repeatedly shades one cell path | Review tube position, module orientation, and cell layout |
| High-albedo surface creates strong bright/dark contrast | Model the rear irradiance distribution, not only average gain |
These are practical layout choices rather than theoretical fixes. On a real project, module electrical layout needs to be checked together with the intended module application scenario. For larger systems, site geometry should also be part of the decision when selecting modules for commercial PV systems.
Field Check
Rear irradiance: measure several positions around the suspected shadow. One center reading is not enough.
Cell location: identify which cells sit behind rails, torque tubes, cables, clamps, dirt, or other obstructions.
Electrical layout: check whether those cells share the same series branch and bypass diode.
Operating current: record string current and voltage while the problem is present.
I-V curve: check for current limitation, voltage steps, and extra P-V peaks.
Repeat measurement: run the test again after the shadow moves or is safely removed. If the step disappears with the shadow, the case for a shading-related fault becomes much stronger.[4]
Thermal image: compare the electrical change with any hot cell or warm diode area.
If the abnormal voltage remains after rear illumination becomes uniform, move the investigation away from shading and check for a shorted or damaged bypass diode, cracked cells, broken interconnections, connector resistance, or permanent module damage.
Live DC measurements and junction-box work can involve dangerous voltage and current. Exposed-conductor testing, string isolation, and junction-box inspection should be performed only by qualified personnel using the correct electrical safety procedures.
Finally
For most bifacial systems, uneven rear irradiance shows up first as mismatch, not bypass activation. NREL's close 0.15 m rooftop case reached about 1.5% annual mismatch loss, while the higher-clearance and tracking cases stayed below about 0.5%.
The examples also show why rear percentages alone are not enough: a 50% rear difference became only a 7.1% effective difference under strong front light, while a deep rail shadow created a 33.5% effective deficit. In practice, the useful evidence is the combination of rear irradiance, cell position, module wiring, series current, I-V behavior, and thermal data.