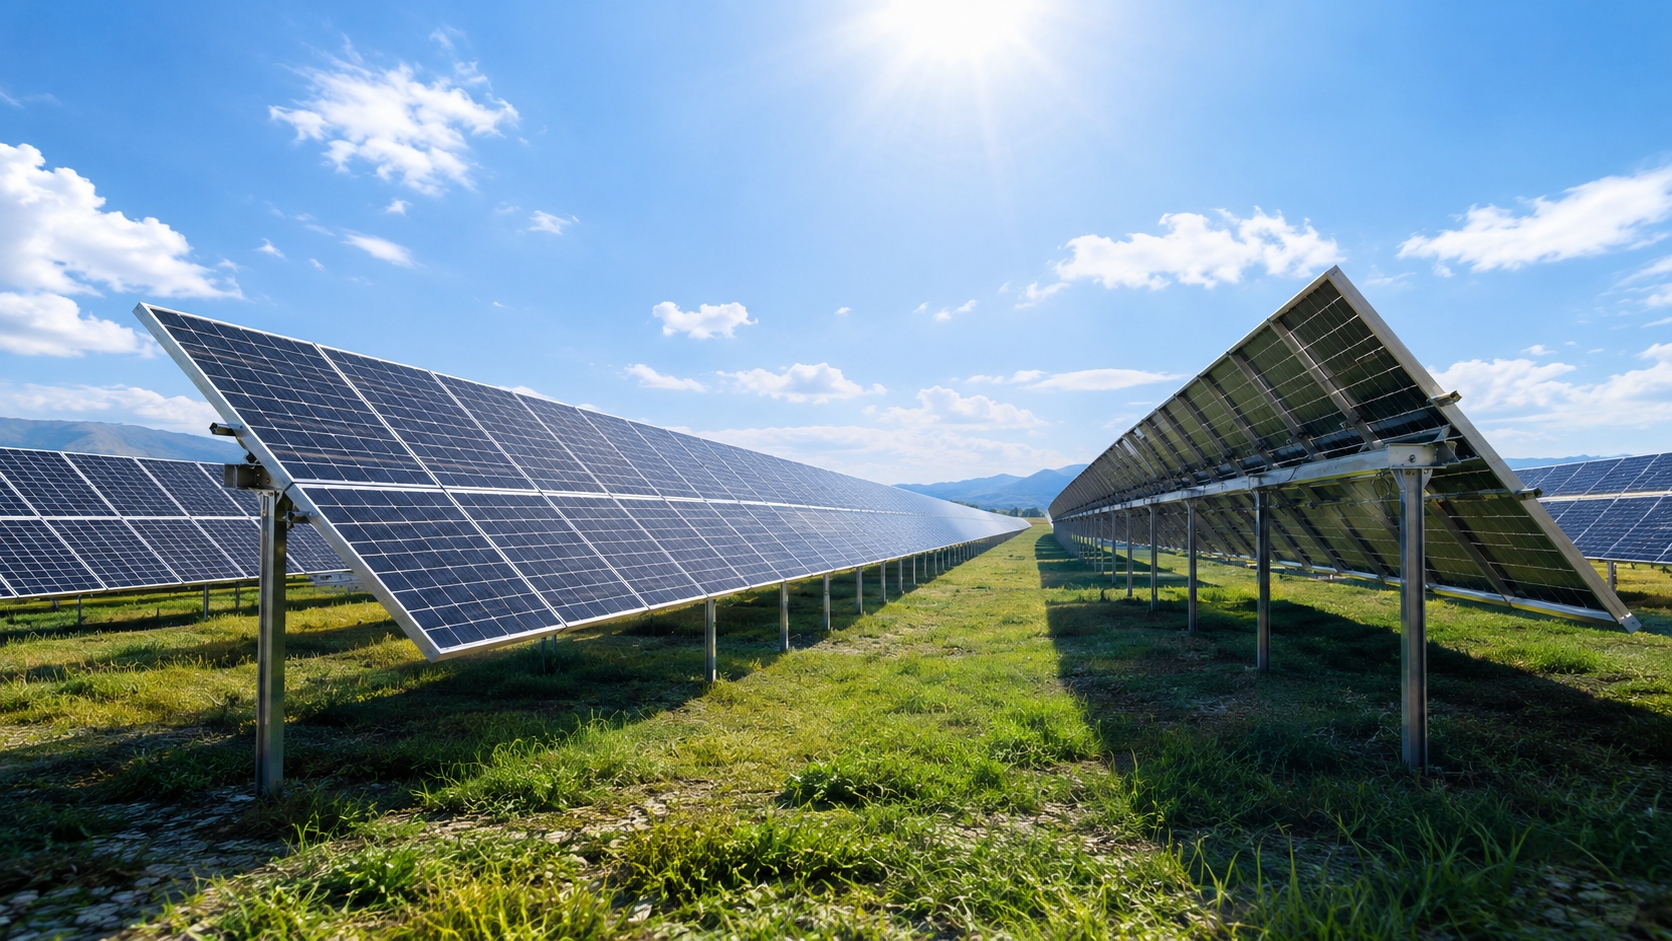
Ground Mount N-Type Bifacial Modules | Tilt Angle, Spacing, Rear-Side Gain
For ground-mounted N-type bifacial modules, set tilt at 20–30° and maintain row spacing at 2.5–3.5 times module height to reduce rear shading. Use high-albedo surfaces such as white gravel or concrete, targeting 0.25–0.50 reflectivity. Proper layout can increase rear-side gain by 8–15%, improving total system yield.
Tilt Angle
Optimal Angle Range
The tilt angle β is the first adjustable design parameter for ground-mounted N-type bifacial modules, directly determining the proportion of the annual total irradiance received by the modules. The latitude-tilt comparison is an industry-standard practice: low latitudes use the latitude value, mid-latitudes use the latitude value, and high latitudes use the latitude value plus 5° to 10°. The reason for this is that in high-latitude regions, the difference in solar elevation angles between winter and summer is significant, and moderately increasing the tilt angle can enhance the capture of low-angle irradiance during winter.
The latitude-based value assignment is as follows: 0°-10° uses 5°-10° (Sanya, Hainan, with a 5° tilt has been proven suitable through actual measurements), 25°-40° uses the latitude value (applicable to most projects in China), 40°-50° uses the latitude value plus 5° (Northeast and northern North China), and above 50° uses the latitude value plus 8°-10° (Northern Europe, northern Canada).
I participated in the preliminary design review of a 20MW project in Ordos, where the initial design of a 38° tilt angle resulted in the rear row of modules being shaded by approximately 15% by the front row before 10 a.m. on the winter solstice. This led to an annual power generation that was 2.1% lower than the PVsyst simulation. After switching to a 33° tilt, the shadow coverage on the winter solstice was reduced to 4%, and the annual power generation was actually 2.3% higher than the initial design. This experience taught me to first assess the match between tilt angle and latitude during reviews.
Two critical thresholds: When the tilt angle deviates from the optimal value by ±5°, the annual irradiance capture decreases by 1.5%-2.5%; when it deviates by ±10°, the decrease is 4%-6%. When the tilt angle is increased from 30° to 45°, the backside receives more sky diffuse irradiance, and the backside gain increases from 10% to 13%-15%. At a 48° tilt angle in a mountainous power station in Zhangjiakou, the measured backside gain was 14.2%, higher than the design value of 11%.
The steps for determining the fixed tilt angle are: first, determine the latitude φ → look up the table for the tilt angle range → simulate with PVsyst → conduct the first-year on-site measurement verification → make necessary ±3° fine adjustments. For adjustable mounts, adjusting 2-3 times a year according to the season can increase annual power generation by 3.5%-5.2%, but this requires additional inspection and adjustment expenses.
Recommended values for latitude-tilt:
l 0°-10°: 5°-10°
l 10°-25°: latitude value
l 25°-40°: latitude value
l 40°-50°: latitude +5°
l Above 50°: latitude +8°-10°
Solar Path Matching
Solar path matching is the physical basis for tilt angle design, linking the three parameters of latitude, declination, and hour angle through the solar elevation angle formula. The winter and summer solstices are the two key days for design; the winter solstice has the lowest solar noon elevation angle, and the summer solstice has the highest. The irradiance difference on these two days determines the annual power generation distribution.
The solar noon elevation angles on the winter solstice for major cities in China are as follows: approximately 46.5° at 20° N (Haikou), approximately 41.5° at 25° N (Guangzhou), approximately 36.5° at 30° N (Hangzhou), approximately 31.5° at 35° N (Jinan), approximately 26.5° at 40° N (Beijing), approximately 21.5° at 45° N (Harbin), and approximately 16.5° at 50° N (Mohe). For areas above 3000m in altitude, add 2°-3° to the recommended value.
I was involved in a 3.2MW agricultural-photovoltaic project in Yancheng, Jiangsu, where the latitude is 33.4°. The initial design with a 33° tilt angle was found during on-site measurement to have the rear row of modules appearing darker between 10:00 and 14:00 on the winter solstice, with the power output at the middle of the rear row being 6.8% lower than the front row. By adjusting the tilt angle to 30° and clearing the weeds 5m in front of the modules, the winter solstice shadow coverage rate was reduced from 11.2% to 3.4%, and the annual power generation error converged from -2.1% to +0.3%.
The solar elevation angle formula is: sin h = sin φ sin δ + cos φ cos δ cos ω. Here, h is the solar elevation angle, φ is the latitude, δ is the solar declination (winter solstice -23.45°, summer solstice +23.45°), and ω is the hour angle (noon is 0, every hour ±15°). The design period is usually 09:00-15:00 (corresponding to ω=±45°), covering 70%-75% of the annual irradiance.
Three boundary conditions: When the azimuth angle deviates from true south by ±10°, the annual irradiance decreases by 1.5%-2.5%; when the eastern mountain blocks sunlight between 09:00-10:00, it will lose 5%-8% of the winter power generation; in areas with more cloudy days (such as the Sichuan Basin), the tilt angle can be appropriately reduced by 2°-3° to increase the capture of diffuse irradiance.
The solar noon altitude angle on the winter solstice: h = 90° - |φ + 23.45°|
The solar elevation angle at noon on the summer solstice: h = 90° - |φ - 23.45°|
Design period 09:00-15:00 covers 70%-75% of annual irradiation
Azimuth true south deviation ±10°, annual irradiance decreases by 1.5%-2.5%
In areas above 3000m elevation, it is recommended to increase the tilt angle by 2°-3°
Seasonal Angle Recommendations
Seasonal angle adjustment is the core value of adjustable mounts, aiming to maximize the annual irradiance capture by adjusting the tilt angle to the optimal value for each season in response to the difference in solar elevation angles between winter and summer. Fixed mounts can only take one tilt angle, while adjustable mounts can take 2-3 seasonal values, sacrificing adjustment work for annual power generation gains.
The four key nodes are: around the winter solstice (December to February of the following year), use the latitude value plus 5° to 10° to capture the low-elevation-angle sunlight in winter; around the spring and autumn equinoxes (March to May, September to November), use the latitude value minus 3° to balance the irradiance in spring and autumn; around the summer solstice (June to August), use the latitude value minus 8° to 12° to reduce the cosine loss under high-angle sunlight in summer. Adjustments are made 2-3 times per year (once each at the spring equinox, summer solstice, and winter solstice).
I participated in the selection of an adjustable mount scheme for a 30MW agricultural-photovoltaic project in Dezhou, Shandong. The fixed 35° scheme had an annual power generation of 41.2 million kWh, while the adjustable scheme (35° in winter, 30° in spring and autumn, 25° in summer) had an annual power generation of 42.95 million kWh, with a single-season gain of +7.2% in summer, but the annual gain was only 4.2% (the loss of some irradiance during the adjustment in spring and autumn offset the summer gain).
The engineering boundaries of adjustable mounts are: the structural load of the mount is 15%-25% higher than that of a fixed mount (manual adjustment) or 40%-60% higher (electric adjustment), the design life of the adjustment mechanism is 25 years to match the modules, the bolt retightening cycle is once a year, and the adjustable angle range is usually -10° to +60°. The benefits of adjustable mounts are more obvious in areas with high winter irradiance such as Northeast, Xinjiang, and Inner Mongolia.
The steps for determining the seasonal angle are: statistically analyze the irradiance data of the project site by quarter → calculate the optimal tilt angle for each quarter → evaluate the marginal benefit of the adjustment workload and gain → decide whether to use a fixed or adjustable mount. In areas where the summer irradiance exceeds 35%, the benefit of reducing the summer angle by 8°-12° is significant.
Season | Declination δ | Recommended Adjustment | Typical gain | Key Cases |
Spring (March-May) | 0° → +18.8° | Latitude value -3° | +2% - +3% | Hebei Xingtai 12MW Spring proportion 28.5% |
Summer (June-August) | +23.45° | Latitude value -8° to -12° | +5% - +7% | Shandong Dezhou 30MW 35°→25° +7.2% |
Autumn (September - November) | −18.8 degrees to 0 degrees | Latitude value -3° | +2% - +4% | Anhui Hefei 8MW Autumn +3.8% |
Winter (December-February) | −23.45 degrees | Latitude value +5° to +10° | +8% - +12% | Heilongjiang Suihua 5MW 48° Winter +11.4% |
Spacing
Row Spacing Fundamentals
Row spacing (D) is the second critical design parameter for ground-mounted PV arrays. The primary goal is to ensure that, during the period from 09:00 to 15:00 on the winter solstice, the front row of modules does not cast shadows on the back row, obstructing sunlight. If the spacing is too small, it will result in winter shadows covering the back rows; if it is too large, it will waste land and increase the engineering workload for cables and foundations.
The fundamental formula for spacing design is D = H × k. Here, H represents the vertical height difference between the tops of the front and back rows of modules (equal to the module length × sin β + ground clearance), and k is the spacing coefficient. The spacing coefficient is related to four variables: latitude, tilt angle, module length, and solar declination. In industry practice, the design period commonly used is 4 hours around solar noon on the winter solstice (corresponding to ω=±45°).
I participated in the design of a 15MW Gobi desert power plant in Hami, Xinjiang. The module length was 2.278m (182 cell bifacial glass-glass), the tilt angle was 33°, and the ground clearance was 0.5m. The calculation yielded H = 2.278 × sin33° + 0.5 = 1.74m. With a latitude of 43°, the spacing coefficient was set at 2.0, resulting in D = 3.48m. After one year of operation, the grass behind the modules grew to 0.3m, and the back-side gain was measured at 11.8%, which was lower than the designed 13.5%. By increasing the ground clearance to 0.9m, the back-side gain improved to 13.5%, achieving the design value.
The latitude-based zoning for the spacing coefficient is as follows: 0°-10° uses 0.85-1.0, 10°-25° uses 1.0-1.4, 25°-35° uses 1.6-2.0, 35°-45° uses 2.0-2.5, 45°-55° uses 2.5-3.2, and above 55° uses 3.2-4.0. The design objective is to ensure that the shadow coverage of the front row on the back row does not exceed 5% during the period from 09:00 to 15:00 on the winter solstice.
The operational steps for spacing design are: determine the latitude (φ) and tilt angle (β) → look up the table for the spacing coefficient (k) → calculate H (module length × sin β + ground clearance) → D = H × k → use PVsyst 3D model to verify the winter solstice shadow → fine-tune the coefficient by ±0.2. N-type bifacial modules are 15%-20% more sensitive to shading than P-type single-sided modules. When the shading exceeds 5%, the power generation of the entire row decreases nonlinearly.
Core formula for row spacing: D = H × k
H = module length × sin β + height above ground
k is the spacing coefficient (related to latitude φ, tilt angle β, module length L, and solar declination δ)
Design objective: On the winter solstice from 09:00 to 15:00, the shadow coverage from the front row to the back row should be ≤5%
Latitude range | Spacing coefficient k | D/H ratio | Application Scenarios |
0°-10° | 0.85-1.0 | 0.85-1.0 | Low-Inclination Projects Near the Equator |
10°-25° | 1.0-1.4 | 1.0-1.4 | Low-latitude distributed |
25°-35° | 1.6-2.0 | 1.6-2.0 | Southern China, India |
35°-45° | 2.0-2.5 | 2.0-2.5 | Northern China, Southern United States |
45°-55° | 2.5-3.2 | 2.5-3.2 | Northeast China, Northern Europe |
55° and above | 3.2-4.0 | 3.2-4.0 | High-latitude Polar Fringe |
Shading Control
Shading control is the ultimate goal of spacing design, with the core indicator being that the shadow coverage of the front row on the back row does not exceed 5% during the period from 09:00 to 15:00 on the winter solstice. N-type bifacial modules are significantly more sensitive to shading than P-type single-sided modules because, under shading, the shaded portion of the bifacial module no longer receives back-side irradiation, leading to a mismatch in the current of the entire module and a risk of hot spots.
The four-step method for shading control includes: winter solstice shadow verification (using PVsyst 3D model), analysis of surrounding obstacles (horizon file, 100m beyond the boundary), inter-array shading check (azimuth verification), and shading re-verification during the operation and maintenance period (conducted in the 2nd and 5th years).
I participated in the shadow review of a 50MW ground-mounted power plant in Tangshan, Hebei. The initial design had a tilt angle of 35° and a spacing of 2.0D/H. During the first year of operation, it was found that after 10:30 AM on the winter solstice, the eastern 8 rows of modules were shaded by the front row by 12%, and the total power generation was 3.8% lower than the PVsyst simulation. The final solution was to reduce the tilt angle to 32° and increase the spacing to 2.3D/H, which reduced the winter solstice shadow coverage to 3.8% and the annual power generation from -3.8% to -0.4%, resulting in a 3.4% increase in annual power generation after the modification.
Surrounding obstacles are often overlooked in shading control: a communication tower 30m to the west casts long shadows from 09:30 to 10:30 AM, affecting 5-8 rows of modules; the eastern mountain blocks sunlight from 09:00 to 10:00 AM, resulting in a 5%-8% loss in winter power generation; buildings, temporary facilities, and trees within 100m of the site must be included in the horizon file modeling.
The re-verification of shading during the operation and maintenance period is easily overlooked: surrounding poplar/willow trees grow 2-3m taller (in an 8MW project in Wuwei, Gansu, the 3-year poplar forest shadow increased by 3.5%, and the annual power generation decreased by 1.2%), new buildings, and terrain settlement, etc. The horizon file needs to be updated once a year.
1. Winter solstice shadow verification: PVsyst 3D model simulates the period from 09:00 to 15:00 on the winter solstice, with the front row's shadow coverage on the rear row ≤5%. N-type bifacial modules have a 15%-20% higher shadow sensitivity compared to P-type single-sided modules.
2. Analysis of surrounding obstacles: The horizon file covers an area 100m beyond the boundary to identify the shadow effects of communication towers, mountains, and buildings.
3. Inter-array shading check of the module array: Azimuth deviation recheck, true south deviation within ±2 degrees.
4. Re-inspection of shading during operation and maintenance period: Conduct once in the 2nd year and once in the 5th year, focusing on checking the growth of surrounding trees, new buildings, and terrain settlement.
Ground Maintenance Access
Ground maintenance access is often an underestimated aspect of spacing design. The core is to leave sufficient passage and operating space for the operation and maintenance period. If spacing design only considers winter solstice shading without considering maintenance, it will lead to doubled cleaning time, inability to retighten fasteners, and inability to quickly handle emergency failures.
There are four types of maintenance spaces: main passage (along the long side of the site, accessible by small forklifts of 1.5t, with a clear width of 3.5m), branch passage (set every 6-8 rows, for manual handling of equipment, with a clear width of 1.2m), equipment side space (for maintenance of junction boxes and inverters, 1.5m × 1.5m), and front and back of the array (for cleaning the back side of bifacial modules and retightening fasteners, add 0.3-0.5m on the basis of D = H × k).
I reviewed the maintenance of a 45MW ground-mounted power plant in Yulin, Shaanxi. The initial design had a spacing of 1.8D/H. After three years of operation, the cleaning time reached 18h/MW (industry standard is 6h/MW) because small forklifts could not enter between the arrays, and equipment had to be moved manually. After modifying to 2.0D/H, small forklifts could enter the main passage, and the cleaning time was reduced to 7h/MW, close to the industry standard.
The maintenance space for bifacial modules is more complex than that for single-sided modules. The lower edge of the module is 0.5-1.2m above the ground, and workers need to bend over to complete fastener retightening and back-side cleaning. When the slope of the mountain power plant is above 25°, insufficient passage will lead to safety accidents (a mountain power plant in Yunnan once had a maintenance worker fall and get injured due to insufficient passage), and the branch passage needs to be expanded to 1.5m and equipped with anti-slip steps.
The operational steps for maintenance space are: incorporate the main passage and branch passage layout into the spacing design stage → verify the clear width of the passage with the PVsyst 3D model → measure the clear width and slope of the passage during acceptance → review the passage condition in the 2nd year of the operation and maintenance period (check for settlement, vegetation, blockage).
Channel Type | Minimum Net Width | Purpose | Layout density |
Main Channel | 3.5 meters | Small forklift (1.5t) passage | 1 string per module block |
Branch channel | 1.2 meters | Manual Handling Equipment | Every 6-8 rows |
Equipment side | 1.5m × 1.5m | Combiner Box/Inverter Maintenance | Each device unit at location 1 |
Front and rear (bifacial) | +0.3-0.5 meters | Backside Cleaning and Retightening | Incorporate Spacing Design |
Rear-Side Gain
Rear-Side Light Utilization
Rear-side light utilization is the core advantage of N-type bifacial modules compared to P-type monofacial ones. The physical basis is that ground-reflected irradiance is captured by the rear side of the module and converted into electrical energy. N-type bifacial modules have a nominal bifaciality of 80%-85%, meaning the rear-side power can reach 80%-85% of the front-side power. This parameter is clearly defined in the IEC 61215-1:2021 standard.
The rear-side power generation consists of three components: reflected irradiance (60%-80%), diffuse irradiance (15%-25%), and atmospheric long-wave radiation (5%-15%). The dominance of reflected irradiance means that the higher the albedo α and the larger the view factor VF, the more significant the rear-side gain. The instantaneous albedo after snowfall can reach 0.60-0.85, causing the rear-side gain to skyrocket to 25%-30% or more.
I participated in the rear-side scheme selection for an 8MW agrivoltaic project in Liangshan, Sichuan. The three ground albedo options (gravel/weed control fabric/concrete) corresponded to rear-side gains of 9.8%/15.2%/17.6%, respectively, showing a significant difference. The final choice was the white weed control fabric scheme, which resulted in an 11.2% higher first-year power generation compared to the initial design (grassland). Albedo is the primary variable for rear-side gain, having a greater impact than tilt angle and height above ground.
The core formula is: G_rear = α × G × VF. Here, α is the ground albedo (0-1), G is the total ground irradiance (W/m²), and VF is the view factor (0.5-0.7). The VF is influenced by three variables: tilt angle β, height above ground H_g, and array spacing D. When the tilt angle changes from 30° to 45°, the VF decreases from 0.62 to 0.51 (rear-side gain from 13% to 11%). When the height above ground increases from 0.5m to 1.0m, the VF increases from 0.55 to 0.68 (rear-side gain from 11% to 14%).
The temperature advantage of the rear side is a frequently overlooked source of gain: the rear-side temperature is 3-5°C lower than the front side (due to not receiving direct sunlight), resulting in a smaller overall temperature coefficient degradation of the module, and the actual power generation is 1.5%-2% higher than the monofacial nominal value. In a 20MW bifacial project in Zhongwei, Ningxia, the actual power generation was 2.3% higher than the PVsyst simulation, with about half of the contribution coming from the rear-side temperature advantage.
The core formula for rear-side gain: Grear = α × G × VF
α: Albedo (0-1), G: Total ground irradiance (W/m²), VF: View factor (0.5-0.7)
Reflected irradiance accounts for 60%-80%, diffuse irradiance 15%-25%, long-wave radiation 5%-15%
The nominal bifaciality of N-type cells is 80%-85%, with actual project rear-side gain of 10%-30%
Ground Surface Selection
Ground surface selection is the actionable part of rear-side gain design and directly determines the value of albedo α. Different ground surfaces have vastly different albedos, ranging from dark soil at 0.10-0.15 to snow at 0.60-0.85, a span of 6-8 times. This is why the same N-type bifacial module can have a rear-side gain difference of more than 10 percentage points on different ground surfaces.
The albedo of 7 typical ground surfaces is as follows: natural grassland 0.15-0.25 (rear-side gain 8%-10%), gravel/gobi 0.20-0.30 (9%-12%), dark soil 0.10-0.15 (6%-8%), light-colored weed control fabric 0.40-0.50 (14%-18%), white weed control fabric 0.50-0.60 (17%-22%), light-colored concrete 0.50-0.65 (18%-23%), and instantaneous snow surface 0.60-0.85 (25%-30%).
I participated in the ground modification of a 35MW agrivoltaic project in Weifang, Shandong, where the original grassland was changed to white weed control fabric. The albedo increased from 0.22 to 0.55, and the first-year power generation was 8.2% higher than before the modification. Of this, 4.8 percentage points came from the capture of front-side irradiance (weeds no longer obstructing the lower edge of the module), and 3.4 percentage points came from the increase in rear-side gain. The modification work was 12 yuan/m², with the gain recovered within 3 years.
The longevity and albedo degradation of PE woven fabric are often overlooked. In a 15MW project in Hami, Xinjiang, the albedo of the PE woven fabric decreased from 0.52 to 0.31 after 3 years, and the rear-side gain dropped from 17.5% to 10.2%. The power generation in the 3rd year was 7.3% lower than in the 1st year, requiring re-laying or replacement every 3-5 years.
Ground surface selection needs to balance the four dimensions of albedo, longevity, maintenance, and material demand: concrete has high albedo but high material requirement (80-120 yuan/m²), PE woven fabric has high albedo but short longevity (3-5 years), and grassland has low albedo but low maintenance. For maximizing rear-side gain, white weed control fabric with regular replacement is recommended; for comprehensive consideration, light-colored weed control fabric with low maintenance is recommended.
Albedo: dark soil (0.10-0.15) → grassland (0.15-0.25) → gravel (0.20-0.30) → light-colored weed control fabric (0.40-0.50) → white weed control fabric (0.50-0.60) → light-colored concrete (0.50-0.65) → instantaneous snow surface (0.60-0.85)
Rear-side Gain: Dark Soil 6%-8% → Grass 8%-10% → Gravel 9%-12% → Light-colored Weed Control Fabric 14%-18% → White Weed Control Fabric 17%-22% → Light-colored Concrete 18%-23% → Snow Surface 25%-30%+
PE woven fabric lifespan: 3-5 years, albedo degradation 0.52→0.31 (3-year measured data)
Weed Management: If weeds exceed 0.3m in height within 1m below the module edge, the rear-side temperature increases by 5-8 percentage points
Renovation Update Cycle: Converting grassland to white weed control fabric requires 12 yuan/m², with the gain fully realized within 3 years
Gain Verification Checkpoints
Gain verification checkpoints are the acceptance closure from the design value to the actual value of rear-side gain, with the core indicator being the back-to-front ratio Gᵣ/Gᶠ (rear-side irradiance / front-side irradiance). The typical range of the back-to-front ratio for N-type bifacial modules is 10%-25%, and it can reach 25%-30% after snowfall. This is because there are secondary losses in the conversion from irradiance to power, which explains why the ratio is significantly lower than the nominal bifaciality (80%-85%).
The 4 key nodes are: design phase (PVsyst + albedo parameters, conventional 0.25-0.30, snow period 0.35-0.45), commissioning phase (within 1 month after grid connection, Gᵣ/Gᶠ measured at sunny noon 11:00-13:00, target 10%-25%), operation phase (general survey in the 1st/3rd/5th year, sampling ≥5%), and special weather (check after snowfall/rainstorm/sandstorm).
I conducted the acceptance of a 32MW ground station in Shizuishan, Ningxia. The PVsyst simulation used an albedo of 0.30, and the designed rear-side gain was 12.5%. During the commissioning phase, the measured Gᵣ/Gᶠ at sunny noon was 13.8%, a deviation of +1.3 percentage points from the design value. The source of the deviation was that the design phase was conservative in estimating the reflection characteristics of the site, with the measured albedo being 0.33. The commissioning phase measurement is a key link in the verification of the design value and cannot be omitted.
The gain verification during special weather is most easily overlooked. In a 5MW project in Suihua, Heilongjiang, the measured Gᵣ/Gᶠ was 29.3% on the second day after snowfall, which was the peak for the year. The gain after snowfall lasts for 2-3 days and is not included in the annual power generation forecast. The general survey in the 1st/3rd/5th year of the operation phase is the key to discovering local gain anomalies: in a 15MW project in Hami, Xinjiang, it was found in the 3rd year that 3% of the area had a decrease in rear-side gain from 15% to 8% due to weed obstruction.
Reference for acceptance criteria: IEC 61215-1:2021 (module design qualification), IEC 61853-2:2016 (performance testing and efficiency rating, including spectral reflectance testing), ISO 9060 (secondary standard irradiance meter). Data acquisition interval ≤1 minute, period ≥72 hours.
1. Design phase: PVsyst model + albedo parameters (conventional 0.25-0.30, snow period 0.35-0.45). For every 0.05 deviation in albedo, there is a 1.5-2 percentage point deviation in back-side gain.
2. Commission Period: Within 1 month after grid connection, measure Gᵣ/Gᶠ during typical sunny days at 11:00-13:00 noon, with a target of 10%-25%. If the deviation exceeds ±3 percentage points, the PVsyst model needs to be reviewed.
3. Operation Period: Census in the 1st/3rd/5th year after commissioning, with a sampling rate of ≥5%. In the 3rd year in Hami, Xinjiang, due to weed shading covering 3% of the area, the gain dropped from 15% to 8%.
4. Special Weather: Temporary inspection after snow/rain/dust storm, Gᵣ/Gᶠ typically 25%-30% after snow. Actual measured value in Suihua, Heilongjiang for a 5MW system after snow was 29.3%.
Three steps lock base output: latitude-tilt, D=kH check, shading <5%. Albedo +0.1 adds 3-5% gain, snow peak 25-30%. IEC 61215/61853-2, interval <1 min, period >72 h.