A short power drop after cleaning is usually normal — but only when it happens while the modules are being washed, while the glass is still wet, or while the monitoring system is averaging the cleaning period. Once the glass is dry, irradiance is stable, and the tracker and inverter are back to normal, one string should not continue producing noticeably less power than similar strings. If it does, that is when further checking makes sense.
Take a simple example. A string is producing 105 kW before cleaning. A robot crosses the row and output falls to 88 kW. With water still on the glass, it comes back to 100 kW. Once dry, it returns to about 104-105 kW. That is a normal temporary pattern. If the same string stays near 95 kW after everything else has returned to normal, the situation is different and should not be dismissed as a cleaning effect.
If the Drop Happens Only While Cleaning
Start with the most obvious cause: something may simply be blocking the light. Brushes, robots, workers, hoses and cleaning vehicles can all shade cells while the work is being done.
The shaded area and the power loss do not always match one-to-one. A brush covering 10% of a module does not necessarily mean exactly a 10% loss. Where that shade falls matters because the cells inside the module are electrically connected.
A narrow brush crossing several cells in the same electrical substring may have a larger effect than its visible size suggests. If the shading is strong enough, the bypass diodes can also begin to conduct. NREL testing shows that partial-shading losses depend on module circuit design, shade position and bypass-diode arrangement.[1]
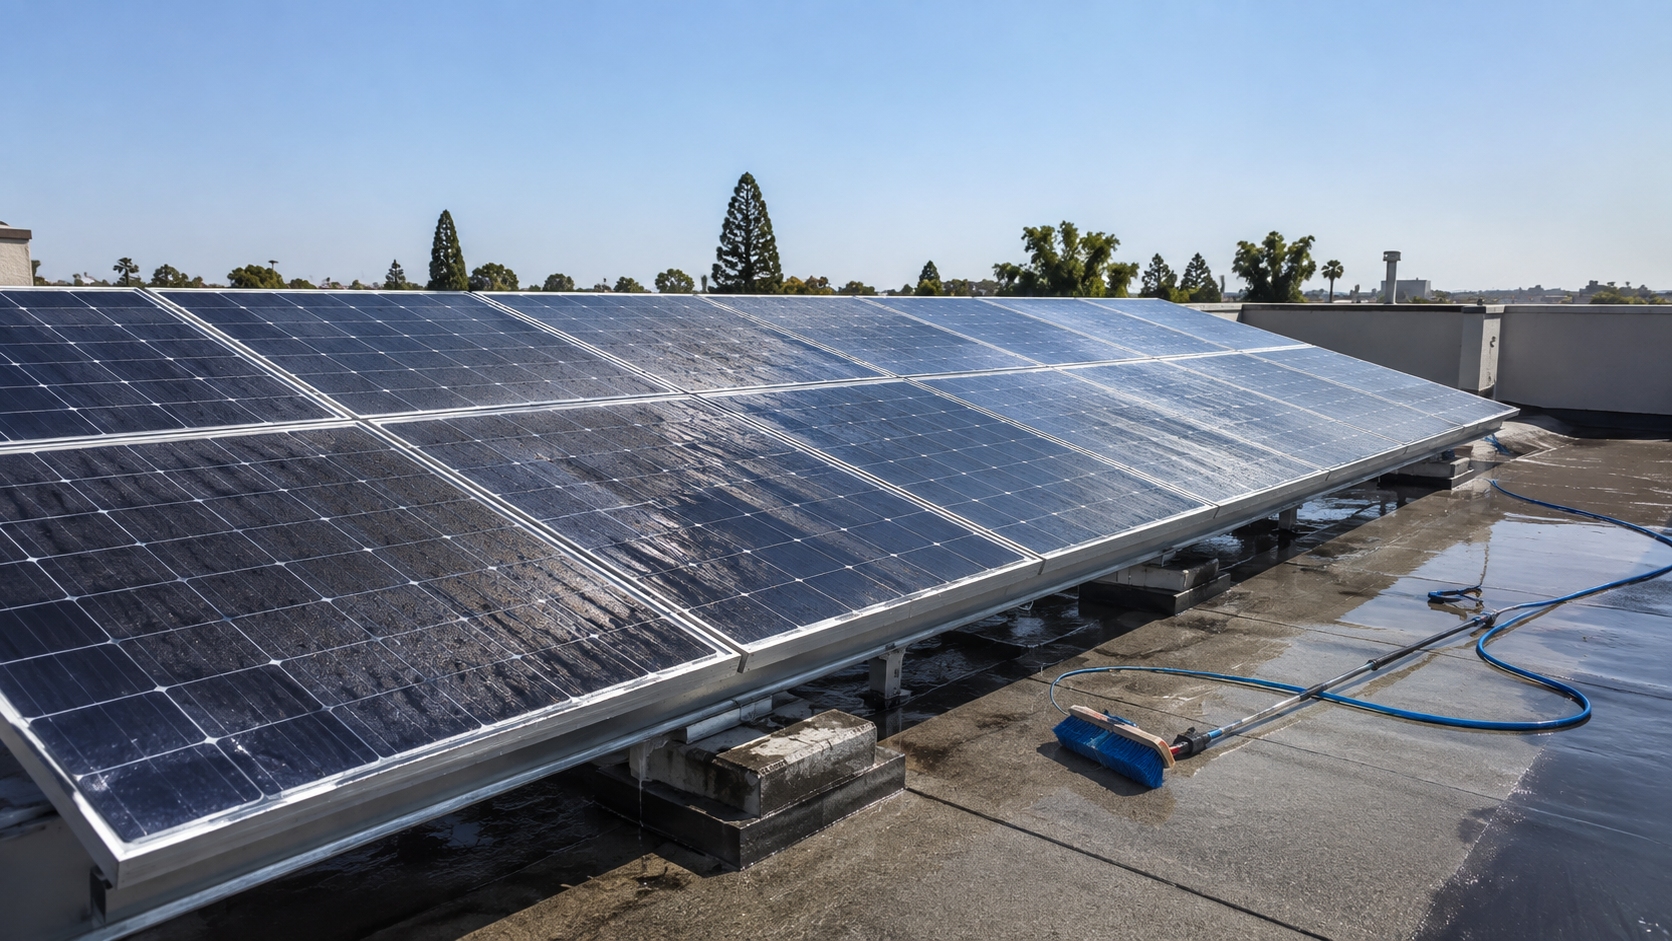
The cleaning route often tells you more than the power number itself. If the dip appears on String 1, then String 2, then String 3 in the same order as the cleaning machine moves, the first thing to suspect is moving shade.
Monitoring intervals can make this effect look bigger. If a robot takes 90 seconds to cross a row, that cleaning event occupies 30% of a five-minute monitoring period:
90 ÷ 300 × 100 = 30%
So a five-minute power value may look poor even though the row was only affected for 90 seconds and worked normally before and after the robot passed.
If Power Stays Low While the Glass Is Wet
Look at the surface before looking at the inverter. Freshly washed modules may still have droplets, streaks or areas that are drying at different speeds. Those water patterns can change how much light reaches the cells and how evenly that light is distributed.
Sandia uses the term effective irradiance for the irradiance available to the cells after optical effects are considered.[2]
There is no single “wet module loss” percentage that works for every site. What happens depends on:
- how much water remains;
- whether it forms droplets or a more uniform film;
- sun angle;
- module tilt;
- glass and anti-reflective coating;
- wind and humidity.
A low-tilt module may keep water around the lower cell rows for longer. A steeper module in dry, windy conditions may clear much faster. Because of that, a rule such as “every module should recover within 10 or 20 minutes” is not reliable.
Use what you can actually see. If the module is still wet, let it dry before comparing its output with a normal dry operating condition.
If Only Part of the Module Is Still Wet
Uneven drying matters more than it may appear. One part of the module can already be dry while another part is still receiving less effective light.
Consider a 24-module string. Twenty modules are dry, but four still have uneven wet areas. Those four modules can now have different current-voltage characteristics from the other 20. The string does not automatically lose a fixed percentage, but its operating point can shift away from where it was before cleaning.
The electrical sequence is:
uneven light → electrical mismatch → possible bypass operation if the difference becomes large enough.
This distinction is important. A wet patch does not automatically mean a bypass diode is conducting, and a temporary power dip does not prove that the diode is damaged.
If the mismatch is still there after the surface dries, compare the string with similar strings operating under the same conditions. Tongwei's discussion of PV module mismatch losses also separates missing irradiance from the extra electrical loss caused when modules or strings are no longer operating near their own best operating point.
If the Dashboard Shows a Bigger Drop Than You Saw
The dashboard may be showing an average, not what the array was producing at one exact moment.
Suppose a string normally produces 100 kW and a five-minute record contains:
- Minute 1: 100 kW
- Minute 2: 100 kW
- Minute 3: 50 kW during cleaning
- Minute 4: 50 kW during cleaning
- Minute 5: 100 kW
The five-minute average is:
(100 + 100 + 50 + 50 + 100) ÷ 5 = 80 kW
On the dashboard, that looks like a 20% reduction. In reality, the strong drop only lasted two minutes. DOE notes that PV monitoring systems combine electrical and environmental measurements, and those records need to be interpreted correctly before they are used for fault diagnosis.[3]
Before treating one low data point as a fault, check three things:
- timestamp;
- sampling or averaging interval;
- whether the value is instantaneous or averaged.
If the Whole Plant Drops at the Same Time
A plant-wide drop usually calls for a plant-wide check first. Irradiance is the obvious place to start.
Example:
- First reading: 900 W/m² irradiance and 850 kW array power.
- Second reading: 750 W/m² irradiance and 710 kW array power.
Irradiance fell by:
(900 − 750) ÷ 900 × 100 ≈ 16.7%
Power fell by:
(850 − 710) ÷ 850 × 100 ≈ 16.5%
The two changes are almost the same size. In that situation, calling the full 16.5% decrease a cleaning loss would give the wrong picture.
The same applies when comparing different times of day. A 10:00 a.m. power reading and an 11:00 a.m. reading are not directly comparable unless irradiance and the other operating conditions are also similar.
If Irradiance Looks Stable but Power Is Still Low
Stable irradiance narrows the search, but it still does not point straight to a module fault.
On a tracker system, first check:
- actual row angle;
- cleaning mode;
- stow mode;
- return-to-track status;
- tracker alarms.
A module can be perfectly clean and still produce less power if the row has not returned to the correct tracking angle.
Then look at the inverter or plant controller:
- grid curtailment;
- export limits;
- active-power limits;
- thermal derating;
- plant-controller setpoints.
For example, an inverter that could produce 500 kW but is being limited to 450 kW is operating 10% below that available level:
(500 − 450) ÷ 500 × 100 = 10%
No amount of module cleaning will push output above an active inverter or plant limit.
If Performance Ratio Falls After Sensor Cleaning
The modules may not be the problem at all. Sometimes the number changes because the irradiance sensor was cleaned first.
Suppose a dirty plane-of-array sensor reports 850 W/m². After cleaning, it reports 900 W/m² under otherwise similar sunlight.
The recorded irradiance has increased by:
(900 − 850) ÷ 850 × 100 ≈ 5.9%
If the PV array has not yet been cleaned, or its output has not increased by the same amount, the calculated performance ratio can fall. That does not mean the modules suddenly became worse.
Keep cleaning records for:
- plane-of-array sensors;
- reference cells;
- pyranometers;
- weather-station equipment.
A PR change should not be treated as module degradation until the sensor condition and timestamps have been checked.
If Someone Blames the Cold Water
For crystalline-silicon modules, lower cell temperature normally helps power output. The module's Pmax temperature coefficient tells you how strong that effect is.
Sandia gives representative crystalline-silicon power temperature coefficients of roughly −0.3%/°C to −0.5%/°C, depending on technology.[4]
For a module with a coefficient of −0.35%/°C, a 10°C lower cell temperature gives a simple estimate of:
10 × 0.35% = about 3.5%
If irradiance stayed unchanged, temperature alone would tend to increase power by about 3.5%.
Cleaning, of course, changes more than temperature. An example might look like this:
- cooler cells: +3%;
- water and cleaning shade: −7%;
- measured result: about −4%.
Those numbers are an example, not an industry benchmark. They simply show why a lower measured value cannot automatically be blamed on cooling.
Water temperature still matters for safe cleaning. IEA PVPS states that cleaning-water temperature should be close to module temperature to reduce thermal-shock risk.[5]
If Power Is Still Low After the Glass Is Dry
At this point, inspect the surface closely. A module can look clean from a distance and still have enough residue or dirt left in one area to affect output.
Check for:
- white mineral spots;
- rings left by dried droplets;
- detergent film;
- mud along the lower frame;
- pollen or dust pushed toward the bottom cell rows;
- partly removed bird-dropping residue.
IEA PVPS notes that rainwater or deionized water can be used to reduce residues after drying in relevant cleaning processes.[6]
Do not apply one universal TDS or conductivity limit to every project. Where the manufacturer or cleaning-system supplier provides water-quality limits, use those values.
The same applies to cleaning chemicals. A household window cleaner is not automatically suitable for PV glass or an anti-reflective coating.
If Dirt Remains After Washing
Pay particular attention to the lower frame and areas that repeatedly go through wet-dry cycles. These are common places for dirt to remain or become harder to remove.
IEA PVPS describes cementation, caking and capillary aging as mechanisms that can increase particle adhesion. During drying, dissolved material can form solid bridges between particles and the glass surface.[7]
So a module can look much cleaner after washing and still retain an optically important dirt band.
One long-term example reviewed by IEA PVPS found a lower-edge pollution strip associated with a loss as high as 10% at that specific installation. The same report also shows cleaning gains ranging from a few percent to around 10% in different years at that site. These are site observations, not universal cleaning-loss values.[8]
Simply pressing harder with the brush is not a good fix for bonded deposits. The cleaning method may need to change instead.
If Dry Cleaning Was Used
With a completely dry cleaning process, water film, drying time and mineral residue are no longer useful explanations.
Check instead for:
- temporary shade from the robot;
- dust moved rather than removed;
- dirt accumulated near the frame;
- sand trapped in the brush;
- tracker cleaning position;
- surface abrasion.
Cleaning abrasion matters when hard particles are present. IEA PVPS reports that repeated brush testing can produce significant effects on anti-reflective coated glass, while the result depends strongly on the glass, coating, particles, brush and test conditions.[9]
A power dip while the robot crosses the row is temporary. Damage to the coating is not.
If the Plant Uses Bifacial Modules
Front-side cleaning is only half of the picture on a bifacial array. If one string remains low, check what is happening behind the modules as well.
Rear-side output can be affected by:
- rear-side contamination;
- rear shading;
- mounting rails and other obstructions;
- ground reflectance;
- row spacing;
- module height;
- tracker geometry.
IEA PVPS notes that bifacial system performance depends on rear-side irradiance and installation conditions, not only on front-side module power.[10]
If the front surface is already clean but a bifacial string remains weak, inspect the rear side before deciding the front cleaning failed. Tongwei's article on rear-side loss in bifacial modules also covers rails, row spacing and uneven rear illumination.
If Only One String Stays Low
This is where a side-by-side string comparison becomes useful. Pick a nearby string with the same basic operating conditions rather than comparing against a random string elsewhere in the plant.
The reference string should have similar:
- module model;
- module count;
- orientation or tracker angle;
- irradiance;
- temperature;
- shading;
- MPPT configuration.
Example:
- String A: 12.1 A
- String B: 10.7 A
The difference is:
(12.1 − 10.7) ÷ 12.1 × 100 ≈ 11.6%
An 11.6% difference under genuinely comparable conditions is worth checking. It is not a universal fault threshold.
Now compare a much smaller gap:
- String A: 12.0 A
- String B: 11.8 A
The difference is only:
(12.0 − 11.8) ÷ 12.0 × 100 ≈ 1.7%
Lower current may come from dirt, shading, lower local irradiance, mismatch or an electrical fault.
Voltage gives another piece of the picture:
- similar voltage but lower current: check irradiance, contamination and shading;
- noticeably lower voltage under similar conditions: check string configuration, wiring and possible bypass-related behavior;
- both current and voltage abnormal: expand the electrical inspection.
Voltage should not be used on its own because temperature and MPPT operation also change string voltage.
If an Insulation or Ground-Fault Alarm Appears
This is no longer just a question of wet glass or temporary shade.
Check for problems involving:
- DC cables;
- connectors;
- junction boxes;
- module insulation;
- damaged glass or backsheets;
- existing insulation defects exposed by wet conditions.
DOE recommends planned inspection and fault testing as part of PV operation and maintenance.[11]
Do not repeatedly restart the inverter or unplug live DC connectors just to see whether the fault goes away. PV strings can remain at hazardous DC voltage while exposed to light.
If the String Still Underperforms After These Checks
Once the simple causes have been ruled out, use measurements that can show what is actually happening inside the module or string.
I-V curve testing can show low current, reduced voltage, mismatch and steps in the curve. Irradiance and module temperature should be recorded with the test.
Infrared imaging can reveal hot cells, hot substrings, junction-box heating and abnormal connectors.
Electroluminescence testing is useful when cell cracks or electrically inactive areas are suspected.
IEA PVPS identifies IR and EL as useful PV field-inspection methods and discusses how test conditions affect interpretation.[12]
Use this order:
monitoring data → string comparison → surface inspection → I-V or IR → EL if internal cell damage is still suspected.
A five-minute power dip during cleaning is not a reason to jump straight to EL testing.
If You Need to Know Whether Cleaning Actually Worked
Use a reference string under the same conditions. Comparing raw plant kW from different times of day can easily give the wrong answer.
Before cleaning:
- test string: 9.8 A;
- reference string: 10.5 A;
- test/reference ratio: 93.3%.
After cleaning under similar conditions:
- test string: 10.4 A;
- reference string: 10.5 A;
- test/reference ratio: about 99.0%.
The useful change is not simply 9.8 A to 10.4 A. The test string moved from about 6.7% below the reference to about 1% below it.
Temperature- and irradiance-normalized data are better when available. Sandia's normalized-efficiency approach accounts for temperature when PV performance is compared.[13]
The same approach is useful when checking long-term module reliability: compare electrical performance under equivalent conditions instead of relying on one isolated power value.
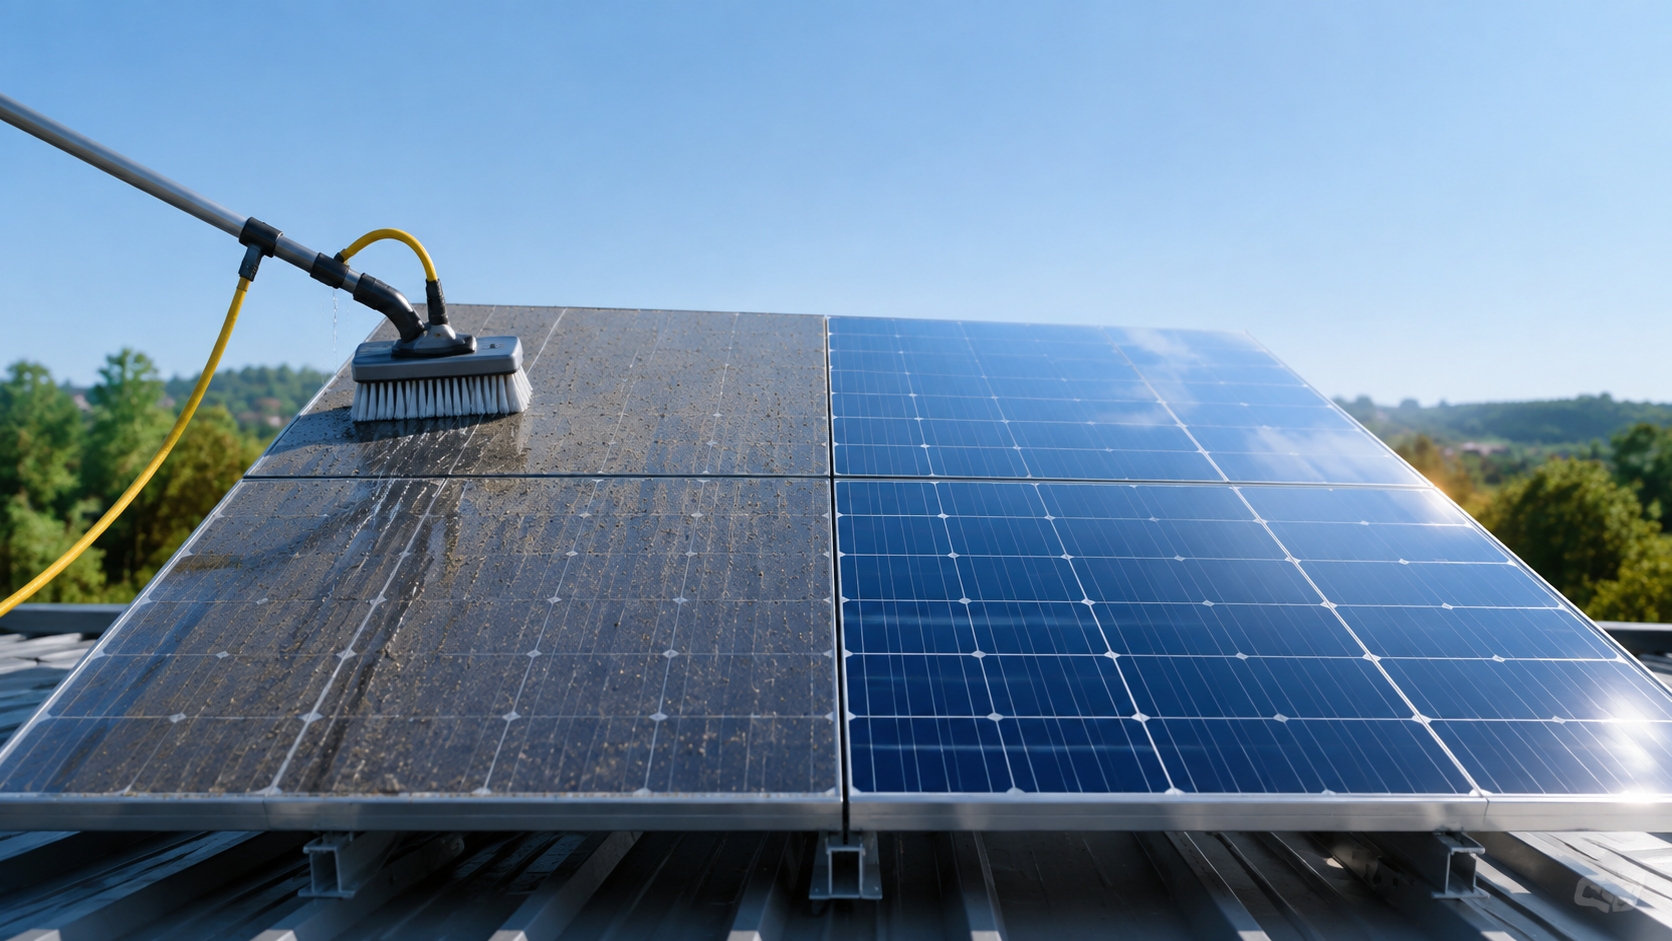
Record These Values During Cleaning
A useful maintenance record should make it possible to match the power event with the work that was happening at the time.
- cleaning start time;
- cleaning finish time;
- rows or blocks cleaned;
- wet or dry method;
- irradiance;
- module temperature;
- tracker position;
- affected inverter and MPPT;
- any inverter alarms;
- water or residue problems seen after drying.
For example, “Rows 21-28 cleaned from 09:42 to 09:55; power dip from 09:44 to 09:54; normal current restored at 10:03” gives a technician something useful to work with.
A note that only says “the plant was cleaned in the morning” does not.
Finally
A temporary drop should line up with a temporary cause. A five-minute dashboard value can show a 20% average reduction even when heavy cleaning shade lasted only two minutes. At the same time, a crystalline-silicon module with a −0.35%/°C coefficient would theoretically gain about 3.5% when cell temperature falls by 10°C at unchanged irradiance.
Once the glass is dry, compare the affected string with an equivalent string under the same irradiance, tracker position and inverter condition. If one string remains 5%-10% lower, or current, voltage or insulation alarms remain abnormal, move from cleaning checks to electrical testing.