How Should Reference Solar Modules Be Maintained for Accurate Performance Monitoring
Reference solar modules should be kept clean, correctly aligned, electrically secure, properly calibrated, and fully documented. Check the data every day, inspect the hardware regularly, and perform an extra check after storms, repairs, transport, cleaning, or software changes. A clean glass surface is not enough: a loose temperature sensor, five-minute clock error, shifted mounting angle, or incorrect logger factor can still make the monitoring result unreliable. Check the data every day, inspect the hardware regularly, and perform an extra check after storms, repairs, transport, cleaning, or software changes. A clean glass surface is not enough: a loose temperature sensor, five-minute clock error, shifted mounting angle, or incorrect logger factor can still make the monitoring result unreliable.
IEC 60904-2:2023 covers the selection, calibration, marking, packaging, and care of photovoltaic reference devices. IEC 61724-1:2021 covers PV monitoring equipment, data collection, data-quality checks, soiling measurements, and bifacial-system monitoring.[1][2]
This guide mainly applies to field reference modules, PV reference cells, array-representative modules, portable check modules, and paired clean-versus-soiled devices. Follow the manufacturer's instructions, site electrical-safety rules, and project quality plan where they are stricter.
Confirm What the Device Is Measuring
Do not clean, move, or replace a reference module until its purpose is clear. Similar-looking devices may need different maintenance.
A reference device may be used to:
l Measure plane-of-array irradiance
l Represent the condition of an operating PV array
l Provide a clean baseline for soiling measurement
l Support laboratory or field electrical testing
Plane-of-array irradiance is the solar power reaching each square meter of the module's actual tilted surface. It is normally expressed in watts per square meter. Solar energy collected over time is normally expressed in watt-hours or kilowatt-hours per square meter.[3]
An irradiance reference is normally kept clean. An array-representative module should normally be cleaned at the same time as the array it represents. A soiling station usually has one clean device and one device that collects dirt naturally. Cleaning both devices together makes the soiling comparison unusable until a new clean baseline is recorded and dirt begins to build up again.
Before maintenance, confirm:
l Whether it is a reference cell, mini-module, or full-size module
l Whether it measures short-circuit current, maximum power, or another signal
l Whether it is monofacial or bifacial
l Whether it is permanently installed or portable
l Whether it provides an irradiance estimate or only a relative comparison
l Whether its cell technology is suitable for the monitored array
l Whether the data are used for routine monitoring, research, warranties, contracts, or financial decisions
The reference-device technology should match the application of the monitored PV module system as closely as practical.
Each device should have a durable label showing its ID, serial number, purpose, cleaning rule, calibration date, recalibration review date, and data logger channel.
Record a Baseline Before Normal Use
A baseline shows how the device and its full measurement circuit behave when they are known to be correctly installed.
Record:
l Manufacturer, model, and serial number
l Device type and measurement purpose
l Cell technology and monofacial or bifacial design
l Calibration factor, certificate number, date, and uncertainty
l Temperature coefficients
l Operating mode and shunt or load details
l Cable type, cable length, and connector type
l Data logger channel and software scaling factor
l Raw signal units and final displayed units
l Tilt angle and compass direction
l Mounting height
l Temperature-sensor position
l Normal nighttime offset
l Normal ratio to an independent reference
l Date and time placed into service
Photograph the front, rear, labels, mounting points, cables, connectors, temperature sensor, and surrounding horizon. Store the raw electrical signal as well as the calculated irradiance or power value. Raw data make it easier to separate a sensor problem from a logger or software problem.
Collect baseline data under clear conditions, at more than one irradiance level and module temperature. For trackers, include normal movement through several angles.
Allow for Measurement Uncertainty
No measuring device gives an exact value under every condition. Measurement uncertainty describes how much reasonable doubt remains around a measured result.[4]
Field uncertainty may come from:
l The original calibration
l Temperature measurement and correction
l Differences in spectral response
l Sun angle and directional response
l Mounting-angle error
l Dirt and partial shading
l Cable, connector, and shunt resistance
l Data logger gain or zero offset
l Timestamp mismatch
l Software conversion errors
A 1% difference between two sensors does not automatically prove that one has failed. The difference may be within their normal combined uncertainty.
Field research on outdoor PV reference cells found that their apparent response can change with calibration method, temperature, spectral conditions, and sun angle. In one study, standard outdoor calibration factors underestimated reference-cell responsivity by about 1% to 4% under the tested method and conditions.[5]
Set acceptable limits according to how the data will be used. Routine trend monitoring can usually accept more uncertainty than acceptance testing, warranty work, or financial settlement.
Check Tilt, Direction, and Tracker Movement
A reference module should normally face the same direction and sit in the same plane as the modules it represents.
For a fixed array, check:
l Tilt angle
l Compass direction
l Frame position
l Distance from nearby rows
l View of the sky
l Nearby shading
For a tracker, also check:
l Tracker angle
l Movement timing
l Backtracking behavior
l Mechanical play
l Stow position
l Controller faults
A loose bracket may move only a few degrees but still change the measured irradiance. A direction error may be most visible in the morning or afternoon and much less visible near noon.
Check alignment after installation, high winds, heavy snow, structural work, tracker repair, or nearby construction. Use an inclinometer or digital angle gauge. Do not judge the angle only by eye.
For paired soiling devices, keep the tilt, direction, airflow, drainage, edge exposure, shading, and rear ventilation as similar as possible.
Remove Local Shading
A small shadow can cause a larger electrical change than its visible size suggests.
Check for:
l Cables and clamps
l Leaves and bird droppings
l Weather-station arms
l Security cameras
l Fences and nearby structures
l Growing vegetation
l Row and tracker shadows
l Snow and ice
l Temporary tools or access equipment
If the reference module contains bypass diodes or separate cell sections, severe partial shading may activate a bypass path. A small reference cell without that circuit may behave differently.
Inspect at different times of day. A device that is clear at noon may be shaded in the morning or afternoon.
Common patterns include:
l A drop at the same time every day: fixed structural shading
l A morning-only difference: eastern obstruction or direction error
l An afternoon-only difference: western obstruction
l Short irregular drops: moving cables, vegetation, birds, or tracker parts
l A permanent change after construction: a new obstruction
Record the start and end of temporary shading so the affected data can be marked.
Match the Sensor to the PV Technology
A PV reference cell and a thermopile pyranometer do not respond to sunlight in exactly the same way. Different PV technologies also respond differently to different wavelengths of light.
Clouds, humidity, airborne particles, season, and sun angle change the solar spectrum. A crystalline-silicon reference device may therefore show a different relationship to a thin-film array under different weather conditions.
Do not expect two different sensor types to agree at all times. Establish their normal relationship under similar weather, temperature, and sun-angle conditions.
One outdoor study found that the difference between the highest and lowest measured energy from reference-cell products could exceed 3% when factory calibration factors were used. The spread became smaller when laboratory or field-derived calibration factors were applied.[6]
For bifacial projects, a front-only reference cannot automatically represent total front-and-rear irradiance. Tongwei's THC-G12-66 bifacial module is an example of a product whose field output depends on both front and rear light.
Set the Correct Cleaning Rule
Do not clean a reference module only when it looks dirty. Fine dust, pollen, salt, soot, and industrial particles can reduce light transmission before they are easy to see.
The cleaning frequency should depend on the device purpose, local dust, rain, bird activity, pollen, salt, snow, water quality, and the accuracy required.
l Irradiance reference: Keep it in a defined clean condition.
l Array reference: Clean it when the represented array is cleaned.
l Soiled reference: Do not clean it unless the approved procedure calls for a reset.
l Clean soiling reference: Clean it on the approved schedule and verify the result.
At severe dust sites, inspection or cleaning may be needed daily. At moderate sites, weekly inspection may be enough. These are starting examples, not universal rules. Also inspect after dust storms, bird fouling, heavy pollen, or an unexplained signal drop.
Record rain, snow, dew, overspray, and accidental washing of a soiled device. Rain does not always clean the full surface and may leave a dirt line along the lower frame.
Clean Without Damaging the Surface
Follow the manufacturer's cleaning instructions. Coatings, seals, adhesives, backsheets, and encapsulants may react differently to water and chemicals.
l 1. Confirm that the device should be cleaned.
l 2. Inspect and photograph the dirt pattern.
l 3. Record the time, weather, and array cleaning status.
l 4. Rinse loose dirt with suitable water.
l 5. Use an approved soft cloth or non-abrasive brush.
l 6. Rinse the surface fully.
l 7. Allow it to dry without deposits.
l 8. Inspect the edges and corners.
l 9. Record the result.
Use clean, low-mineral water where practical. Hard water may leave calcium or magnesium deposits. Where water quality is controlled, record the water source, treatment method, conductivity or total dissolved solids, cleaning agent, and final rinse method.
Avoid:
l Metal scrapers
l Abrasive pads
l Strong alkaline cleaners
l Unapproved solvents
l Oily detergents
l High-pressure jets
l Steam cleaning
l Dry wiping heavy dust
l Walking or kneeling on the module
Wet heavy dust before wiping. Repeated hard brushing can damage an anti-reflective coating.
Do not pour cold water onto a very hot module unless the manufacturer permits it. The device can also remain electrically live whenever it receives light, so site safety procedures still apply.
Verify the Cleaning Result
After cleaning, inspect the surface from several angles for water spots, streaks, grease, pollen, lower-edge deposits, bird-dropping residue, scratches, and coating damage.
Under stable sunlight, the output should normally rise if significant dirt was removed. Do not judge the result from one reading taken during moving clouds.
Compare data using:
l The same averaging interval
l Synchronized timestamps
l Similar irradiance and tracker position
l Stable or corrected module temperature
l The same logger channel and scaling
l No temporary shading
For example, if the corrected reference output rises from 780 W/m² before cleaning to 812 W/m² afterward, the increase is:
(812 − 780) ÷ 780 × 100% = approximately 4.1%
This supports the conclusion that dirt affected the reading, but only when cloud cover, temperature, sun angle, and tracker position were comparable.
If the signal does not improve, check alignment, shading, temperature sensing, cables, connectors, logger settings, and calibration before cleaning the surface again.
Record before-and-after photographs, cleaning time, water source, tools, weather, module temperature, output change, technician name, and the quality status of data collected during cleaning.
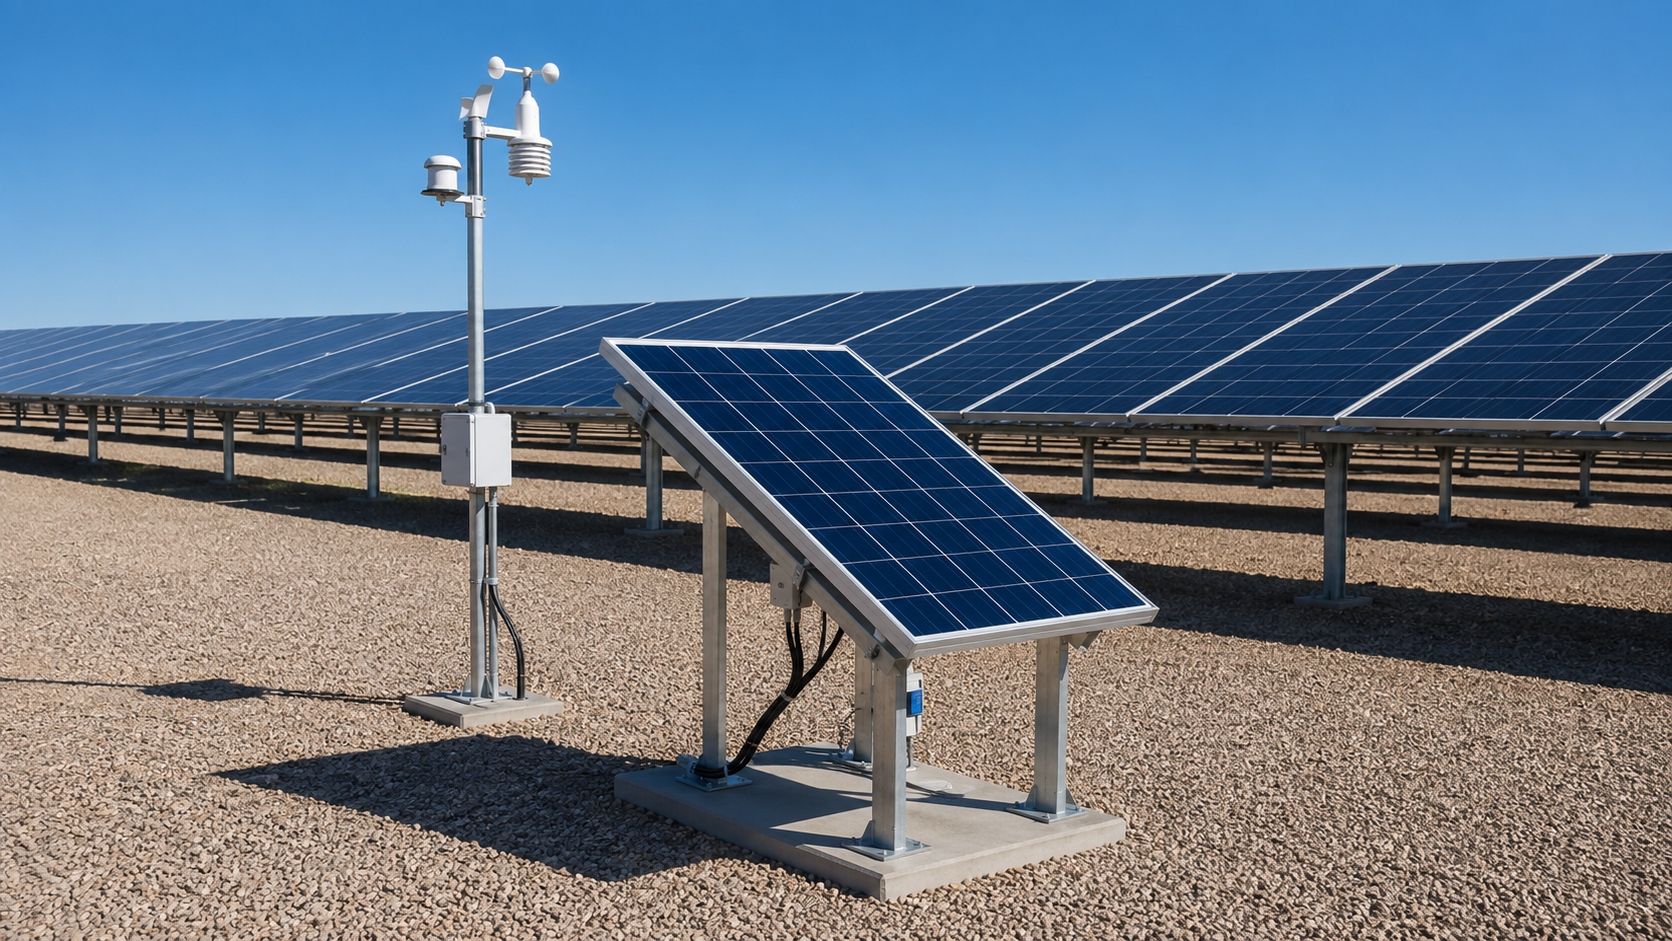
Inspect the Front, Frame, and Rear
Inspect the front for:
l Cracks and chips
l Scratches and haze
l Discoloration
l Delamination and bubbles
l Burn marks
l Coating damage
l Mineral deposits
The importance of damage depends on its location, depth, area, and effect on the signal. Photograph defects with a ruler or scale.
Do not repair cracks with tape, glue, resin, or sealant unless the manufacturer approves the method. Added material can change light transmission and temperature behavior.
Visible layer separation, bubbles, haze, or moisture marks may point to encapsulation damage. Tongwei's guide to solar module delamination explains common signs and causes.
Inspect the frame and mounting points for loose clamps, bent sections, corrosion, missing fasteners, cracked brackets, blocked drainage, cable rubbing, and uneven pressure on the glass.
After tightening hardware, recheck the tilt and direction.
Inspect the rear for backsheet cracks, chalking, moisture marks, burns, loose labels, animal damage, cable rubbing, junction-box movement, and open seals. Do not touch damaged insulation or exposed conductors until electrical safety has been checked.
Check Bifacial Rear-Side Conditions
The rear surface of a bifacial module is active. Cables, labels, rails, junction boxes, vegetation, snow, and nearby equipment can block rear irradiance.
Rear-side output also changes with ground reflectivity, mounting height, tilt, row spacing, and uneven rear lighting. IEA PVPS identifies ground reflectivity, diffuse light, module height, row spacing, and rear-side non-uniformity as important factors in bifacial performance.[7]
Inspect:
l Rear-surface cleanliness
l Cable and label placement
l Rail and junction-box shading
l Ground material and vegetation
l Snow and standing water
l Mounting height
l Changes in rear-side obstructions
Tongwei's article on reducing rear-side loss in bifacial modules gives practical examples involving rails, junction boxes, cables, and row layout.
If front and rear irradiance are measured separately, verify the calibration, scaling, temperature correction, and timestamp of both channels.
Inspect Cables, Connectors, and the Measurement Circuit
A healthy reference module can still produce incorrect data when its cable or measurement circuit is damaged.
Inspect cables for:
l Cuts and crushed sections
l UV damage
l Loose connectors
l Water entry and corrosion
l Rodent damage
l Tight bends
l Unsupported weight
l Excess tension
Cables should not hang from the junction box, rub on metal edges, or form water traps. Do not mix connector brands or connector families unless the combination is approved.
Never disconnect PV connectors under load. Electrical tests should be performed by qualified personnel using correctly rated equipment.
The measurement circuit may include a shunt resistor, precision resistor, signal conditioner, temperature sensor, data logger, communication gateway, and monitoring software.
For a short-circuit-current reference device, excessive circuit resistance can reduce the measured current. An incorrect shunt value or software factor will produce an incorrect irradiance result.
Verify:
l Signal polarity
l Input range and mode
l Sampling and averaging intervals
l Units and decimal position
l Shunt or resistor value
l Temperature-correction setting
l Firmware settings
l Software channel mapping
Test the complete path from the raw voltage or current to the final displayed value.
If hidden cell or interconnection damage is suspected, electrical measurements may be supported by electroluminescence testing. EL inspection should be carried out and interpreted by trained personnel.
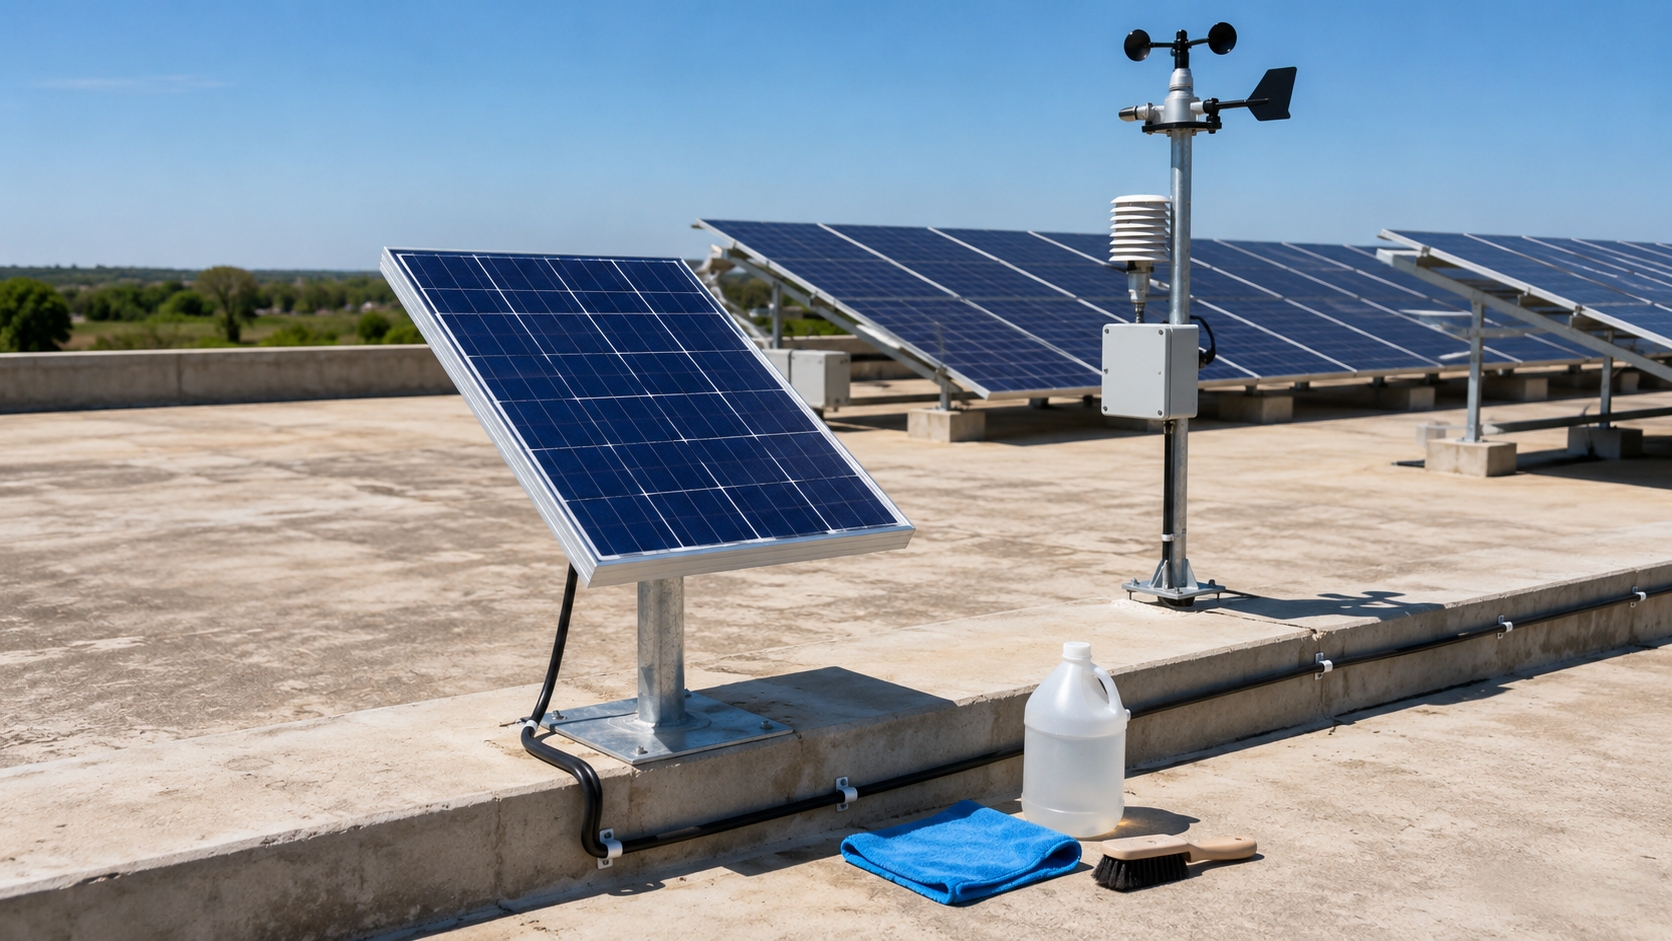
Check the Temperature Sensor
PV output changes with temperature. For crystalline-silicon devices, voltage normally falls as cell temperature rises, while current changes less strongly.
A rear-surface temperature sensor may be used to correct the reference signal. If the sensor detaches, it may measure something closer to air temperature than module temperature.
Check:
l Sensor position
l Adhesive condition
l Thermal contact
l Protective tape
l Cable strain
l Water sealing
l Signal stability
Do not move the sensor to a more convenient location. Keep a photograph or diagram of its original position.
A loose sensor may be suspected when the reported module temperature stays unusually close to ambient air temperature during strong sunlight.
A rear-surface measurement is not exactly the same as internal cell temperature. Consistent sensor placement is therefore important.
After replacement, record the old and new sensor IDs, calibration information, position, attachment method, replacement time, and before-and-after readings.
Check that temperature correction is not being applied once in the logger and a second time in the monitoring software. Tongwei's explanation of STC and NMOT ratings provides useful background on module temperature and real operating conditions.
Use Data to Find Problems Early
Review the reference data automatically every day.
Check for:
l Missing or repeated readings
l Negative daytime values
l Positive nighttime irradiance
l Flat signals during changing weather
l Sudden steps
l Unusual noise
l Temperature jumps
l Clock errors
l Long-term drift
With one-minute sampling, a complete 24-hour day contains 1,440 records. If only 1,380 records are available, 60 minutes are missing:
1,380 ÷ 1,440 × 100% = approximately 95.8% data completeness
This does not automatically make the whole day unusable. Check when the records are missing and which calculations depend on them.
A nighttime offset may come from the logger, signal conditioner, wiring, grounding, moisture, zero correction, or channel cross-talk. Track the normal offset and retain the raw value if a correction is applied.
Compare the reference signal with an independent sensor or benchmark, such as a second calibrated reference, pyranometer, verified weather station, clean reference, or validated clear-sky model.
A clear-sky model is a calculation, not a direct measurement. It can help reveal timing and curve-shape problems but cannot replace traceable calibration.
For example, suppose Sensor A reads 800 W/m² and Sensor B normally reads 784 W/m²:
(800 − 784) ÷ 800 × 100% = 2%
If Sensor B later falls to 744 W/m² under similar conditions:
(800 − 744) ÷ 800 × 100% = 7%
A change from the normal 2% difference to 7% should trigger an inspection. These values are examples, not universal alarm limits.
When plotting reference current against irradiance, use irradiance from an independent sensor. Do not calculate irradiance from the same reference current and then plot the two against each other; that circular test can hide a fault.
Check Timestamp Alignment
Reference data should use the same clock and timestamp method as inverter data, weather data, energy meters, tracker data, and maintenance records.
Check:
l Time zone
l Daylight-saving settings
l Logger, gateway, and server clocks
l Whether timestamps mark the start or end of an averaging period
l Clock synchronization after power loss
For example, if irradiance falls from 900 W/m² to 600 W/m² while a cloud passes, two correctly working devices with timestamps five minutes apart may appear to disagree by 300 W/m².
Five minutes is only an example. Fast-changing weather may require much tighter synchronization.
Use the Data Pattern to Narrow the Cause
Data Pattern | Possible Causes |
Constant difference all day | Wrong calibration factor, logger scaling, uniform dirt, shunt error, wrong channel, or cable resistance |
Difference mainly in the morning or afternoon | Direction error, horizon shading, nearby structure, cable shadow, or tracker timing |
Difference increases at high temperature | Loose temperature sensor, wrong coefficient, double correction, or different ventilation |
Difference mainly under clouds | Spectral mismatch, different sensor response times, diffuse-light response, or clock mismatch |
Sudden step after maintenance | Changed calibration factor, logger channel, cable, connector, angle, sensor position, or software setting |
Increasing noise | Loose connection, cable damage, poor shielding, grounding fault, moisture, or unstable power supply |
Flat signal during changing weather | Frozen logger channel, communication failure, cached value, disconnected sensor, or software error |
Slow long-term drift | Calibration drift, increasing dirt, coating damage, corrosion, sensor aging, shunt drift, or mounting movement |
Use the pattern to decide what to inspect first, but confirm the cause before changing a calibration factor or replacing the device.
Compare Devices Under Stable Conditions
Use a period with no local shade, no fast-moving clouds, stable tracker position, moderate or high irradiance, stable or corrected temperature, and correct timestamps.
For a routine field check, compare synchronized averages over about 5 to 15 minutes instead of relying on one-second readings. Shorten the period if irradiance or temperature changes noticeably. This is a practical example, not a fixed industry requirement.
Do not compare an instantaneous reading from one device with a one-minute average from another.
Record:
l Start and end time
l Sky condition and irradiance level
l Device temperatures
l Outputs and serial numbers
l Cleaning condition
l Mounting angles
l Logger channels
l Device technology
Repeat important comparisons on more than one day. A field comparison can show whether devices remain consistent, but it does not replace formal calibration.
Manage Calibration and Recalibration
Cleaning removes dirt. Calibration checks the relationship between the device signal and the quantity being measured.
IEC 60904-4:2019 covers procedures for establishing calibration traceability of PV reference devices to SI units and includes working references in the traceability chain.[8]
A calibration certificate should identify:
l Device type and serial number
l Calibration date and value
l Test method and reference conditions
l Measurement uncertainty
l Temperature coefficients
l Traceability
l Laboratory information
Also check whether the calibration applies to short-circuit current, maximum power, or another operating point; the applicable temperature and irradiance; the spectral conditions; and any stated limits.
When entering a calibration factor, check the decimal position, units, sign, logger channel, shunt value, and temperature-correction setting.
There is no universal recalibration interval for every reference device. NIST states that the interval should depend on accuracy requirements, contracts or regulations, device stability, environmental exposure, and measurement-assurance data.[9]
Use the manufacturer's recommendation and project quality plan as the starting point. Shorten the interval after impact, repair, moisture entry, repeated transport, unstable output, or disagreement with a check reference. Extend it only when recorded comparison and calibration history show that the device remains stable.
Use a Separate Check Module
A check module is a stable second device used to test the operational reference. It may be stored indoors and brought out for scheduled comparisons.
For two clean irradiance references:
l 1. Clean both devices.
l 2. Mount them in the same plane.
l 3. Remove local shade.
l 4. Connect them to verified channels.
l 5. Allow the conditions to stabilize.
l 6. Compare synchronized averages.
l 7. Apply approved temperature correction.
l 8. Record the ratio.
Do not clean a soiled or array-representative device just to perform a comparison. Use a separate clean check device or follow the approved reset procedure.
Example ratio history:
l January: 1.003
l April: 1.005
l July: 1.004
l October: 0.972
The average of the first three ratios is 1.004. The October result of 0.972 is approximately 3.2% lower:
(1.004 − 0.972) ÷ 1.004 × 100% = approximately 3.2%
This change should trigger checks of cleanliness, alignment, wiring, logger settings, temperature correction, and calibration. It is an example, not a universal rejection limit.
Calculate Soiling Ratio Correctly
A paired soiling system compares matched clean and soiled devices under the same conditions.
Soiling ratio = Corrected output of soiled device ÷ Corrected output of clean device
If the soiled device produces 9.4 A and the clean device produces 10.0 A:
Soiling ratio = 9.4 ÷ 10.0 = 0.94
Soiling loss = 1 − 0.94 = 0.06, or 6%
The calculation is valid only when the devices have matching technology, equal tilt and direction, synchronized sampling, comparable temperature, suitable calibration, no partial shade, correct logger settings, and a genuinely clean reference.
Soiling Ratio | Estimated Loss Under the Comparison Conditions |
0.99 | 1% |
0.97 | 3% |
0.95 | 5% |
0.90 | 10% |
These values describe the comparison between the two reference devices at that time. They do not automatically equal the annual energy loss of the whole plant.
NREL reports annual soiling loss using an insolation-weighted soiling ratio. Under that method, a ratio of 0.95 represents an estimated 5% annual energy loss from soiling.[10]
Keep separate records for instantaneous soiling ratio, daily ratio, soiling rate, annual weighted ratio, estimated system loss, and measured plant energy loss.
Handle Snow-Affected Data Carefully
Snow may cause full coverage, partial coverage, frost, ice, meltwater, or refrozen deposits. Do not label every snow-affected reading as a sensor failure.
If the reference is cleared while the array remains covered, it may still measure available sunlight but no longer represents the array surface.
If both are covered, the reference represents the array only when its snow coverage and melting behavior are similar. A small reference device may clear much faster than a full-size module.
Use data flags such as:
l Fully covered
l Partly covered
l Manually cleared
l Naturally cleared
l Iced
l Frosted
l Condition unknown
Do not use metal tools to remove ice. After clearing, inspect the lower frame for trapped dirt, water, ice, and debris.
Store and Transport Portable References Properly
Store portable and laboratory devices indoors, dry, clean, properly supported, away from chemicals and direct sunlight, and inside a protective case.
Protect dry connectors with approved caps. Do not seal wet connectors in airtight packaging.
When a cold device is moved into warm, humid air, allow condensation to clear before use.
For transport, use a rigid case with edge protection, glass clearance, shock absorption, moisture control, secure cable storage, and clear identification.
After transport, inspect the glass, frame, junction box, connectors, temperature sensor, label, and electrical output. Compare the device with a check reference before an important measurement.
Keep Raw Data and a Complete Change Record
Do not overwrite original raw data.
Record:
l Device identity, location, and purpose
l Calibration status
l Cleaning and inspection results
l Photographs
l Repairs and component changes
l Data gaps and weather events
l Comparison results
l Technician name
l Software, firmware, scaling, unit, and channel changes
l Time-setting and alarm-limit changes
Record the exact time when the module, calibration factor, temperature sensor, cable, shunt, logger, mounting angle, or software calculation changes.
Use data-quality flags such as valid, limited, suspect, invalid, corrected, estimated, and missing.
For corrected data, retain the original value, corrected value, method, software version, calibration-factor version, and approval record. Estimated data should never be presented as direct measurements.
Set Alarm Limits from Real Site Data
Alarm limits should be based on project accuracy needs, device uncertainty, and known-good historical data.
Useful alarms include:
l Missing data
l Abnormal nighttime offset
l Unexpected reference disagreement
l Temperature disagreement
l Sudden change after maintenance
l Recalibration due
l Flat output during changing weather
l Unusual signal noise
Do not use one limit for clear midday conditions, sunrise, clouds, low irradiance, tracker movement, and snow.
A single unusual sample should not always create a maintenance order. For example, a project may require an abnormal difference to continue for three consecutive samples or at least 10 minutes before an alarm is issued. This is an example; the final setting should match the sampling rate, weather, sensor type, and project risk.
Each alarm should define the trigger, required duration, priority, responsible person, response time, inspection action, closure evidence, and data-quality action.
Remove or Quarantine an Unreliable Device
Remove or quarantine a reference device when:
l Calibration traceability cannot be shown
l The glass is cracked
l Moisture has entered
l The output is unstable
l The frame is badly distorted
l The junction box is loose
l The temperature sensor cannot be secured
l The required surface condition cannot be restored
l The device repeatedly fails comparison tests
l Electrical safety is uncertain
Before replacing it, check the surface, alignment, shading, temperature sensor, cables, connectors, shunt, logger channel, software factor, and module condition. The fault may be elsewhere in the measurement chain.
Record the reason for quarantine, removal time, last known valid data, suspected failure start, physical condition, electrical condition, storage location, investigation status, and final decision.
Verify the Device Before Returning It to Service
Use a formal return-to-service check after repair, rewiring, recalibration, transport damage, sensor replacement, logger replacement, or quarantine.
l 1. Confirm the device and serial number.
l 2. Check installation, tilt, direction, and shading.
l 3. Check cables and connectors.
l 4. Confirm the temperature-sensor position.
l 5. Confirm the logger channel.
l 6. Check the raw signal, units, and scaling.
l 7. Confirm the calibration factor.
l 8. Confirm that temperature correction is applied once.
l 9. Check timestamps.
l 10. Compare with an independent reference.
l 11. Review stable-sun performance.
l 12. Record approval and return-to-service time.
If the device returns during daylight, check its nighttime offset during the next night period.
Follow a Practical Maintenance Schedule
Frequency | Main Checks |
Daily | Missing data, flat signals, nighttime offset, temperature errors, reference disagreement, communication, timestamps, sudden steps, and impossible daytime values |
Weekly at high-risk sites | Surface cleanliness, bird fouling, new shading, rain and dust events, cleaning records, and clean-versus-soiled ratio |
Monthly | Glass, frame, drainage, cables, connectors, temperature sensor, reference ratios, labels, raw data, and converted values |
Quarterly | Tilt, direction, independent comparison, rear surface, alarms, calibration records, long-term trends, structures, and vegetation |
Yearly | Recalibration review, complete measurement-chain test, mounting hardware, long-term drift, uncertainty record, software calculations, and device suitability |
After an event | Inspect after dust storms, hail, high winds, flooding, snow, lightning faults, tracker failure, cable work, logger replacement, transport, impact, construction, animal damage, grounding work, or software changes |