Monocrystalline Solar Panels vs. Polycrystalline | Which is Right for Your Home
For homes with limited roof space, monocrystalline panels are superior, offering 20-22% efficiency for maximum power in a compact area.
While polycrystalline panels (15-17% efficiency) are more budget-friendly, the choice ultimately balances your upfront budget against long-term energy output per square foot.
Efficiency
Monocrystalline solar panels typically have a conversion efficiency that is 3 to 5 percentage points higher than polycrystalline panels.
Currently, the efficiency range for mainstream residential monocrystalline panels is between 20% and 23%, while polycrystalline panels range from 17% to 20%.
This efficiency difference directly translates to a power generation advantage of approximately 30 to 50 watts per square meter of roof area.
Efficiency Difference
Why is Monocrystalline Silicon More Efficient?
The root of the efficiency difference lies in the atomic arrangement of the silicon.
l Monocrystalline Silicon consists of a single, continuous crystal with a perfectly ordered internal atomic structure. This structure allows photons (the energy units of sunlight) to transfer their energy to silicon atoms more easily, exciting electrons to form an electric current.
l Polycrystalline Silicon is formed by melting and solidifying many small monocrystalline silicon grains, resulting in an internal structure full of grain boundaries. Imagine a large block of ice made by sticking together countless small ice cubes.
Specific Data Comparison
This structural difference is directly reflected in hard data:
l Mainstream Efficiency Range: Currently, high-quality monocrystalline solar panels suitable for residential use generally have efficiencies between 20% and 23%. In contrast, the efficiency of polycrystalline solar panels mostly falls in the range of 17% to 20%.
l High-End Technology Gap: Monocrystalline panels using cutting-edge technologies like N-type TOPCon or HJT can even achieve laboratory efficiencies above 24%. Polycrystalline technology has seen relatively slow efficiency improvements in recent years, and even high-end products rarely stably break the 20% efficiency threshold.
l Power per Unit Area: The efficiency difference directly translates into a difference in power generation capacity per square meter of roof area. A standard monocrystalline panel (about 1.6 square meters) typically has a power rating between 400W and 450W. A polycrystalline panel of the same area might only have a power rating of 320W to 380W. On the same size roof, installing monocrystalline panels can result in a total system power that is about 15%-20% higher.
How This Efficiency Gap Manifests on Your Actual Roof
Efficiency numbers are not just theoretical advantages; they directly impact the power generation performance and space utilization of your home solar system.
1. Roof Space Equals Generation Potential
For most households, the available roof area is fixed and limited. The advantage of high-efficiency panels is that they generate the most electricity in the smallest space.
l Scenario Comparison: Suppose you need to install a 6-kilowatt (kW) solar system.
l Using monocrystalline panels with 21% efficiency (about 415W per panel), you would need about 15 panels. This occupies about 24 square meters of roof area.
l Using polycrystalline panels with 18% efficiency (about 350W per panel), you would need about 18 panels. This occupies about 29 square meters of roof area.
l Conclusion: If your roof area is small, irregularly shaped, or has obstacles like skylights or chimneys, monocrystalline panels are the only choice to achieve your expected power generation target.
2. Performance in Hot Weather
All solar panels are affected by heat. As the temperature rises, their output power decreases. The rate of this decrease is measured by the "Temperature Coefficient," usually expressed in %/°C.
l Typical Data: The temperature coefficient for monocrystalline panels is typically between -0.30% and -0.35%/°C, while for polycrystalline panels it might be slightly higher, between -0.35% and -0.40%/°C.
l Practical Impact: On a hot summer day with an air temperature of 35°C, the panel surface temperature might reach above 50°C. Compared to the standard test condition of 25°C, the power drop of a monocrystalline panel would be about 2-3% less than that of a polycrystalline panel.
3. Do They Still Generate Power on Cloudy Days and During Morning/Evening?
Solar panels can still work when sunlight is not direct; this is their low-light performance. Because monocrystalline silicon is purer and has lower internal resistance, its performance under low-light conditions is usually better than that of polycrystalline silicon.
Practical Effect: During early morning, evening, cloudy, or lightly hazy weather, a monocrystalline panel system can start generating power earlier, stop later, and maintain a relatively higher voltage throughout the process.
Long-Term Use Stability
Efficiency considerations are not only about the initial value but also the rate of degradation over time.
l First-Year Degradation: For qualified solar panels, the efficiency degradation in the first year is slightly higher. Monocrystalline panels typically degrade no more than 1% in the first year, while polycrystalline panels might be slightly higher but still within a reasonable range of 1-1.5%.
l Linear Degradation: From the second year onwards, the annual degradation rate for high-quality panels usually stabilizes between 0.4% and 0.6%. After 25-30 years, a well-maintained system can still maintain over 85% of its initial power generation capacity.
Efficiency Comparison
How Material Structure Affects Efficiency
The root of the efficiency difference lies in the atomic arrangement of the silicon material.
Monocrystalline silicon consists of a single, continuous crystal with a completely ordered internal atomic structure.
This structure allows photons to excite electrons more effectively, and electrons encounter less resistance when flowing.
Polycrystalline silicon is composed of numerous tiny silicon crystals combined together.
The boundaries between these grains act as obstacles to electron flow, causing some energy to be lost as heat during the process.
Laboratory tests show that the theoretical photoelectric conversion efficiency limit for monocrystalline silicon is about 29%, while commercial products have already achieved efficiencies above 24%.
The theoretical limit for polycrystalline silicon is relatively lower, with commercial product efficiencies typically below 20%.
Specific Performance Data Comparison
Looking at actual products, the efficiency difference is reflected in multiple dimensions:
l Under Standard Test Conditions, the efficiency range for mainstream monocrystalline modules is 20%-23%, while for polycrystalline modules it is 17%-20%.
l Monocrystalline modules using Passivated Emitter and Rear Cell (PERC) technology can further improve efficiency by 0.5-1 percentage points.
l Regarding the temperature coefficient, monocrystalline modules are typically -0.3%/°C to -0.35%/°C, while polycrystalline modules are -0.4%/°C to -0.45%/°C.
l Under low-light conditions, the power generation efficiency degradation of monocrystalline modules is 3-5 percentage points lower than that of polycrystalline modules.
Actual Power Generation Performance Difference
The efficiency difference translates into an actual energy yield gap. Taking the example of installing solar panels on a typical residential roof of 30 square meters:
l Using monocrystalline modules with 22% efficiency, the system's peak power can reach 6 kilowatts.
l Using polycrystalline modules with 18% efficiency, the system's peak power is about 5 kilowatts.
l Under the same lighting conditions, the daily average energy generation of the monocrystalline system will be 15-20% higher than that of the polycrystalline system.
This difference is particularly evident in space-constrained sites. When the installation area is fixed, high-efficiency modules can maximize the use of limited space.
For projects that need to achieve specific power generation targets, using high-efficiency modules can reduce the number of installations, lowering the Balance of System costs such as mounting structures and cables.
Performance Under Different Environmental Conditions
Environmental factors have a significant impact on actual power generation efficiency:
Rising temperatures cause the efficiency of all types of modules to decrease, but the extent of the decrease varies.
At an ambient temperature of 45°C, the power output of monocrystalline modules is typically 12% lower than under standard test conditions, while polycrystalline modules may be more than 15% lower.
The impact of shading also differs. Because monocrystalline modules typically use full-cell design, the impact of local shading on the overall system output is relatively small.
Polycrystalline modules using half-cell technology can also improve shading resistance.
Long-Term Performance Degradation
The efficiency of solar panels slowly decreases over time:
l First-year degradation: Monocrystalline modules about 1-1.5%, Polycrystalline modules 1.5-2%
l Annual stable degradation: Thereafter about 0.4-0.6% per year
l 25-year output guarantee: Reliable modules typically guarantee that they can maintain more than 85% of their initial power after 25 years.
The degradation rate is closely related to material quality, production process, and operating environment.
Modules that use better encapsulation materials and superior cell processes, whether monocrystalline or polycrystalline, can exhibit more stable long-term performance.
Cost-Effectiveness Considerations
The efficiency difference needs to be evaluated comprehensively in combination with cost:
l High-efficiency modules are usually more expensive, with a cost per watt potentially 5-10% higher.
l However, in projects with fixed installation costs, high-efficiency modules can save on balance of system costs.
l For space-limited projects, the energy yield gain from high-efficiency modules often offsets the difference in initial investment.
Impact
Efficiency differences directly affect the system's initial investment cost.
High-efficiency monocrystalline panels typically cost 5%-8% more per watt than polycrystalline panels, but they can achieve a larger installed capacity in a limited area.
Taking a 30-square-meter roof as an example, installing monocrystalline panels with 22% efficiency can generate about 20% more electricity than polycrystalline panels with 18% efficiency, increasing the power generation revenue per square meter of roof by about 15 cents per day.
Impact on System Design
Efficiency differences change the entire system design scheme. When using high-efficiency modules, inverter selection can be better matched to the actual output.
For example, a 6kW system might require only 16-18 high-efficiency monocrystalline panels, whereas polycrystalline panels might require 20-22 panels.
This results in a 15% reduction in the weight of the mounting structure, a 12% reduction in cable usage, and a saving of about 3 hours in installation time.
The impact of shading is amplified by efficiency characteristics.
Tests show that when 10% of the area is shaded, the power generation of a monocrystalline system decreases by about 25%, while a polycrystalline system may decrease by more than 30%.
Changes in Power Generation Revenue
Efficiency differences directly translate into energy yield gaps. In a region with 1200 equivalent full-load hours per year, a 1% increase in efficiency for a 6kW system can increase annual energy generation by about 72 kWh.
Calculated at an electricity price of $0.15/kWh, over a 25-year lifecycle, a monocrystalline system with a 4% efficiency advantage can generate about $4,300 more in electricity revenue compared to a polycrystalline system.
Temperature characteristics also change actual revenue. During summer high temperatures, roof temperatures can reach 60°C.
At this time, the power degradation of monocrystalline panels is typically 2-3 percentage points lower than that of polycrystalline panels.
During peak electricity consumption seasons, high-efficiency systems can maintain more stable output.
Long-Term Impact of Maintenance Costs
The efficiency degradation rate affects long-term returns. Quality-certified monocrystalline panels typically have first-year degradation controlled within 1%, while polycrystalline panels are around 1.5%.
After 10 years, a monocrystalline system can still maintain over 92% of its initial power, while a polycrystalline system may drop below 90%.
This difference will cause the annual power generation revenue gap to widen to 5%-7% starting from the 11th year.
The frequency of cleaning and maintenance is also affected by efficiency characteristics.
Because high-efficiency panels are more sensitive to contamination, the power loss caused by dust accumulation may be 0.5%/day higher than that of standard panels.
This requires users to increase the cleaning frequency by 10%-15% to ensure optimal performance.
Special Considerations for Grid-Tied Systems
For residential systems that need to be grid-connected, efficiency selection affects the grid-connection plan.
High-efficiency systems more easily meet the power factor standards required by the grid and exhibit more stable grid-connection characteristics during voltage fluctuations.
Measured data shows that the power factor fluctuation range of monocrystalline systems is typically 0.02-0.03 narrower than that of polycrystalline systems.
Inverter matching is also affected by efficiency characteristics. High-efficiency panels have a wider operating voltage range, allowing the inverter to operate in its optimal efficiency range over 90% of the time.
Whereas standard efficiency panels may cause the inverter to start early/shut down late during morning and evening periods, increasing the system's own energy consumption by about 1%-2%.
Adaptability to Installation Environment
Performance differences under different climatic conditions are significant. In hot regions, high-temperature environments further amplify the efficiency difference.
When the ambient temperature exceeds 35°C, the relative efficiency advantage of monocrystalline systems increases by 1-2 percentage points compared to standard conditions.
In cold regions, while low temperatures help improve power generation efficiency, they weaken the efficiency gap between different technology routes.
The impact is more significant when the roof orientation is not optimal.
When the installation tilt angle deviates from the optimal angle by 15 degrees, a high-efficiency system can still maintain over 85% of its theoretical output, while a standard system may only achieve 80%.
High-Temperature Performance
The power output of solar panels decreases as temperature increases, and the rate of degradation is quantified by the power temperature coefficient, which is typically a negative value (e.g., -0.35%/°C).
Monocrystalline silicon panels generally have a superior temperature coefficient, approximately -0.30% to -0.40%/°C, while polycrystalline panels are typically in the range of -0.40% to -0.45%/°C.
In a high-temperature environment of 75°C, the relative power loss of monocrystalline panels can be 2-3% lower than that of polycrystalline panels.
For hot regions, this difference significantly impacts the system's long-term power generation revenue.
Power Temperature Coefficient
How exactly does this number work?
The power temperature coefficient is not an abstract concept; it directly determines your electricity bill.
It is defined as: the percentage change in a solar panel's output power relative to its rated power under Standard Test Conditions (25°C) for every 1 degree Celsius increase in the panel's temperature.
Understanding this coefficient requires breaking it down into three parts:
l Voltage is the main factor affected: When the temperature rises, the panel's open-circuit voltage (Voc) and maximum power point voltage (Vmp) decrease significantly.
l The coefficient is negative: Because it represents a "loss," it is always presented as a negative number. For example, -0.38%/°C.
l The calculation is linear: Within the normal operating temperature range (-40°C to +85°C), the power drop can be approximated as occurring linearly with temperature.
A specific calculation example: Suppose your home is in Texas, and a 400W panel on the roof reaches a surface temperature of 65°C. The temperature rise relative to standard conditions is 40°C.
l If it is a monocrystalline panel (temperature coefficient -0.35%/°C): Power loss = 40°C × (-0.35%/°C) = -14%. Actual output power ≈ 400W × (1 - 0.14) = 344W.
l If it is a polycrystalline panel (temperature coefficient -0.43%/°C): Power loss = 40°C × (-0.43%/°C) = -17.2%. Actual output power ≈ 400W × (1 - 0.172) = 331.2W.
On such a hot common afternoon, a single monocrystalline panel outputs about 13 watts more power than a polycrystalline panel.
For a system with 20 panels, the instantaneous power difference reaches 260 watts, equivalent to the power gap of running multiple high-performance electric fans simultaneously.
Three temperature coefficients hidden in the datasheet
Manufacturers' data sheets usually list three temperature coefficients, with the power temperature coefficient being the final comprehensive result:
1. Voltage Temperature Coefficient (typically about -0.28% to -0.35%/°C): The voltage drop is the main cause of power loss.
2. Current Temperature Coefficient (typically about +0.04% to +0.08%/°C): The current increases slightly with temperature, but its positive contribution to power is small.
3. Power Temperature Coefficient (the combined result of the above two): It most intuitively reflects the panel's overall performance in real-world environments.
How much do coefficients vary between brands and technologies?
Although monocrystalline technology is generally superior to polycrystalline, the differences between different manufacturers and product lines are very significant.
High-end brands can achieve better temperature coefficients through better materials and production processes.
Panel Type / Technology | Typical Power Temperature Coefficient Range | Example Representative Brand/Model (Approx. Coefficient Value) |
Monocrystalline PERC | -0.34% to -0.40%/°C | Canadian Solar HiKu Series (-0.35%/°C) |
Polycrystalline | -0.40% to -0.45%/°C | Older Standard Polycrystalline Panels (-0.43%/°C) |
N-type Monocrystalline (e.g., TOPCon) | -0.30% to -0.34%/°C | Jinko Solar Tiger Neo Series (-0.30%/°C) |
Heterojunction (HJT) | -0.24% to -0.27%/°C | Panasonic EVERVOLT Series (-0.26%/°C) |
N-type technologies (such as TOPCon, HJT), due to their temperature-insensitive physical properties, have significantly better temperature coefficients than traditional P-type monocrystalline and polycrystalline technologies.
How does it interact with another key indicator, "Nominal Operating Cell Temperature"?
The power temperature coefficient tells you the "slope" of the power decrease, while the Nominal Operating Cell Temperature (NOCT) tells you at what "starting point" temperature the panel operates.
NOCT simulates a more realistic operating environment: ambient temperature 20°C, wind speed 1m/s, irradiance 800W/m².
Under these conditions, the panel temperature typically reaches about 45°C.
A panel might have a decent temperature coefficient, but if its NOCT is high (e.g., 48°C), it means it heats up more easily and will still lose a lot of power in practical applications.
Therefore, the ideal situation is: a low power temperature coefficient and a low NOCT value (e.g., 42°C-45°C).
How does the installation method directly change the impact of the temperature coefficient?
The temperature coefficient is an inherent property of the panel, but the microclimate on your roof can change the degree of its impact. Reducing the panel's actual operating temperature is the most effective way to mitigate power loss.
l Roof Pitch and Ventilation: Compared to flush mounting (BIPV), using racks to elevate the panels by at least 4-6 inches, creating an air flow channel at the back, can reduce the panel operating temperature by 5°C-15°C. This is equivalent to improving the actual effect of a -0.40%/°C coefficient to near -0.34%/°C.
l Effect of Wind Speed: Studies show that when wind speed increases from 0m/s to 2m/s, the panel operating temperature can drop by more than 10°C.
l Roof Albedo: Panels installed on light-colored, high-reflectivity roofs will have a lower ambient temperature, helping to improve overall energy yield.
Monocrystalline vs. Polycrystalline
Efficiency Gap
The efficiency gap is the most intuitive comparison between the two. Let's look at data for mainstream consumer-grade products in 2023-2024:
Indicator | Monocrystalline Silicon Panel (PERC and above technologies) | Polycrystalline Silicon Panel |
Highest Lab Efficiency | 26.1% (LONGi HPDC) | 22.3% |
Mass-Produced Commercial Panel Efficiency Range | 22.5% - 24.5% | 19.5% - 21.0% |
Common Power Output (60-cell type) | 370W - 400W+ | 320W - 340W |
On a roof of the same size, you can install a higher-power monocrystalline system. For example:
Installing a monocrystalline system: 20 m² ÷ 1.6 m²/panel (panel area) × 390W/panel = Approximately 4.875 kW system
Installing a polycrystalline system: 20 m² ÷ 1.6 m²/panel (panel area) × 330W/panel = Approximately 4.125 kW system
Under the same sunlight conditions, the monocrystalline system can generate about 10%-15% more electricity annually.
For households with high annual electricity consumption, this gap is enough to affect the degree of electricity self-sufficiency.
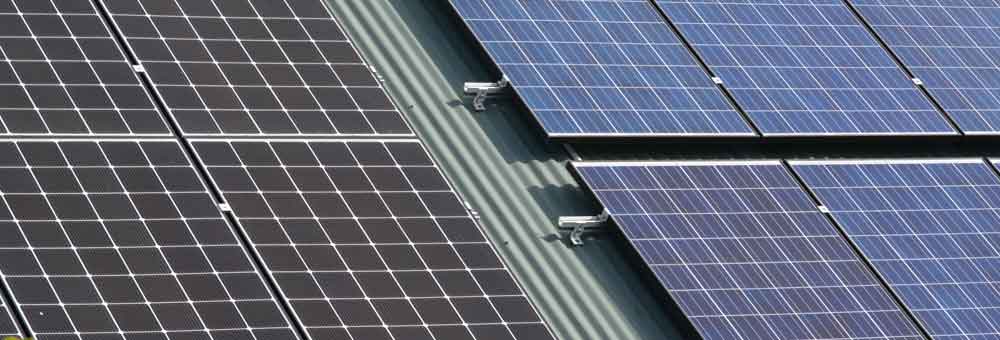
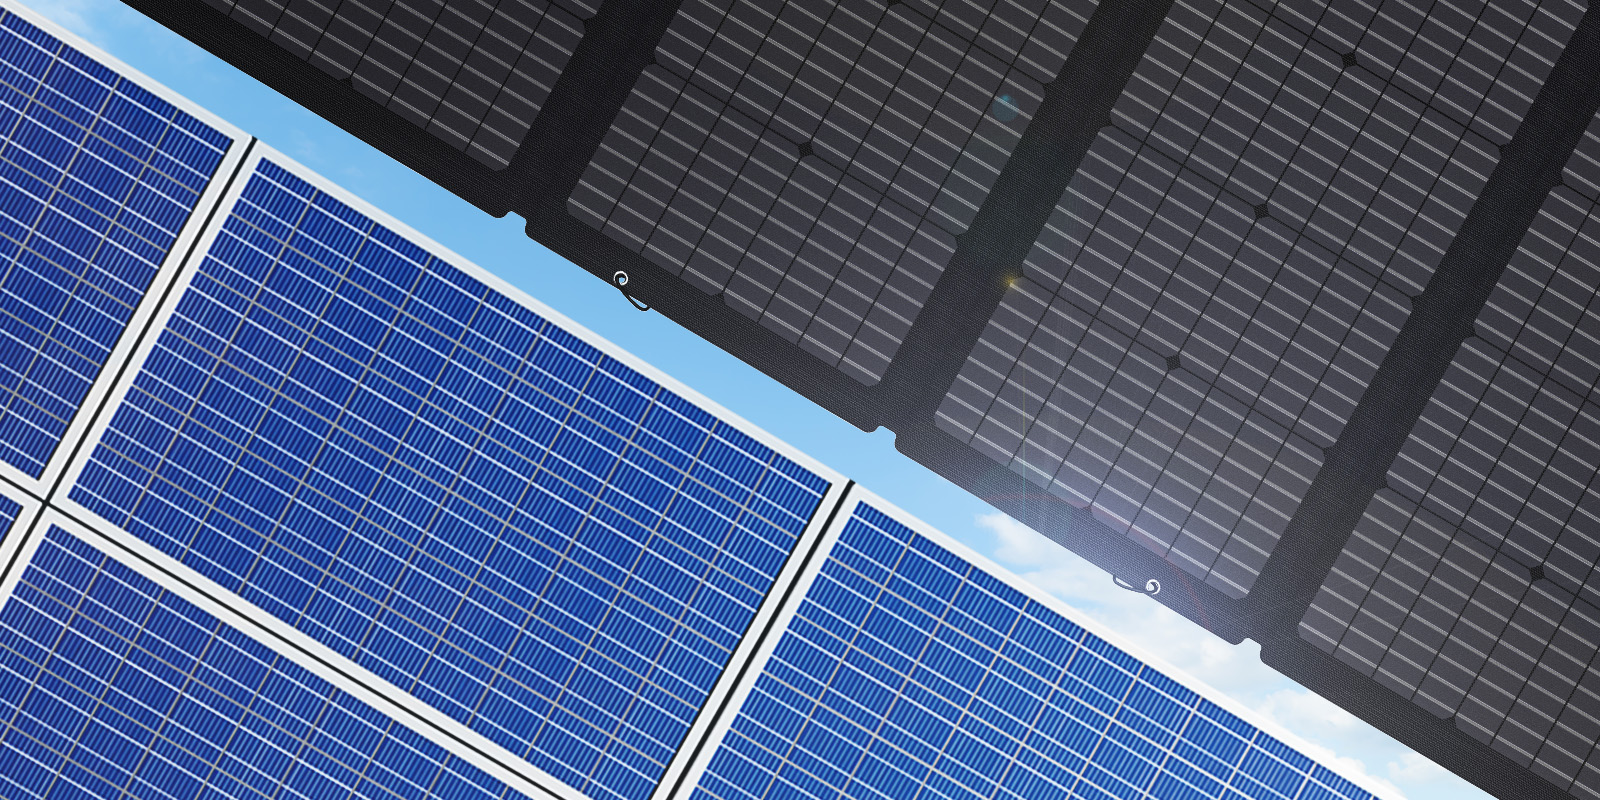
Appearance:
Even someone who has never been exposed to solar energy can easily distinguish the two:
l Monocrystalline Panels: The cells have a uniform color, usually pure black or dark blue, with strong appearance consistency.
l Polycrystalline Panels: The cells have irregular patterns inside, like ice flowers or shattered metal, appearing bright blue, and there may be color differences between different cells.
Long-Term Impact of Temperature Coefficient and Degradation Rate
l Temperature Coefficient: The power temperature coefficient of monocrystalline panels is generally between -0.34%/°C and -0.40%/°C, while that of polycrystalline panels is typically between -0.40%/°C and -0.45%/°C. In a high-temperature environment of 75°C, the power retention capability of monocrystalline panels is 2-3 percentage points higher than that of polycrystalline panels.
l Annual Degradation Rate: Monocrystalline panels, especially those using advanced technologies like PERC, typically have a first-year degradation of within 1%, and thereafter degrade about 0.4%-0.55% annually. Polycrystalline panels have a first-year degradation of 1%-1.5%, and thereafter degrade about 0.6%-0.7% annually. After a 25-year operating cycle, the end-of-life output power of a monocrystalline system is typically 3-5% higher than that of a polycrystalline system.
Evolution of Cost and Market Trends
Historically, polycrystalline panels dominated the market due to their lower production costs. But over the past decade, advances in monocrystalline crystal pulling technology and sharp cost reductions have significantly narrowed the price gap.
Currently, in the end-user retail market, the price difference between monocrystalline and polycrystalline panels of the same power grade may be only $0.05 to $0.10 per watt.
However, cost consideration must be based on the Levelized Cost of Energy (LCOE), which is the total system cost over its lifecycle divided by the total energy generated.
Because monocrystalline systems have higher efficiency and lower degradation, they can generate more electricity per unit area.
Therefore, although the initial unit price of monocrystalline panels may be slightly higher, their LCOE is in many cases lower than that of polycrystalline systems, offering better long-term investment value.
Application Scenario Selection Suggestions
l Prioritize monocrystalline in the following situations:
l The roof area is limited, and you want to maximize power generation in the limited space.
l Located in a hot region where high-temperature performance is an important consideration.
l Focus on the long-term reliability and power generation stability of the system.
l Have high requirements for building appearance.
l Polycrystalline may still be worth considering in the following situations:
l The budget is extremely tight, and the initial investment cost per watt is the only consideration.
l Have a large area of open land (e.g., ground-mounted power plant), and are not sensitive to space utilization.
l Located in temperate or cold regions, where the efficiency loss difference due to temperature is small.
Factors Affecting High Temperature
How do the panel's own physical properties affect heating?
The temperature of a solar panel during operation is mainly determined by its efficiency in converting sunlight into electricity.
Not all the light energy shining on the panel is converted into electricity; the unconverted portion is mainly dissipated as heat.
The material's bandgap is a starting point. The bandgap of crystalline silicon is about 1.1 electron volts (eV), which determines the range of the solar spectrum it can effectively utilize.
Photons with energy higher than the bandgap (mainly visible light and part of ultraviolet light) will excite electrons to generate electricity; while photons with lower energy (such as infrared light) cannot be effectively absorbed, directly passing through or being converted into heat.
The color and absorptance of the panel have a direct impact on temperature. Dark-colored objects absorb more light energy.
Traditional blue and black cells are both efficient light absorbers.
Studies have shown that under the same irradiation, the surface temperature of a black monocrystalline panel may be 30°C to 40°C higher than that of a light-colored roof.
Some emerging technologies are exploring selective light-absorbing coatings, aiming to optimize the absorption of the effective spectrum while reflecting ineffective infrared light, but from a commercial perspective, they have not yet been widely adopted.
The panel's encapsulation materials also play a role. The light transmittance of the glass, the thermal conductivity of the EVA (Ethylene-Vinyl Acetate copolymer) film, and the reflectivity and heat dissipation characteristics of the back sheet together constitute the panel's "thermal management system."
The decisive role of installation method on temperature
The installation method is the most important variable that homeowners can control, and its impact may even exceed the technical differences of the panels themselves.
Roof Mounting and Ventilation Gap
Installing solar panels directly flat on the roof (BIPV or flush mounting) is the worst way for heat dissipation.
It hinders air flow behind the panels, causing heat to accumulate in the narrow space between the panel and the roof.
In contrast, using racks to elevate the panels, leaving at least 4 inches (about 10 cm) of bottom ventilation gap, can create an effective "chimney effect": cold air enters from the bottom, hot air exits from the top.
Measured data shows that good ventilation can reduce the panel's operating temperature by 5°C to 15°C.
This is equivalent to improving the practical performance of a panel with a temperature coefficient of -0.40%/°C to a level close to -0.35%/°C or even better.
Installation Tilt and Azimuth Angle
The installation tilt angle not only affects light energy capture but also heat dissipation.
A tilt angle matching the local latitude, in addition to optimizing power generation, is also conducive to the rise and discharge of hot air.
The azimuth angle (panel orientation) determines the amount of irradiation the panel receives during the hottest part of the day (usually afternoon).
Panels facing true south receive the strongest irradiation at noon, while panels facing southwest bear the greatest pressure when temperatures are highest in the afternoon.
Roof Material and Color
Dark asphalt shingles or metal roofs absorb a large amount of solar radiation, becoming a huge heat source, heating the air above them, and thus indirectly increasing the operating temperature of the panels.
In contrast, light-colored, high-reflectivity roofs (such as white membrane structures or light-colored metal) can reflect more sunlight back into the atmosphere, significantly reducing the ambient temperature on the roof surface, creating a cooler microclimate for the panels.
Objective impact of environmental and climatic conditions
Ambient Air Temperature is the foundation. The operating temperature of a panel is typically about 25°C to 35°C higher than the ambient air temperature. If the ambient temperature is 35°C, the panel temperature can easily reach 60°C to 70°C. In desert areas like Arizona, it is common for panel temperatures to consistently exceed 75°C in summer.
Solar irradiance is the direct source of energy. 1000 watts per square meter irradiance (Standard Test Condition) is an ideal value. On a clear summer day, this value can easily be reached or even exceeded. The stronger the irradiance, the more heat the panel naturally generates.
Wind Speed and Direction are the free cooling systems provided by nature. Air flow carries away heat from the panel surface through convection. Studies show that when wind speed increases from 0 meters/second (calm) to 2 meters/second (light breeze), the panel's operating temperature can drop by 10°C to 15°C. In areas with persistent wind, the high-temperature performance loss of panels is effectively mitigated.
The effect of humidity is more complex. On one hand, higher humidity usually means the atmosphere contains more water vapor, which may have a slight scattering effect on sunlight. On the other hand, humid air has a higher heat capacity than dry air and can theoretically carry away more heat, but its actual cooling effect is usually far less significant than the effect of wind.
Subtle differences brought by system electrical design
Microinverters vs. String Inverters + Optimizers
The electrical structure of the system also affects local temperature. Micro inverters are installed directly on the back of each panel and generate heat during operation.
This heat is directly transferred to the corresponding panel, potentially raising its local temperature by a few degrees Celsius compared to a system using a central string inverter. Optimizers typically generate less heat than micro inverters.
Resistive Losses in the Circuit
When current flows through the cell, busbars, junction box, and cables, heat is generated due to resistance (I²R losses).
Although this heat is relatively small compared to solar radiation, it also contributes to the overall panel temperature.
Higher quality modules with lower resistance help reduce this self-generated heat.
Space Efficiency
When roof area is limited, monocrystalline silicon solar panels can generate 15-20% more electricity than polycrystalline silicon panels.
The standard conversion efficiency of monocrystalline panels is typically between 20-23%, while for polycrystalline panels it is 16-19%.
Per square meter of roof area, the power output (watts per square meter) of monocrystalline panels is significantly higher.
Efficiency Gap
The 3-4 percentage point efficiency gap between monocrystalline and polycrystalline solar panels is significantly amplified in practical applications.
For example, a 10-kilowatt system might require only 26 panels with a monocrystalline solution, while a polycrystalline solution might require 32 or more panels.
This not only occupies more roof space but also increases installation material and labor costs.
Why do monocrystalline panels have higher electrical output?
The fundamental reason lies in the atomic arrangement of the silicon material.
l Monocrystalline Silicon has an atomic structure that is a perfect, continuous, and uniformly oriented crystal lattice. This provides a "highway" for photogenerated electrons; electrons encounter very little resistance (recombination) as they pass through the material, allowing them to be collected as current more efficiently.
l Polycrystalline Silicon is formed by fusing many different silicon crystal fragments together, resulting in numerous "grain boundaries" inside. These grain boundaries act like "intersections and toll booths" on the electron path, hindering and scattering electrons, causing some electrons to be lost as heat during movement rather than being converted into electricity.
This difference in material physics directly determines their different efficiency ceilings.
The laboratory efficiency record for monocrystalline technology has exceeded 26%, while the theoretical limit for polycrystalline technology is around 20%.
The efficiency gap in commercial products is a true reflection of this physical limitation.
How does the efficiency gap affect actual power output?
Let's look not at theoretical percentages, but at the most direct indicator: the power output per panel.
Characteristic | Current Mainstream Monocrystalline Panel (e.g., N-type TOPCon) | Mainstream Polycrystalline Panel |
Rated Power per Panel | 420W - 450W | 330W - 350W |
Temperature Coefficient (Power) | -0.34% / °C | -0.39% / C |
At 25°C Standard Conditions | Baseline of 430W | Baseline of 340W |
At 35°C Actual Operating Temperature | 430W × [1 - (10°C × 0.34%)] = 415W | 340W × [1 - (10°C × 0.39%)] = 327W |
Two key points can be seen from the table:
1. Initial Power Gap: Under standard conditions, the monocrystalline panel has about 90W higher power than the polycrystalline panel (430W vs 340W).
2. Gap Widens at High Temperatures: Solar panels operate at high temperatures in the real world. Because monocrystalline panels typically have a better temperature coefficient (power decreases more slowly as temperature rises), the power gap widens from 90W to about 88W (415W vs 327W) in actual hot weather.
The long-term energy yield gap accumulates
The efficiency gap is reflected not only in peak power but also in the total energy generated day after day.
l Assume a roof can only accommodate 20 panels.
l Using the high-efficiency monocrystalline panels mentioned above, the total system power is: 20 × 430W = 8.6 kW
l Using polycrystalline panels, the total system power is: 20 × 340W = 6.8 kW
l The initial system power gap between the two is: 1.8 kW
In a region with an insolation of 1500 kilowatt-hours per kilowatt per year, the annual energy yield gap for this system is:
l Monocrystalline system: 8.6 kW × 1500 kWh/kW = 12,900 kWh
l Polycrystalline system: 6.8 kW × 1500 kWh/kW = 10,200 kWh
l Annual energy yield gap: 2,700 kWh
Over a 25-year system lifespan, solely due to the initial efficiency gap, the monocrystalline system will generate about 67,500 kWh more electricity than the polycrystalline system.
This is enough to power an electric vehicle for over 270,000 kilometers.
Efficiency is the deciding factor under limited area
When roof area is a fixed constraint, choosing higher efficiency modules is the only way to maximize asset value.
Scenario: A carport roof with an available area of 15 square meters needs solar panel installation.
Calculation: The area of each standard panel is about 2 square meters.
l Maximum capacity of the area: 15 m² / 2 m²/panel ≈ 7.5 panels (practically install 7 panels)
l Total power of 7 monocrystalline panels: 7 × 430W = 3.0 kW
l Total power of 7 polycrystalline panels: 7 × 340W = 2.38 kW
Result: Under this hard area constraint, the monocrystalline solution directly provides an additional 0.62 kW of generation capacity.
Prioritize space efficiency
Calculation from efficiency to actual energy yield
The efficiency percentage itself is abstract; we need to convert it into specific energy yield to calculate value. Assume a region with an annual peak sun hours of 1500 hours, installing a 6-kilowatt system.
l Using high-efficiency monocrystalline panels: Might require installing 15 panels of 400 watts each (15 * 400W = 6,000W).
l Using polycrystalline panels: To achieve the same 6 kW total power, might require installing 20 panels of 300 watts each (20 * 300W = 6,000W).
However, if the available roof area can only accommodate 15 panels, the situation is completely different.
l The monocrystalline solution can successfully achieve the 6 kW installation target.
l The polycrystalline solution can install at most 15 panels, with a total power of 4.5 kW (15 * 300W).
l In this case, due to space constraints, the actual generation capacity of the two solutions differs by 1.5 kW. Calculated at 1500 hours of sunshine per year, the monocrystalline system can generate about 2250 kWh more electricity annually. At a local electricity price of $0.20 per kWh, the monocrystalline system can save about $450 more on electricity bills each year.
Impact of different roof types on space utilization
The type of roof directly affects the layout and number of solar panels.
l Pitched Roof: Common tile or asphalt shingle roofs require consideration of reserved access pathways and avoiding obstacles like ridges during installation. Efficient panels maximize the use of every contiguous available area.
l Flat Roof: Panels need to be installed on racks with a certain tilt angle, and spacing must be left between rows to prevent shading.
Impact on Balance of System Costs
A solar system includes not only panels but also inverters, racks, cables, and other modules, collectively known as the Balance of System.
l Installing 20 panels compared to 15 panels requires longer rails, more brackets, and connectors.
l Installing more panels may also require more complex wiring and may necessitate upgrading the inverter model if a certain power threshold is exceeded.
l These factors increase material and labor costs. Therefore, choosing fewer, more efficient panels usually reduces the overall system installation cost.