How Do You Check If Your Solar Panels Are Still Working Well | Output, Damage, Inverter Status
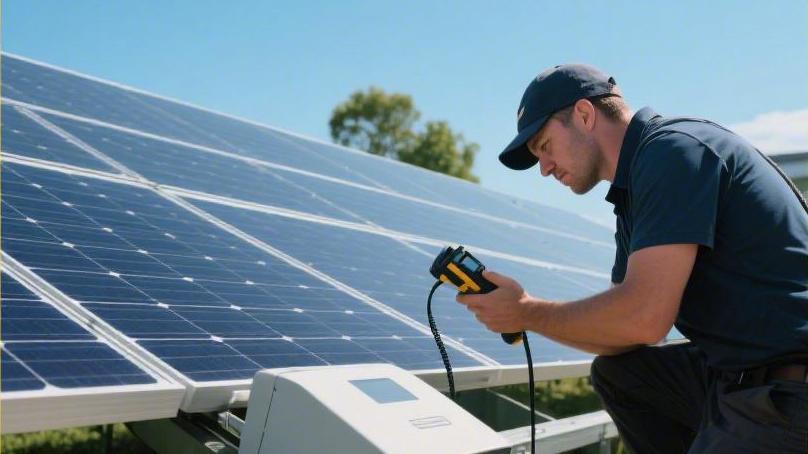
Check the power through the APP; it should reach more than 80% of the rated power on a sunny day;
Visually check for hot spots and cracks, and confirm the inverter green light is steady on.
If the monthly power generation drops by more than 10%, it is necessary to troubleshoot shading or faults to ensure the output reaches the standard.
Output
Read the data
The first step in evaluating solar panel output performance is learning to read the real-time power (kW) and cumulative energy generation (kWh) provided by the monitoring system. Power represents the system's ability to convert sunlight at the current moment, while energy generation is the accumulation of energy over a period of time. For a standard 5kW system, at noon on a sunny day, its actual output power usually reaches between 3.8kW and 4.2kW. This is because there are inverter conversion efficiency losses, line resistance losses, and power attenuation due to the temperature rise of the panels during the conversion process. If your system's output power at noon on a sunny day is continuously lower than 60% of the installed capacity, and there is no obvious shadow blocking, further hardware status checks are needed.
Monitoring software usually provides daily, monthly, and annual power generation curves. A healthy power generation curve on a sunny day should appear as a smooth bell shape.
l The curve rises steadily in the morning, reaches its peak at noon, and descends steadily in the afternoon.
l If sudden deep pits or violent fluctuations appear on the curve, it indicates that intermittent shading or inverter restarts may exist.
l If the curve becomes flat at noon (i.e., clipping phenomenon), it is usually caused by the inverter capacity being smaller than the panel capacity, which is a normal operating phenomenon in systems with high configuration ratios.
Compare with previous years
Comparing current power generation data with the same period last year is an effective means to determine if efficiency has declined. Solar panels usually have a natural annual degradation rate, with the industry standard generally between 0.5% and 0.8%. For a system that has run for five years, it is completely reasonable for its power generation capacity to be about 3% lower than when it was first installed. Download historical monthly reports through the monitoring app and observe the cumulative total electricity for the same month. If this March's power generation is more than 15% lower than last March's, and the sunshine duration recorded by the local meteorological bureau has not significantly shortened, then internal system issues like diode damage or failure of some cell pieces due to hot spot effects may have occurred.
Environmental factors have a huge impact on comparison results and need to be viewed in combination with specific precipitation and light data.
l Long-term drought will lead to a large accumulation of dust or industrial powder on the panel surface, which may cause a 5% to 10% power generation loss.
l Continuous rainfall, although reducing light, can play a role in cleaning the panels, and the performance on subsequent sunny days is often better.
l When comparing data, focus on the average daily power generation per kilowatt of installed capacity per month, which reflects the true health status of the panels better than looking at the total number.
Calculate the ratio
Calculating the system's "generation ratio" can help you understand output efficiency more intuitively. A simple and universal formula is: average daily power generation (kWh) divided by system installed capacity (kW). In areas with good sunshine resources, this value is usually between 3.5 and 5. For example, if your 6 kW system generated 24 kWh on a certain day, then the ratio is 4, which indicates the system is in a very ideal working state. If this value is consistently lower than 2.5, excluding weather factors, the system may have serious problems, such as a specific string being disconnected or a fuse being blown.
In complex calculations, technicians will refer to the Performance Ratio (PR).
l Performance Ratio considers actual irradiance, panel tilt angle, and ambient temperature.
l The performance ratio of most residential systems should be between 75% and 85%.
l The lost 15-25% of energy is consumed by inverter efficiency (about 3-5%), DC/AC line losses (about 2-3%), as well as panel soiling and temperature effects.
Look at the weather
Temperature is an easily overlooked factor affecting solar panel output. Most panels' rated power is measured under Standard Test Conditions at 25°C. In reality, when sunlight hits the panels, their surface temperature often rises to 50°C or even higher. Every panel has a "power temperature coefficient," usually around -0.3% / °C to -0.5% / °C. For every 1°C increase in panel temperature, the output power will drop by the corresponding proportion. If you find the system output is not as much during the sweltering season as on cool sunny days, this belongs to physical characteristics rather than equipment failure.
Low output caused by insufficient light intensity needs to be distinguished from hardware failure.
l Under completely cloudy weather, the panel's output may only be 10% to 20% of the rated power.
l Due to the spectrum absorption characteristics of panels, even in the early morning or evening, although the light looks bright, the power generation efficiency will still drop significantly because the proportion of infrared rays is higher.
l Check if newly added buildings, utility poles, or neighbors' trees are blocking parts of the panels at specific times; even if only one cell unit is blocked, it may cause the entire string's output to drop by more than 30% through circuit effects.
Watch the electricity bill
The "surplus electricity online" or "sent back to the grid" electricity data on the electricity bill is the second source of information to verify the accuracy of monitoring data. If your monitoring app shows normal power generation, but the electricity sale income on the electricity bill is greatly reduced, or the amount of electricity bought from the grid increases abnormally, the monitoring transformer installation position offset has led to reading errors, or there are high-power appliances in the home with leakage or long-term standby. Regularly compare the readings on the meter with the readings on the monitoring software; an error between the two within 2% to 5% is reasonable.
Understanding the settlement logic of Net Metering is very helpful for analyzing output performance.
l The meter records your system's power generation minus the home's real-time consumption.
l If high-power washing machines or dishwashers are used at noon, the electricity sent back to the grid will naturally decrease.
l By observing the current direction arrow on the meter, you can confirm in real-time whether the system is supplying power to the grid, thereby judging whether the inverter is synchronizing normally.
Identify the deviation
When you find an imbalance in output between multiple strings, usually a specific area has a problem. Many modern inverters or optimizers allow you to view the independent voltage and current of each panel or each string. Under the same light conditions, the current (A) within the same string should be basically consistent. If the first string's current is 8A and the second string's is only 4A, then the second string very likely has panel damage, poor connector contact, or serious local shading. Abnormal fluctuations in voltage (V) often point to a logic failure in the inverter's Maximum Power Point Tracker (MPPT).
Recording and analyzing abnormal data can provide a basis for subsequent professional maintenance and avoid blind inspections.
l Low voltage and high current usually indicate short-circuit risks.
l High voltage and zero current represent an open-circuit state, possibly a plug falling off.
l Record the time period when the fault occurs, such as whether it always appears after rain, which helps determine if the system has an issue with low insulation resistance.
l By long-term observation of these subtle data deviations, you can arrange for maintenance personnel to arrive in advance before the system completely crashes.
Damage
Glass is broken
Physical damage to appearance is the first step to intuitively judge the health of solar panels; cracks on the glass surface are usually caused by extreme weather or external force impact. The tempered glass layer serves as a barrier protecting the internal cells; once spider-web-like shattering or fine radial cracks appear, moisture and oxygen will seep into the backplate along the gaps. After water vapor from the air enters, it will oxidize the internal busbars and metal grid lines, causing the originally silvery-white conductive paths to turn rust-brown. This oxidation process significantly increases resistance, causing the damaged area to generate a large amount of heat. Data research shows that panels with obvious cracks, after one year of operation, usually see their output power drop by 15% to 30%, and this damage is irreversible.
Severe physical damage also leads to a decrease in insulation resistance value, which is particularly obvious in humid weather or when there is more dew in the morning. The inverter will automatically monitor the system's ground insulation state; if it detects leakage current exceeding the safety threshold (usually 50mA to 100mA), the system will automatically cut off the power and report an error for safety.
l Hail impact: When hailstones with a diameter exceeding 25 mm hit at a speed of 80 kilometers per hour, they easily cause invisible micro-cracks.
l Hot spot effect: The increased resistance at the crack will cause the local temperature to be more than 20°C higher than the surrounding normal area, and long-term high temperatures will burn through the backplate.
l Water vapor penetration: Delamination of internal laminated parts manifests as white or milky white patches between the glass and the cell cells, which predicts seal failure.
Frame is deformed
If the aluminum alloy frame supporting the solar panels undergoes twisting, bending, or breakage at the joints, it is often because the mounting rail system at the bottom was unevenly stressed during installation, or the roof structure has settled. The design function of the frame is to disperse wind pressure and snow load; in standard laboratory tests, a qualified frame should be able to withstand 5400 Pa of frontal pressure and 2400 Pa of back wind suction. If the frame shows deformation exceeding 5 mm, the internal silicon wafers, due to their high brittleness, are extremely prone to large-area fragmentation under conditions invisible to the naked eye. This damage caused by mechanical stress will further intensify in strong wind weather, even causing the entire panel to fall off the bracket, resulting in secondary accidents.
Observing whether the bolts or pressure blocks at the connection between the frame and the guide rail are loose is also key.
"Long-term thermal expansion and contraction will cause the fixing parts to displace; if traces of aluminum material extrusion deformation appear on the edge of the frame, it indicates that the system has reached its structural limit when dealing with wind loads."
Wire skin is cracked
The DC cables and MC4 connectors connecting each panel are long-term exposed to an environment of alternating ultraviolet rays, high temperatures, and severe cold. Substandard cable outer skins may undergo embrittlement, cracking, or even peeling after 5 to 8 years of operation. If the exposed copper core contacts the damp roof or metal bracket, it will trigger a DC Arcing risk. The temperature generated by a DC arc can reach over 3000°C, which is the main hidden danger for triggering roof fires. During inspection, one must notice if cables are randomly hanging on the roof; the standard installation method should be using UV-resistant nylon cable ties to firmly fix the cables inside the bracket rails, avoiding their friction with stagnant water or rough tiles.
Damage to the plug part is usually more hidden, manifesting as charring marks or plastic shell discoloration at the joint.
l Contact resistance: If the MC4 connector is not plugged tightly or damaged by water, its contact resistance will surge from a normal 0.5 mΩ to several ohms.
l Thermal imaging observation: When the system is running at full load, damaged connectors will show obvious bright spots under a thermal imaging camera, with temperatures much higher than the surrounding cables.
l Corrosion phenomenon: For systems near the sea, salt spray will accelerate the corrosion of the metal parts inside the connectors, leading to blocked current transmission.
Cell discoloration
Observing through the surface glass, if brown lines similar to "snail trails" are found on the originally deep blue or black cell cells, this indicates that micro-cracks have already been generated inside the cell cells. These lines are actually a silver ion migration phenomenon caused by the chemical reaction between the silver paste on the surface of the cell and water vapor after it passes through the backplate or glass gaps. Although it may not cause a significant power drop in the initial stage, it marks that the packaging integrity of the panel has been destroyed. In data monitoring, these types of panels often show unstable current, especially during the process of re-receiving light after cloud shading, where the current climbing speed is significantly slower than normal panels.
Non-uniform color of cell cells may also be caused by the peeling of the Anti-Reflective Coating (ARC).
l Color layering: Normal cell cells have good color consistency; if patches of different depths appear, it indicates the area's ability to capture sunlight is weakened.
l Grid line breakage: If thin metal grid lines have faults, they will directly cut off the output path of electrical energy in that area, forming a dead zone.
l PID phenomenon: Potential-Induced Degradation will cause the color of cell cells at the edge of the panel to darken, usually because high-voltage static electricity leads to charge loss, and the system output will therefore drop by more than 50%.
Backplate turning yellow
The polymer backsheet located at the back of the panel is the last line of defense against electric shock and for blocking water vapor. After long-term exposure to ultraviolet rays, inferior backplates will undergo yellowing, chalking, or even show dense longitudinal cracks. Once the backplate is cracked, the panel's Wet Leakage Current test will not pass. In professional testing, technicians will use a megohmmeter (Megger) to test the system's ground insulation resistance under 1000V DC voltage. If the resistance value is lower than 40 MΩ, it indicates the insulation strength of the backplate has failed; continuing to run the system at this time will involve an extremely high leakage risk, especially on rainy days.
The evolution process of backplate damage usually follows a specific physical logic.
"Initial manifestation is the color turning from white to yellow, followed by the material losing elasticity, and finally generating visible strip-like cracks under stress, causing moisture in the air to directly contact the live aluminum foil layer."
Junction box is loose
The junction box located on the back of the panel contains bypass diodes, whose role is to protect the panel from being burned during partial shading. If the sealing glue of the junction box ages, causing the lid to loosen or fall off, moisture will directly enter the core circuit area. If diodes are burned due to overheating or lightning strikes, they usually manifest in two states: short circuit or open circuit. If it is a short-circuit damage, the output voltage of one-third or the entire panel will disappear; if it is an open-circuit damage, the entire string circuit may go straight to zero. By measuring the Open Circuit Voltage (Voc) of each string with a clamp multimeter, one can quickly locate which panel's junction box has a logic or physical failure.
The sealing state inside the junction box determines the service life of the entire panel.
l Potting glue check: High-quality junction boxes are filled with silicone sealant internally; if the interior is found to be blackened or has a burnt smell, it indicates the diodes have been in a high-load working state for a long time.
l Lead-out wire damage: The base of the lead-out wire from the junction box is the most fragile place; if it is blown and moved by strong winds for a long time, the internal solder joints may generate fatigue cracks.
l Water entry traces: If white salt-alkali precipitates are inside the box, it indicates water vapor once entered and evaporated, which will greatly increase the probability of electronic module failure.
Inverter Status
Stare at the lights
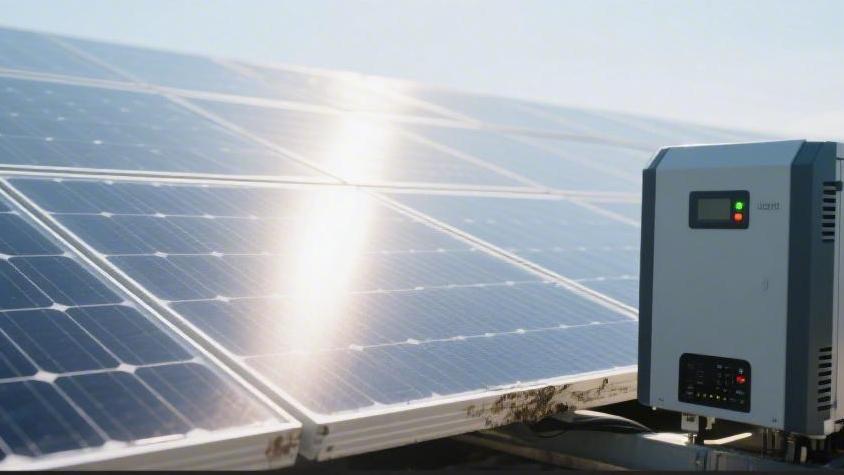
Under normal circumstances, a steady green indicator light represents that the system is normally delivering electricity to the grid. If the green light is flashing, this often indicates the system is performing a self-test before startup, or the sunlight intensity is just at the threshold to trigger work. Standard inverters, after sensing enough voltage in the morning, will undergo a synchronization process ranging from 60 seconds to 300 seconds; only when the internal relay makes a crisp "click" sound and the light turns steady green does power generation officially begin.
If you see orange or red lights, it indicates the system has detected an abnormal state. A red light usually represents a hard fault, such as an internal circuit short circuit or critical module damage, at which time the inverter will completely stop output to protect home circuit safety. An orange light represents a warning in many brands, such as grid voltage fluctuations exceeding limits, or ambient temperature being too high, causing the device to enter a power-limited operating mode.
Understand error reports
When specific error codes appear on the inverter screen, you can identify the most common system problems by consulting the table below. Codes usually consist of letters and numbers, representing abnormal electrical parameters captured by sensors.
Common display codes | Fault type | Possible causes |
Isolation Fault / Riso | Insulation fault | Broken DC cables, water in connectors, or cracked panel backplate leading to leakage |
Grid Overvoltage | Grid voltage too high | Too many neighbor solar systems, or local grid load is too light, causing voltage to exceed 253 V |
No Grid / Grid Lost | Power loss fault | Tripping in the home, blown fuse, or temporary local grid power outage |
Over Temperature | Over-temperature protection | Clogged cooling fan, poor ambient ventilation, or inverter installed in direct sunlight |
PV Overvoltage | Input voltage too high | Too many panels in series, exceeding the inverter's maximum DC input limit |
If the screen displays "Relay Fault," this usually points to the internal mechanical relay of the inverter having reached the end of its life and being unable to complete the grid-connection operation. This situation is common in old equipment running for more than 8 to 10 years. Once this type of error report involving internal hardware is seen, it usually cannot be fixed by a simple power-off restart and requires professional personnel for module replacement or overall overhaul.
Calculate conversion rate
The main responsibility of the inverter is to convert the direct current (DC) generated by the panels into alternating current (AC) used by the home. During this conversion process, energy loss is inevitable; the conversion efficiency of modern high-performance inverters is usually between 96% and 98%. You can view the "DC input power" and "AC output power" at the same time through the monitoring App. For example, if the DC end shows an input of 4,000 W, while the AC end output is only 3,500 W, then the efficiency is only 87.5%, which is significantly lower than the industry standard, indicating that the power modules inside the inverter may have aged, or the performance of internal filter capacitors has decayed.
The interior of the inverter is also equipped with a Maximum Power Point Tracking (MPPT) function, which acts like an automatic gearbox, constantly adjusting the ratio of voltage and current to ensure the maximum energy can be squeezed out of the panels under different light intensities. If the MPPT tracking speed slows down, you will find that when clouds pass and sunlight becomes strong again, the climb process of the output power appears very sluggish, or even stays in the low power range for a long time. High-quality inverters have a wider MPPT voltage range, usually between 120V and 550V. If your panel string voltage is too low and falls outside this range, the inverter will be unable to work efficiently or may even trip frequently.
Listen to the sounds
In the afternoon, when the system is running at full load, the inverter will emit a slight humming sound, which is the normal vibration of internal transformers and inductor modules under high-frequency switching states. However, if you hear sounds similar to metal friction or high-frequency screaming, this usually predicts that the bearings of the internal fan have become dry and damaged. Inverters rely on fans or large heat sinks to carry away heat; once active cooling fails, internal temperature will quickly accumulate.
Large inverters (usually above 5 kW) mostly use forced air cooling systems.
l Fan speed: Normal fans will automatically adjust speed according to the power level; the sound should be steady and regular.
l Abnormal noises: Intermittent "patter" sounds may indicate loose internal cables contacting the fan blades.
l Silent state: If the machine shell is very hot to the touch but no fan rotation sound can be heard, it indicates the fan motor may have burned out; at this time, the inverter will forcibly reduce output power for self-preservation.
Feel the heat
The generation of heat by the inverter during operation is determined by physical laws, but the level of temperature directly affects its lifespan. Most inverters are designed with an ambient temperature upper limit of 60°C, but when the internal core temperature reaches about 65°C to 70°C, the device will trigger a "Derating" protection mechanism. Even if the rooftop sunlight is sufficient, the inverter will actively limit current output to prevent internal semiconductor modules from being punctured due to overheating.
You can try to touch the inverter's cooling fins around two o'clock in the afternoon. If it is too hot to maintain contact for more than 2 seconds, it indicates the heat dissipation efficiency has a problem. The installation position has a huge impact on heat. Inverters should not be installed in closed small wooden sheds or on west-facing walls with direct sunlight. If they must be installed outdoors, a sunshade usually needs to be added. Keeping the gaps between cooling fins clean is equally important; accumulated spider webs, dust, or bird nests will block heat exchange like a quilt. Data shows that for every 10°C increase in the internal temperature of the inverter, the theoretical life of its electronic modules will be halved; therefore, maintaining a cool operating environment is an invisible cost of ensuring power generation revenue.
Check if connected to the net
Nowadays, almost all inverters are intelligent, uploading data to the cloud via Wi-Fi, Ethernet, or 4G signals. If you find the phone app displays "Offline," although this does not mean the inverter has stopped generating power, you lose real-time monitoring capability over the system. Many times, being offline is caused by the home router signal weakening, a Wi-Fi password change, or the inverter's built-in communication module crashing.
The stability of the communication status is directly related to the timeliness of fault warnings. You can quickly troubleshoot through the communication status indicator light at the bottom of the inverter:
l Blue light steady on: Successfully connected to the cloud server.
l Blue light flashing: Attempting to connect to the router, but IP address not obtained.
l Light extinguished: Communication module may have insufficient power supply or hardware is damaged.
It is suggested to install a signal amplifier in places far from the router to ensure signal strength remains above -70dBm. Once communication is restored, the inverter will usually upload cached local power generation data from the past 24 hours to ensure your annual bill statistics remain complete.