How to maintain solar modules in dusty environments: 5 methods
Maintain solar modules in dusty environments via weekly soft-brush cleaning (pressure <0.5bar, pH7±0.5 water), check sand accumulation (>1mm triggers deep clean), use anti-static cloths to reduce dust adhesion, and install vibration systems (cuts manual labor by 30%).
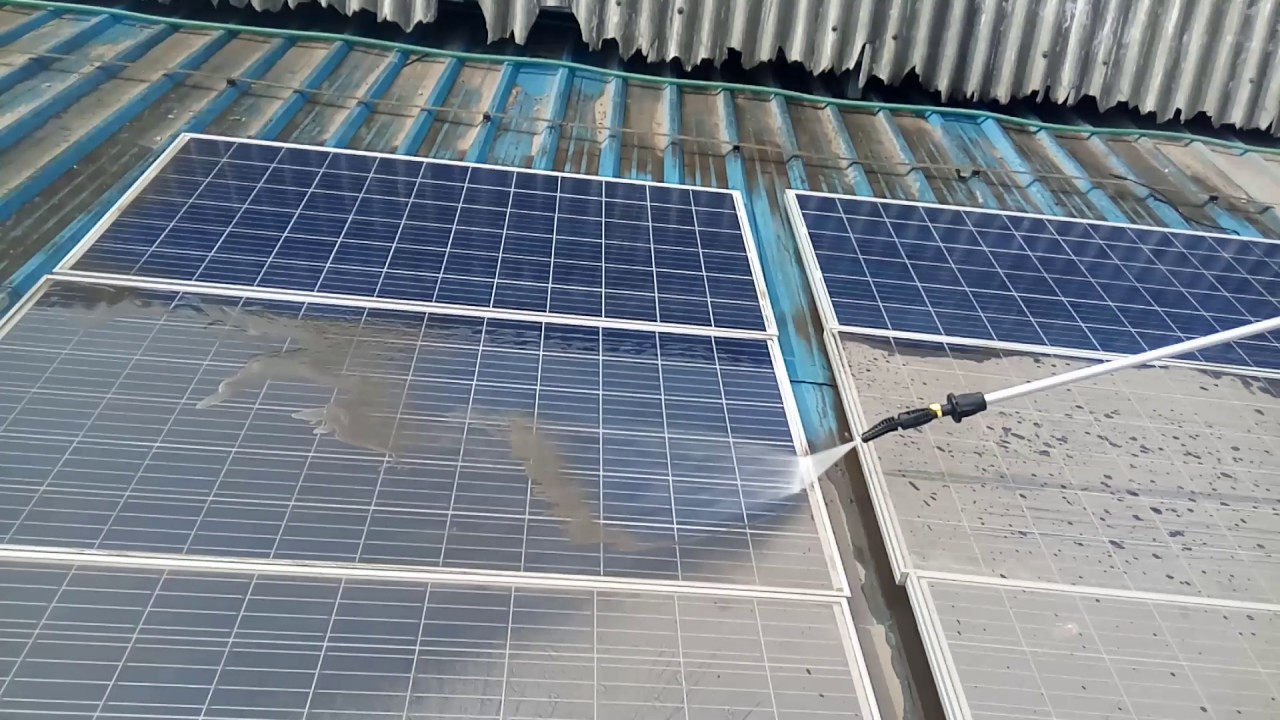
Regular Cleaning Schedules
In arid regions, solar panel efficiency can plummet by 15-25% monthly without intervention. A 2023 study of a 100 MW plant in Saudi Arabia quantified that a consistent layer of dust caused an average daily energy loss of 1.5%, compounding to a staggering 30%+ monthly revenue dip. This isn't a minor issue; it's a critical operational expense. Implementing a disciplined cleaning schedule isn't optional maintenance—it's a core strategy for protecting your asset's financial return. The math is simple: the relatively low cost of cleaning, typically 0.05–0.15 per square meter per cleaning, delivers an ROI of 5-8x by reclaiming lost generation capacity.
For instance, a site in Arizona's desert with an average PM2.5 level of 55 µg/m³ might require a bi-weekly cleaning cycle during dry seasons to keep soiling losses below 5%. In contrast, a facility in a less dusty agrarian area with PM2.5 levels around 20 µg/m³ could maintain performance with a 6-week schedule. The most effective method is to start with a conservative interval, like every two weeks, and use your SCADA system's performance data to refine it. Track the DC output and string-level currents daily; a consistent 5-7% drop in output from a cleaned baseline is your signal to initiate the next wash.
Using deionized (DI) or reverse osmosis (RO) water with a resistivity of >1 MΩ·cm is non-negotiable in areas with hard water to prevent permanent mineral scaling. The water pressure must be kept below 35 bar (500 psi) to avoid microcracks in the glass and under 0.5 liters per square meter for water conservation. For a large-scale plant covering 500,000 square meters, this translates to using ~250,000 liters per full cleaning.
System Size (MW) | Panel Area (m²) | Cleaning Cost per Event (@ $0.10/m²) | Estimated Generation Loss Avoided per Event (@ 5%) | Value of Recovered Energy (@ $0.05/kWh) | Net Gain per Cleaning |
1 | 6,000 | $600 | ~750 kWh | $37.50 | -$562.50 |
10 | 60,000 | $6,000 | ~7,500 kWh | $375 | -$5,625 |
100 | 600,000 | $60,000 | ~75,000 kWh | $3,750 | -$56,250 |
For that 100 MW plant, the 60,000 cleaning cost directly prevents a further 75,000 loss of potential revenue for that period. Over a year, 26 bi-weekly cleanings would cost ~1.56 million but prevent over 30 million in cumulative lost energy sales, making the business case overwhelmingly clear.
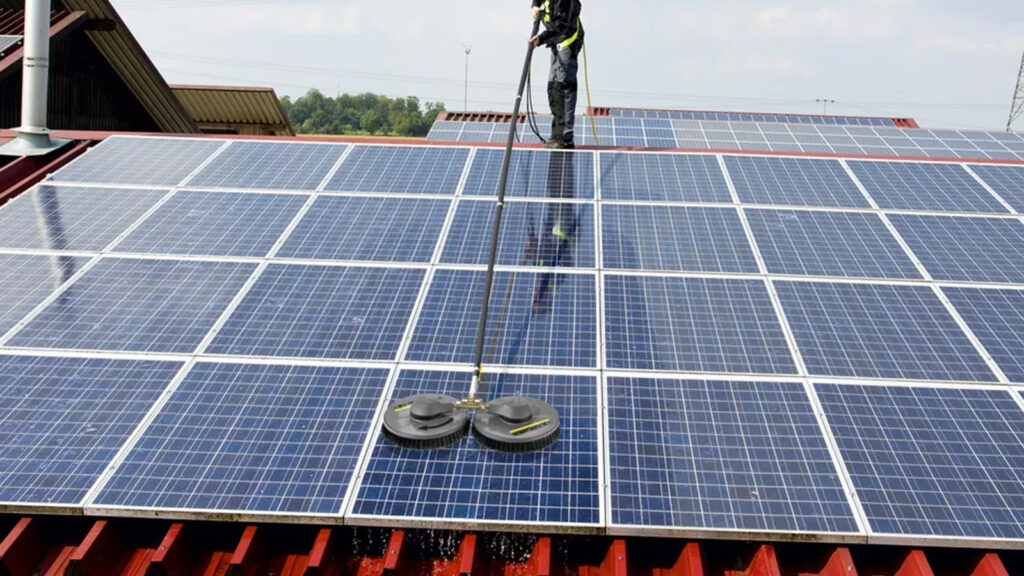
Using Automated Cleaning Systems
For large-scale solar farms exceeding 10 MW, manual cleaning becomes a logistical and financial challenge. The math is stark: cleaning a 100 MW plant manually just once can require over 150 personnel-hours, costing upwards of 8,000−12,000 per cleaning event in labor alone, with significant consistency and safety risks. Automated cleaning systems transform this from a variable, high-effort cost into a fixed, predictable operational expense. These systems, primarily robotic cleaners and installed tractor-type systems, are designed for massive scale. A study of a 200 MW facility in Nevada demonstrated that switching to an automated system reduced water consumption by 85% (from ~0.5 l/m² to ~0.075 l/m²) and slashed the average cost per cleaning to 0.02−0.035 per square meter.
Mobile robots, which operate on a 48 V DC system, are typically cell-powered and can clean 600-800 square meters per hour with a water consumption rate of ~6-8 liters per minute. They navigate rows of panels using a combination of LiDAR and pre-programmed GPS coordinates, applying a brush pressure of < 25 N/cm² to ensure no glass damage. A single unit, costing between 25,000 and 40,000, can typically service 1-1.5 MW per day. In contrast, permanent installed systems, like tractor-based gantries that move across arrays, represent a higher Capital Expenditure (CAPEX) of 100,000 to 250,000+ per MW installed but offer unparalleled speed and low Operational Expenditure (OPEX). These systems can clean an entire 100 MW site in under 48 hours with a crew of just 2-3 people, operating at speeds of 5-8 meters per minute.
For a 250 MW plant, the CAPEX for a comprehensive robotic fleet might be 4−5 million. However, this investment can pay for itself in under 3 years when factoring in the combined value of avoided manual labor costs (saving 400,000 annually), water savings (~50,000 annually), and, most critically, the 2−4% energy recovery. At a PPA rate of 0.05/kWh, this can add over 500,000 to annual revenue. The key metric is the Levelized Cost of Cleaning (LCOC), which for a well-designed automated system can be 40-60% lower than a manual model over a 10-year period.
System Type | Initial CAPEX (per MW) | Operational Cost (per m² cleaned) | Cleaning Frequency (Capability) | Water Usage (liters per m²) | Ideal Plant Size |
Manual Cleaning | ~$500 (setup) | 0.08−0.15 | Bi-weekly / Monthly | 0.4 - 0.6 L/m² | < 5 MW |
Mobile Robots | 20,000−35,000 | 0.02−0.035 | Daily / Weekly | 0.07 - 0.1 L/m² | 10 - 100 MW |
Permanent Installed System | 100,000−250,000+ | < $0.015 | Daily (even multiple times/day) | 0.04 - 0.06 L/m² | > 100 MW |
For a 50 MW plant in a moderately dusty environment, a fleet of 5-7 mobile robots delivers the best ROI, paying back in ~2.5 years. For a massive 500 MW facility in a high-dust region, the immense CAPEX of a permanent system is the only way to manage the site effectively, with a projected payback period of 4-5 years based on the immense scale of recovered energy. The automation isn't just about cleaning; it's about guaranteeing 98-99% of your plant's potential output 365 days a year.
Selecting Optimal Tilt Angles
A 2022 analysis of utility-scale plants in India's Rajasthan desert revealed a critical trade-off: arrays set at the region's 28-degree "optimal" angle suffered a 12% average energy loss due to soiling over a 60-day period without rain. In contrast, similar arrays set at a 15-degree tilt showed only a 7% loss for the same duration.
For example, a site with a latitude of 30 degrees might traditionally install panels at 28-32 degrees. But if that site experiences frequent, low-speed (< 3 m/s) winds from the west and has < 100 mm of annual rain, a deliberate reduction to 20-22 degrees could be far more profitable. The steeper angle might capture ~3% more irradiance when perfectly clean, but the shallower angle will maintain a ~5% higher average cleanliness factor. The net result is a 2% overall gain in net energy output over the year, which for a 50 MW plant translates to over $75,000 in additional annual revenue.
A lower tilt angle of 15 degrees can reduce the required cleaning frequency by ~25% compared to a 30-degree setup. If manual cleaning costs 0.10 per square meter, this reduction in frequency can save approximately 0.025 per square meter annually in operational expenses. For a 100 MW plant (~600,000 m² of panels), this equates to an annual saving of $15,000 in cleaning costs alone, plus the value of the higher energy yield.
Critical Factors for Angle Selection:
· Local Soiling Rate: Measure dust accumulation (in g/m²/day) at different test angles over a 90-day period.
· Wind Patterns: Analyze average wind speed (m/s) and direction; angles below 20 degrees benefit more from winds over 4 m/s.
· Rainfall: Sites with > 300 mm of annual rain can generally steeper angles as natural cleaning is more frequent.
· Labor Cost: In regions with high manual cleaning costs (>$0.12/m²), the incentive for a self-cleaning design is greater.
You are sacrificing a small amount of peak theoretical output—perhaps 1-3%—for a dramatically more stable and predictable daily performance. This strategy minimizes the "cliff-edge" drop in production that occurs after 15-20 days without cleaning on steeper arrays.
Applying Anti-Soiling Coatings
Field data from a 12-month trial in Dubai showed that coated panels, cleaned every 45 days, maintained an average soiling loss of just 5.2%. Meanwhile, uncoated control panels cleaned on the same schedule saw losses spike to 9.8% in the interim periods. The coating doesn't eliminate cleaning, but it drastically flattens the steep soiling curve, giving you a much wider operational window between cleans.
A high-quality hydrophobic coating will achieve an initial contact angle of >110 degrees, causing water to bead up and roll off, taking ~60-70% of loose dust with it. The critical factor, however, is how long this property lasts under intense UV exposure and abrasive dust. Low-quality products can degrade within 6-9 months, while premium coatings, often based on fluorinated polymers or hybrid silica gels, can maintain a >90-degree contact angle for 24-36 months before a reapplication is needed. The cost spectrum is wide: basic coatings range from 0.80to1.20 per square meter applied, while top-tier formulations can cost 2.50−3.50 per square meter. The key is calculating the payback period based on extended cleaning intervals.
For a 10 MW plant (~60,000 m²), applying a premium coating at 3.00/m² represents a 180,000 investment. If this allows you to extend your cleaning cycle from every 3 weeks to every 5 weeks, you reduce your annual cleaning events from 17 to 10. If each cleaning costs 6,000, you save 42,000 annually. This means the coating investment pays for itself in ~4.3 years. If the coating's effective lifespan is 3 years, it's a poor investment. If it lasts 5 years, it generates a positive ROI.
Key Coating Selection Criteria:
· Durability (% retention per year): Demand accelerated test data showing <15% degradation per year in contact angle.
· UV Stability: The coating must withstand ≥ 250 kWh/m² of UV exposure without yellowing or peeling.
· Abrasion Resistance: It should withstand ≥ 1,000 cycles of standardized brush abrasion tests without failure.
· Application Method: Roller application is cheapest but may yield inconsistent coverage; spray systems cost 15-20% more but provide superior uniformity, which is critical for performance.
They deliver the most value in regions with moderate, fine dust (PM2.5) and high water costs, where extending a cleaning schedule by 10-15 days has major economic benefits. They are less effective in areas with heavy, clay-based dust or frequent mud rains, where the coating can be overwhelmed. For existing plants, always conduct a 90-day pilot test on a single inverter block to gather real-world data on soiling rate reduction and coating durability before committing to a full-scale rollout.
Monitoring with Performance Data
A 2024 analysis of a 150 MW plant in California showed that using a rigid 4-week cleaning cycle resulted in over-cleaning by 22% during the wet season and under-cleaning by 35% during a summer dust storm, leaving an estimated $120,000 of energy unrecovered.
A clean string might output 8.5 A at 800 W/m², but a soiled string in the same conditions may drop to 7.9 A. By establishing a clean baseline current for each inverter block, you can set a 5% deviation threshold. When the median string current within a block drops by >5% for 3 consecutive sunny days between 10 a.m. and 2 p.m., it's an economic signal to dispatch the cleaning crew.
For example, if a block's current drops from 8.5 A to 8.0 A over 10 days, the soiling rate is 0.5% per day. At this rate, the system will predict a 7.5% loss—the trigger point for cleaning—in another 15 days, allowing for perfect scheduling. The financial upside is substantial. For a 100 MW plant, this can reduce the number of annual full-site cleanings from 12 to 8, saving 240,000 in direct O&M costs annually (assuming 60,000 per cleaning). More importantly, it prevents the massive losses from unexpected soiling, ensuring the plant operates at an average of 98.5% of its soiling-free potential versus 96% with a fixed schedule.
The fundamental rule is: Clean only when the cost of the lost energy exceeds the cost of cleaning. If washing a 1 MW block costs 600 and the value of the energy lost due to soiling is 150 per day, you dispatch the crew once the soiling-induced losses are predicted to exceed 4 days of loss (600/150/day). This calculation, automated per block, maximizes your ROI.
A sudden increase in particulate matter (PM2.5) levels above 50 µg/m³ or a period with >5 days of winds under 3 m/s can be used to heighten the monitoring alert level and prepare crews for a likely dispatch. This proactive, data-fed approach typically results in a 15-20% reduction in annual O&M spending for cleaning and a 1.5-2.5% increase in annual energy yield. For any plant over 5 MW, the minimal investment in the software and analytics to enable this pays for itself in a single season.