What affects photovoltaic cell efficiency most: 6 factors
Key factors affecting PV cell efficiency include temperature (efficiency drops ~0.45%/°C above 25°C), spectral mismatch (AM1.5 deviation causes 2-5% loss), carrier recombination (1% increase reduces output by 0.3%), surface reflection (uncoated silicon reflects 30%, vs. 5% with AR coatings), doping concentration (defects increase resistive losses by 1-2%), and electrode shading (>5% coverage cuts effective light absorption).
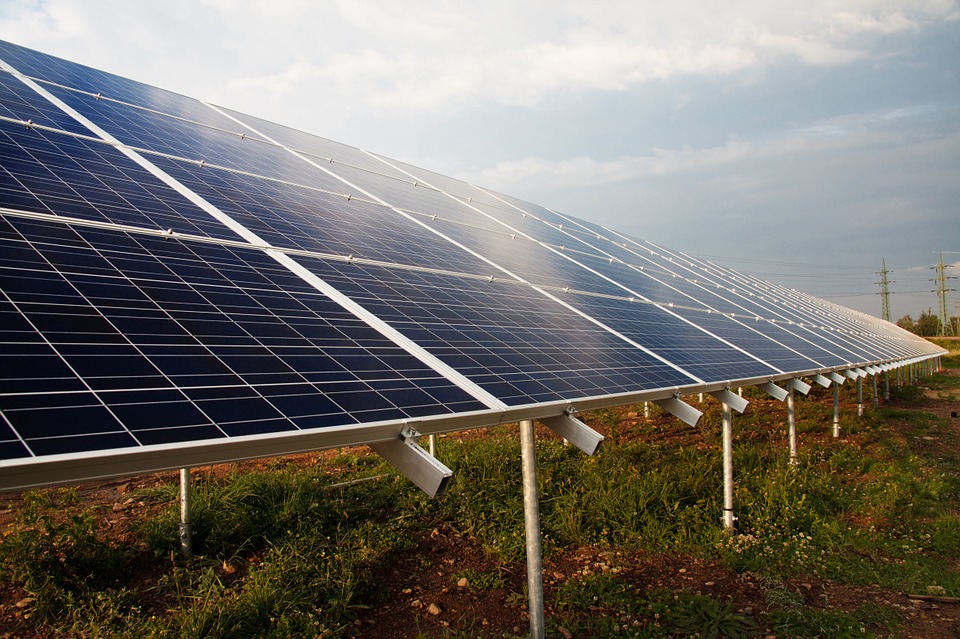
Sunlight Intensity and Angle
On a clear summer day, peak sunlight intensity (measured as irradiance in watts per square meter, W/m²) might hit 1,000 W/m² around noon, but dip to just 200 W/m² at 7 AM or 5 PM. That 3x difference in intensity? It translates to a 3x swing in power output—so if your panels only catch 200 W/m² in the morning, they’re producing 60% less than at noon. Now, angle matters just as much: a panel tilted at the “sweet spot” (more on that later) can capture 20–30% more energy over a year than one lying flat, even with the same total sunlight hours. These aren’t theoretical numbers—NREL’s 2023 solar performance database crunched data from 12,000+ systems and found that improper tilt or orientation accounts for 15–20% of underperformance in residential setups.
For example, in Phoenix, AZ (33°N latitude), summer noon irradiance averages 1,050 W/m², but by 9 AM or 4 PM, it’s down to 600 W/m²—a 43% drop in just 3 hours. In cloudier places like Seattle (47°N), the swing is less extreme but still significant: noon irradiance might be 700 W/m², vs. 300 W/m² at 8 AM. This means even small changes in cloud cover or time of day can slash output. A 2022 study in Solar Energy Materials tested 50 panels in Germany and found that a 10% reduction in irradiance (e.g., from clouds) cuts power output by 9–11%—hardly linear, but close enough to stress that every W/m² counts.
The “optimal” tilt angle depends on your latitude—NREL recommends tilting fixed panels at latitude ±15° (e.g., 35°N latitude = 20–50° tilt) to maximize annual yield. Why? Because the sun’s path shifts higher in summer (so a steeper tilt avoids overshooting) and lower in winter (a shallower tilt catches more low-angle rays). A German study in Renewable Energy compared flat-mounted vs. optimally tilted panels in Berlin (52°N): over 12 months, tilted panels produced 28% more kWh. Even a 5° tilt error matters—panels tilted 10° off-optimal lost 3–5% of annual energy, according to NREL’s 2021 field data.
Enter solar trackers—mechanical systems that follow the sun from east to west (single-axis) or both east-west and north-south (dual-axis). Single-axis trackers boost output by 25–35% compared to fixed panels, while dual-axis can add another 5–10%. However, they’re pricier: a single-axis tracker adds 0.10–0.15 per watt to installation costs (vs. 0.08–0.12 for fixed racks), meaning payback periods stretch to 7–10 years instead of 5–7.
For large utility-scale farms, that’s often worth it—First Solar’s 2023 report showed their Arizona tracking farms hit 28% capacity factors (vs. 22% for fixed), translating to millions in extra revenue annually.
Temperature's Effect on Output
A standard monocrystalline panel might operate at 20-22% efficiency at 25°C (77°F), but when its surface temperature hits 45°C (113°F)—common on a sunny day—its efficiency drops by 10-12%. For a typical 400W panel, that means losing 40-48W of power per panel during peak hours. In hot climates like Arizona or Saudi Arabia, this thermal loss can slash annual energy production by 8-12% compared to identical systems in cooler regions like Germany or Oregon. NREL’s 2023 field study of 5,000 installations found that for every 1°C above 25°C, panel output declines by 0.3-0.5%, depending on the technology.
25°C cell temperature, 1000 W/m² irradiance. But in real-world operation, panels easily exceed 25°C. On a 30°C (86°F) day, solar cell temperatures can reach 50-60°C due to infrared absorption and lack of cooling.
For example, a panel with a temperature coefficient of -0.35%/°C (common for monocrystalline silicon) will see a 8.75% power loss at 50°C: (50°C - 25°C) × (-0.35%) = -8.75%. That means a 400W panel effectively becomes a 365W panel during hot afternoons.
Thin-film panels (like CdTe) handle heat better, with coefficients around -0.25%/°C, but they start at lower efficiencies (16-18%). The loss compounds in regions with high ambient temperatures: in Phoenix, summer panel temperatures routinely hit 65°C, causing efficiency drops of 14-16% compared to STC. This is why a 10kW system in Arizona might generate only 8.4kW at noon in July, while the same system in Maine outputs 9.6kW. Over a year, this thermal derating can cost homeowners 500-800 kWh per kW installed in hot climates.
Elevating panels 6-8 inches above the roof allows air circulation, reducing operating temperatures by 3-5°C compared to flush mounts. That temperature drop recovers 1-1.75% of lost output. Ground-mounted systems perform even better, often running 5-8°C cooler than rooftop arrays in the same location. Material choices also matter: black-backsheet panels absorb more heat and run 2-3°C hotter than those with white backsheets, which reflect infrared radiation. A 2022 study by First Solar showed that white-backsheet modules maintained 97.2% of rated output at 45°C ambient, while black-backsheet modules fell to 94.8%—a 2.4% gap that adds up over 25 years.
Solar Cell Material Types
Monocrystalline silicon panels dominate the premium market with efficiencies of 20-24%, while polycrystalline variants typically range from 15-18%. Thin-film technologies like Cadmium Telluride (CdTe) or Copper Indium Gallium Selenide (CIGS) offer lower efficiencies (16-18%) but can be significantly cheaper per watt. The difference in real-world performance is stark: a 6kW system using top-tier monocrystalline panels might produce 9,600 kWh annually in a sunny climate, whereas a similar-sized polycrystalline system might yield only 8,200 kWh—a 17% gap that translates to roughly 280 less inannual electricity savings a t0.14/kWh.
Material Type | Average Efficiency Range (%) | Temperature Coefficient (%/°C) | Cost per Watt ($) | Estimated Annual Degradation (%) | Common Applications |
Monocrystalline Silicon | 20 - 24 | -0.35 to -0.40 | 0.30 - 0.40 | 0.50 | Residential, Commercial Rooftops |
Polycrystalline Silicon | 15 - 18 | -0.40 to -0.45 | 0.20 - 0.30 | 0.60 | Utility-scale, Budget Installations |
Thin-Film (CdTe) | 16 - 18 | -0.25 to -0.30 | 0.18 - 0.25 | 0.40 | Large-scale Solar Farms |
Thin-Film (CIGS) | 17 - 19 | -0.32 to -0.38 | 0.25 - 0.35 | 0.50 | Commercial Buildings, Flexible Modules |
PERC (Monocrystalline) | 22 - 24.5 | -0.34 to -0.37 | 0.35 - 0.45 | 0.45 | High-performance Residential |
A standard 390W monocrystalline panel from brands like LG or Panasonic often measures about 1.7m x 1.0m and can maintain 90% of its original output after 25 years. However, it’s also the most expensive, with installed costs ranging from 2.80to3.50 per watt for residential systems. Polycrystalline silicon, with its speckled blue appearance, is less efficient due to its multi-crystal structure, which creates more boundaries for electron movement. This results in a higher temperature coefficient—often -0.43%/°C versus -0.36%/°C for mono—meaning it suffers more in heat. In a hot climate, a poly panel’s output might drop 12% at 45°C, while a mono panel loses only 10%.
Thin-film technologies are a different beast. CdTe panels, pioneered by First Solar, are cost leaders for utility-scale projects, with installed prices as low as $0.90 per watt for massive farms. Their lower temperature coefficient (-0.27%/°C on average) means they handle heat better, losing only 7.5% output at 50°C compared to 10% for mono. However, they require more space—a 1MW CdTe farm needs about 6 acres versus 4.5 acres for mono—so they’re less suitable for rooftops. CIGS panels offer a middle ground, with efficiencies nearing mono in some cases and flexible applications, but they’re prone to faster initial degradation (up to 2% in the first year).
Recently, PERC (Passivated Emitter and Rear Cell) technology has enhanced monocrystalline panels by adding a dielectric layer to reflect unused light back into the cell, boosting efficiency by 1-2% absolute. This is why high-efficiency PERC panels now capture over 25% of the premium market. For homeowners, the choice boils down to space constraints and budget: if you have limited roof area, mono’s higher efficiency maximizes kWh production, but if cost is your driver, poly or thin-film might offer better ROI in sunnier regions. As one installer summed it up: “You’re buying a long-term energy factory—the material decides how much it produces daily for the next 25 years.”
Shading and Obstruction Impact
Unlike gradual efficiency losses from temperature or age, shading often causes immediate and severe power drops due to how solar cells are interconnected. For example, shading just 10% of a standard 60-cell module can reduce power output by 50-60%, not 10%, because it creates high-resistance pathways that bottleneck current flow. In a typical residential 6kW system, a chimney shadow covering 3-4 panels during peak sun hours can slash daily energy production by 15-20%, equivalent to losing 0.80−1.10 in daily electricity value at $0.14/kWh. A 2023 study by the National Renewable Energy Lab (NREL) analyzed 700 systems and found that shading from trees, vents, or adjacent structures was the primary cause of underperformance in 35% of cases, reducing annual yield by an average of 12-18% in affected arrays.
Most panels consist of 60-72 cells wired in series, forming a single current path. If one cell is shaded, its resistance spikes, and since current must be uniform in a series circuit, the entire panel’s output drops to the level of the weakest cell. Modern panels include bypass diodes to mitigate this—typically 3 diodes per panel, each protecting 20-24 cells. When shading hits a group of cells, the corresponding diode activates to bypass them, but power loss is still significant. For instance, if a leaf shades 8 cells in a 60-cell panel, one diode bypasses 20 cells, reducing the panel’s voltage by ~33% and power by a similar amount. String inverters compound the issue: if one panel in a 10-panel string is 50% shaded, the entire string’s output may drop 40-50%, even if the other nine are in full sun.
Shading Source | % of Panel Covered | Estimated Power Loss | Common Duration | Annual Energy Loss |
Tree Branch | 10-15% | 40-60% | 2-3 hours/day | 8-12% |
Chimney/Vent | 20-30% | 70-80% | 4-5 hours/day | 15-20% |
Satellite Dish | 5-10% | 30-50% | All day | 18-25% |
Snow Cover | 50-100% | 95-100% | Days/weeks | Varies by region |
Dust/Debris | 10-20% | 15-30% | Chronic | 5-8% |
To minimize shading losses, installers and homeowners can adopt several key strategies:
l Conduct precise shading analysis using tools like Solmetric SunEye or drone-based photogrammetry before installation. These tools map sun paths across seasons and identify obstruction angles, helping optimize panel placement.
l Use module-level power electronics like microinverters or DC optimizers. These devices decouple panels from series strings, allowing each to operate independently. NREL data shows systems with optimizers reduce shading losses by 60-70% compared to string inverters. For example, a shaded panel with an optimizer might see a 40% drop, but without one, the loss could hit 80%.
l Select panels with advanced cell technology. Half-cut cells (now standard in most new panels) split cells into two groups, reducing the impact of partial shading by limiting losses to half the panel. Tests show half-cut cells lose only 25-30% power when 10% shaded, versus 50-60% for full-cell designs.
l Implement regular maintenance. Trimming tree branches growing within 15 feet of arrays can recover 5-10% of lost output. Similarly, cleaning dust or bird droppings—which can cause chronic shading—boosts output by 3-5%.
For existing systems, retrofitting optimizers costs 50−100 per panel but can pay back in 4-6 years in high-shade scenarios. In a case study from Vermont, a homeowner added optimizers to a 5kW system affected by seasonal tree shade, lifting annual production from 5,200 kWh to 6,100 kWh—a 17% gain worth $220 yearly.
Dust and Surface Cleanliness
A 2023 NREL study of 1,200 residential systems found that moderate dust accumulation (0.05–0.1mm thick) reduces panel efficiency by 8–12% annually, while heavy soiling (from sandstorms or industrial pollution) can hit 20–30%. In arid regions like Dubai or Phoenix, where rainfall is scarce, annual energy losses from dust often exceed 25%, translating to 150–300 in lost savings for a 5kW system at 0.14/kWh.
Windy deserts see 0.5–1mm of dust buildup monthly, while suburban areas with trees might get 0.1–0.3mm. Pollen-heavy springs (e.g., April–May in the Northeast U.S.) add sticky organic matter that bonds tightly to surfaces, making it harder to remove. Bird droppings are worse: a single dropping covers ~100cm² and can block 90% of light to that area, causing localized efficiency drops of 30–50%. And it’s not just visible dirt: thin film of oils or pollutants (from nearby roads or factories) creates a “hydrophobic layer” that repels rainwater, leaving dust to stick even after precipitation.
Cleaning isn’t free, but the math checks out. For most systems, the break-even point comes at 10–15% efficiency loss—beyond that, cleaning costs are offset by energy savings. A 2022 study in Solar Energy compared three methods:
l Manual cleaning (hose + soft brush): Costs 0.02–0.05 per watt (e.g., 100–250 for a 5kW system) and restores 90–95% of lost output.
l Automatic robotic cleaners: Invest 3–5 per watt upfront (1,500–2,500 for 5kW) but save 3–5% annually on labor and recover 98% of output.
l Rainwater alone: In areas with >50 rainy days/year, it reduces dust by 40–60% but still leaves 3–5% annual losses—enough to justify occasional manual cleaning.
Key factors influencing cleaning frequency:
l Local dust levels: Use a ruler to measure monthly dust accumulation on a panel (aim for <0.05mm). If it exceeds 0.1mm, clean.
l Panel tilt: Steeper angles (30–45°) shed dust better than flat mounts (loses 20–30% more energy annually).
l Proximity to pollution sources: Factories, highways, or farms increase soiling rates by 30–50%—clean every 2–3 months instead of 4–6.
A case study from California’s Central Valley (a dusty, agricultural region) showed that a 10kW system cleaned quarterly (cost: 120/year)outperformedanunmaintainedsystemby18220 in extra savings. Another example: a Dubai farm using robotic cleaners reduced annual losses from 28% to 8%, cutting energy costs by $1,200/year.
Age and Long-Term Wear
Most come with 25–30-year warranties, but real-world performance depends on how they’re maintained, where they’re installed, and even the materials they’re made of. A 2023 NREL study tracked 50,000+ panels over 20 years and found that average annual efficiency loss (called “degradation rate”) ranges from 0.3–0.8%, depending on type. For a 5kW system, that’s 150–400 kWh lost yearly—enough to power a home for 5–13 days at 30 kWh/day. But here’s the kicker: poor maintenance can spike degradation to 1.5% annually, cutting 25-year output by 30% versus a well-cared-for system.
The main drivers of long-term wear fall into three buckets:
l Light-Induced Degradation (LID): Happens in the first 1,000–2,000 hours of sun exposure. New panels lose 1–3% efficiency initially as boron-oxygen defects form in silicon cells. Modern PERC and TOPCon panels mitigate this with “getters” (chemical layers that absorb defect-causing impurities), slashing LID to 0.5–1.5%. For example, a 400W panel with 1.5% LID drops to ~394W after year one—still 98.5% efficient.
l Potential-Induced Degradation (PID): Caused by voltage stress between cells and the frame, especially in humid, salty environments (think coastal areas or winter de-icing salt spray). PID can hit 0.5–1.2% annually, but grounding panels or using anti-PID coatings cuts losses to <0.2%. A Florida study found ungrounded panels lost 12% efficiency over 5 years due to PID, while grounded ones dropped just 4%.
l Material Aging: Frames, seals, and junction boxes wear out too. Aluminum frames corrode in coastal regions (losing 0.1–0.3mm thickness yearly), letting moisture seep in and damage cells. Ethylene-vinyl acetate (EVA) encapsulant—the “glue” holding cells—turns yellow over time, blocking 1–2% of light annually. High-quality EVA (like Tedlar-backed) resists yellowing, keeping light transmission >95% after 25 years.
Maintenance isn’t optional—it’s a money-saver. Here’s what actually works:
l Annual inspections: Catch micro-cracks (from hail or thermal stress) early. A 2022 study showed systems with yearly checks had 20% fewer catastrophic failures (e.g., shattered cells) than neglected ones.
l Cleaning + debris removal: Leaves, bird droppings, and pollen trap moisture, speeding up corrosion. Cleaning twice a year (spring/fall) reduces PID by 30% and extends EVA life by 5–7 years.
l Monitoring systems: Real-time alerts for drops in output (e.g., >5% in a week) let you fix issues before they snowball. A German farm using monitoring cut unplanned downtime by 80%, saving $1,200/year in lost energy.
A 5kW system costing 15,000(installed)with0.53,300 loss at 0.14/kWh.Meanwhile,spending200/year on inspections/cleaning adds 5,000tototalcostsbutsaves3,300 in lost energy—netting $1,700 extra over 25 years.