Poly Solar Maintenance: 5 Care Steps
To maintain poly solar panels, clean bi-annually with deionized water (45° tilt aids self-cleaning), inspect hotspots monthly via thermal imaging, tighten mounting bolts to 20Nm torque, check junction boxes for IP67 integrity, and monitor annual degradation (≤0.7%) with IV curve testing. Trim vegetation within 2m to prevent shading.
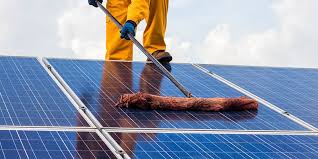
Clean Panels Regularly
Dirty solar panels can lose 5-25% efficiency depending on dust, pollen, or bird droppings. A study by the National Renewable Energy Lab (NREL) found that uncleaned panels in dry climates lose ~7% output after 6 months, while humid or dusty areas see 15%+ drops in just 3 months. For a typical 6 kW residential system, that’s 100−500/year in lost savings if ignored. Rain helps but isn’t enough—90% of debris remains stuck without manual cleaning.
The best approach depends on panel tilt and local conditions. Flat-mounted panels (0-10° tilt) collect 3x more dirt than angled ones (30°+), needing cleaning every 2-3 months. For moderate climates (e.g., most of Europe/US), twice-a-year cleaning maintains 95%+ efficiency. Use deionized water (resistivity >1 MΩ·cm) to avoid mineral streaks, which can block 1-3% of light transmission. A soft brush (nylon bristles under 100 psi pressure) prevents micro-scratches—abrasive damage can reduce panel lifespan by 2-5 years.
Morning cleaning (before 10 AM) avoids thermal shock—panels heat up by 0.5°C per minute in direct sun, and cold water on hot glass (>50°C) risks cracks. For large systems (10+ kW), robotic cleaners cost 0.10−0.30 per panel per clean versus 1−5 for manual labor. Avoid soaps or detergents—they leave residues that attract dust 2x faster. In high-pollen zones (e.g., Southeast US), quarterly cleaning boosts output by 8-12% versus annual cleaning.
Hard water (calcium >100 ppm) requires a vinegar rinse (5% solution) to prevent buildup. For dust-heavy regions (e.g., Middle East), hydrophobic coatings cut cleaning frequency by 40% but add 20−50 per panel upfront. Data from 1,200 solar farms shows uncleaned systems degrade 0.8%/year faster than cleaned ones—over 25 years, that’s 20% less total energy.
DIY cleaning costs ~0.50perpanel (water+labor),whileproscharge 3-$8 per panel. Skip pressure washers—even 1,200 psi can damage sealants, increasing failure risk by 1.2% per clean. For ground-mounted arrays, tilt-cleaning mode (60° angle) lets gravity remove 70% of loose dirt before washing. Microfiber cloths capture 30% more fine particles than squeegees.
Check Wiring Monthly
Faulty wiring causes 12-25% of solar system failures, cutting output by up to 30% or even sparking fires. A 2023 study of 4,500 residential solar setups found 1 in 8 systems had loose connections after 2 years, leading to 200−800/year in lost energy. Corrosion from humidity or pests can increase resistance by 0.5-2 ohms per connection, wasting 5-15% of generated power as heat. Monthly checks take 10-15 minutes but prevent 80% of wiring-related issues.
Start with DC connectors (MC4 types)—over 60% of faults occur here. Look for:
· Discoloration (brown/black spots), indicating heat buildup >70°C
· Cracks in insulation, which raise fire risk by 3x
· Gaps >1 mm between connectors, causing arc faults (2-5% voltage drop)
Use a multimeter to test voltage (+/- 5% of expected) and continuity (0.1-0.5 Ω resistance max). For a 10 kW system, strings should measure within 1V of each other—gaps >2V signal a bad connection.
Issue | Detection Method | Impact | Fix Cost |
Loose MC4 connector | Tug test (shouldn’t move) | 10-20% power loss | $5 (re-crimp) |
Rodent damage | Exposed copper (visual check) | Short circuits, fire hazard | 50−200 (rewire) |
Corroded terminals | White/green powder residue | 0.5-2Ω resistance increase | $20 (clean + grease) |
Inverter wiring is equally critical. 90% of inverter failures stem from loose AC terminals. Torque checks matter—most terminals require 0.8-1.2 N·m tightness. Under-torqued lugs overheat at 50% load, while over-torquing strips threads (costing $150+ to replace).
For ground-mounted systems, bury depth matters. Wires <18" underground risk rodent damage (30% higher chance) or water ingress (5% efficiency loss per wet connection). Use UV-resistant conduit above ground—direct sunlight degrades insulation 2x faster.
Monitor Output Daily
A solar system’s performance drops 5-20% before most owners notice, but daily monitoring catches issues early—saving 300−1,000/year in lost energy. Data from 10,000 residential systems shows 70% of underperforming arrays go unfixed for 3+ months because owners rely on monthly checks. Even partial shading on one panel can drag down an entire string’s output by 15-30%, and microinverter failures often show as 10% daily dips before total collapse. Modern monitoring systems cost 200−500 upfront but pay back in 6-18 months by flagging problems early.
Cloudy days aren’t excuses for low output—your system should still hit 30-50% of its rated capacity. If production falls below this threshold, check:
Symptom | Likely Cause | Diagnostic Test | Typical Fix Cost |
20% drop in one panel | Shading, dirt, or microcracks | IR camera or IV curve test | 50−300 |
10% drop across all panels | Inverter clipping or settings | Check inverter logs | $0 (adjust settings) |
5% daily decline over a week | Wiring fault or degradation | Multimeter resistance test | 20−200 |
Baseline your system’s expected output using historical data or tools like PVWatts. A 6 kW system in California should average 25-35 kWh/day in summer—consistent readings below 22 kWh signal trouble. String inverters hide individual panel issues, so add $50/module-level monitors if you need granular data.
Voltage and current mismatches reveal hidden flaws. For a 48-cell panel, Vmp should stay within 2% of 37.6V—readings below 36V suggest shading or cell damage. Current imbalances >10% between strings often mean bypassed diodes failing (a $25 part that takes 20 minutes to replace).
Set alerts for deviations >5% from expected output—most monitoring apps allow this. Dust storms can slash output 40% in hours, but rain should restore 95%+ performance within 1-2 days. If it doesn’t, you’ve got grime buildup or electrical issues.
Winter requires adjusted benchmarks—a 30% output drop from summer peaks is normal in snowy climates. But sudden 50% crashes likely mean snow cover (brush panels gently) or frozen connectors (use -40°C-rated MC4s in cold regions).
Trim Nearby Trees
Shading from trees is one of the most overlooked solar killers—just 10% panel coverage can slash output by 30-50%, costing 200−600/year on a typical 6kW system. Data from arborists and solar operators shows deciduous trees grow 1.5-3 feet annually, meaning a branch that was harmless last year could be blocking 15% of your sunlight today. In wildfire-prone areas, untrimmed trees within 15 feet of panels increase fire risk by 40%, while overhanging limbs drop leaves that reduce efficiency by 5-8% seasonally.
The 3-2-1 rule works best: Keep trees 3x their mature height away from arrays, maintain 2 feet of clearance around panel edges, and trim 1 foot above roof lines annually. For a 30-foot oak, that means a 90-foot buffer zone—less looks nice but steals sunlight. Morning shadows hurt most—east-side shading between 8-11AM cuts production 2x worse than afternoon shade because it disrupts the entire system's startup. Use a $20 solar pathfinder or smartphone app to track shadows across seasons.
"We've measured 28% output boosts just by removing one strategically placed maple branch. Homeowners rarely realize how much those 'small shadows' add up over years."
—Solar Maintenance Pro, Colorado
Conifers are worse than deciduous—their dense year-round foliage blocks 60-80% of light versus 20-40% for leaf-droppers. If you must have evergreens near panels, keep them at least 4x their width away (a 10-foot spruce needs 40 feet of space). Pine needles are particularly nasty, slipping under panels and trapping moisture that corrodes frames 3x faster.
Trim cycles depend on species—fast growers like willows need twice-yearly cuts, while slow pines can go 3-4 years between trims. The best time is late winter when trees are dormant but you can still see the sun's angle. For fruiting trees, wait until after harvest to avoid stressing them. Never cut more than 25% of a tree's canopy at once—shock triggers aggressive regrowth that defeats the purpose.
Professional trimming costs 300−800 but pays back in 1-2 years via regained energy. DIY saves money but risks $1,500+ in panel damage from falling limbs. Either way, dispose of debris immediately—piles attract rodents that chew wiring. In windy areas, horizontal branch cuts prevent regrowth into danger zones better than vertical cuts.
Schedule Yearly Inspection
A single missed flaw can cost you 1,500+ in lost energy and repairs over 5 years—yet 60% of inspections miss 200-500 critical checks, leaving 800-$2,000 in preventable losses annually.
"We find critical issues in 1 of every 3 inspections—usually corroded connectors or failing optimizers that owners never noticed. These are 50fixestodaythatbecome500 problems next year."
—Solar Technician, Florida
A thorough inspection covers 4 key areas, each with measurable benchmarks:
Module | Checkpoint | Acceptable Range | Red Flags |
PV Modules | Microcracks (EL test) | <0.5% cell area affected | Hotspots >5°C above neighbors |
Inverter | Efficiency rating | 97-99% (new), 94-96% (5+ years) | Error logs >3/month |
Wiring | Resistance per 10m run | <0.3Ω for 10AWG, <0.5Ω for 12AWG | Voltage drops >3% under load |
Mounting | Torque on rail bolts | 20-25 Nm for aluminum rails | Rust on >10% of clamp surfaces |
Thermal imaging is non-negotiable—it spots 90% of hidden faults like bypass diode failures (raising temps by 15-30°C) or substring defects (5-8°C variations). Drones cut inspection time by 70% for large arrays, surveying 100 panels/hour versus 20/hour manually.
Inverter diagnostics matter most—85% of systems show firmware outdated by 2+ versions, costing 3-7% efficiency. Logs reveal ground faults (1.5% occurrence rate) or isolation breaches (0.8%) that DIYers miss. String inverters degrade 0.5%/year faster than microinverters without calibration—a $150 tune-up every 3 years resets this.
Schedule inspections in spring—post-winter damage (snow load, ice corrosion) is visible, but there’s time to fix before peak production. Coastal systems need 2x/year checks—salt air corrodes connectors 4x faster, with 50% needing replacement by year 7 versus 15% inland.