Why do solar panels only last 25 years?
Solar panels are affected by ultraviolet radiation and temperature fluctuations, making silicon wafers prone to micro-cracks.
Their efficiency degrades by about 0.5% annually, with power output dropping to around 80% after 25 years.
Regularly cleaning the panels and inspecting the wiring can delay aging.
Degradation vs. Death
Not Broken
The industry sets 25 years as a standard life cycle, which stems from commercial warranty commitments and financial institution calculation models, rather than the physical end of the equipment's life. A brand-new set of modules typically retains 80% to 85% of its initial power generation capacity after weathering a quarter-century of sun and rain.
Taking a panel with a rated power of 400 watts as an example, in its 25th year, under Standard Test Conditions (STC, i.e.1,000 W/m² solar irradiance and a cell temperature of 25°C), it can still output 320 to 340 watts of power. "End of life" in the solar sector refers to the point where the module's power generation efficiency falls below the manufacturer's minimum guaranteed threshold, meaning it no longer offers the optimal commercial return on investment, rather than the equipment itself turning into scrap metal.
How Much Power is Lost
Long-term monitoring data from a vast number of outdoor systems worldwide, collected by the National Renewable Energy Laboratory (NREL), indicates that the power generation of crystalline silicon solar modules shows a slow, linear downward trend, termed "degradation" in the industry. The median annual degradation rate for mainstream global Tier 1 solar panels is around 0.5%. During the first year of installation and operation, the degradation rate is slightly higher, typically between 1% and 2%, which the industry refers to as Light-Induced Degradation (LID). The LID phenomenon is primarily caused by residual boron from the silicon wafer manufacturing process reacting with oxygen, forming microscopic defect structures when first exposed to sunlight, which reduces the minority carrier lifetime.
l If a system can produce 10,000 kilowatt-hours (kWh) of electricity in its first year, its capacity will decrease by about 50 kWh each subsequent year.
l By the 10th year of operation, the annual power generation is expected to drop to around 9,500 kWh.
l By the 25th year of operation, the annual power generation will maintain at around 8,750 kWh.
This long-term decline in power generation is a slow and predictable physical process. When calculating the Payback Period, accurately factoring in an annualized drop of 0.5% yields a highly valuable financial model.
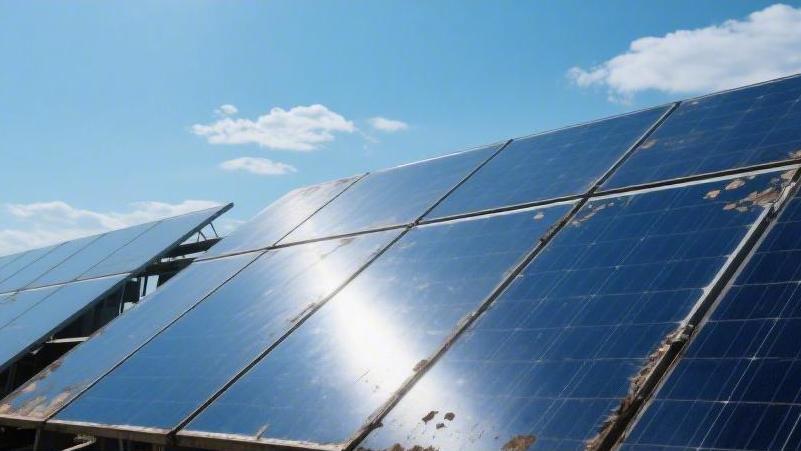
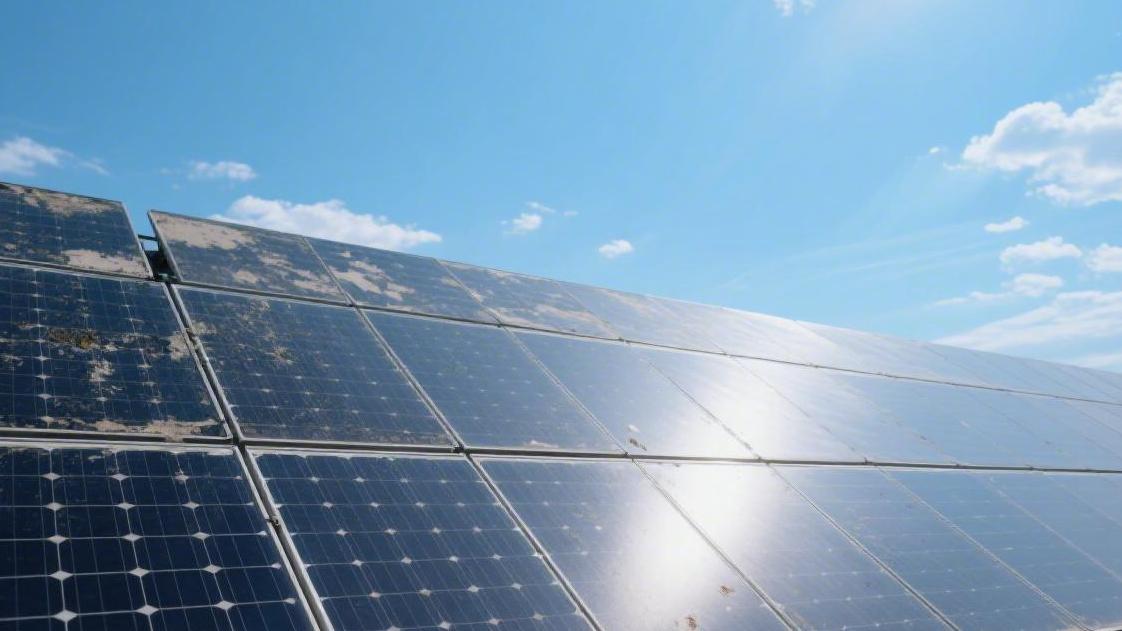
How They Age
A solar module is a sandwich structure made of multiple laminated layers. The monocrystalline or polycrystalline silicon cells themselves have extremely high chemical stability and can last for centuries. The factors causing the year-over-year decline in power generation efficiency primarily stem from the physical aging of external encapsulation materials under decades of UV radiation, extreme temperature swings, and moisture ingress.
l Ethylene-Vinyl Acetate (EVA) is an encapsulant film used to bond the glass, solar cells, and backsheet. After long-term exposure to high-intensity UV radiation, the EVA material undergoes photochemical degradation, gradually yellowing or turning brown. The darkening of the color blocks some photons from penetrating the glass to reach the cell surface, reducing photoelectric conversion efficiency.
l Polymer backsheets become brittle after years of thermal expansion and contraction cycles. According to International Electrotechnical Commission (IEC) testing standards, modules undergo daily transitions from daytime high temperatures to nighttime low temperatures. The accumulation of long-term mechanical stress leads to weak fatigue fractures in the internal interconnect ribbons, increasing the module's series resistance.
l Moisture can seep into the module through microscopic gaps in the aluminum alloy frame and silicone sealant. Water ingress triggers Potential-Induced Degradation (PID), which increases leakage current on the surface of the solar cells, subsequently dragging down the output voltage of the entire module.
Accounting Standards
Product warranties cover manufacturing defects at the physical level, such as unexplained glass shattering, water in the junction box, or cracked frames, and are typically set for a duration of 10 to 15 years. Performance warranties, on the other hand, specifically target the aforementioned degradation rate, explicitly guaranteeing an output of no less than 80% of the initial rated power by year 25.
The establishment of this 25-year milestone serves the calculation of the Levelized Cost of Energy (LCOE). When providing loans for large-scale solar power plants, financial institutions require a standardized timeframe that aligns with conventional long-term financing debt cycles to evaluate risks and returns. Setting a uniform 25-year depreciation period provides an extremely certain cash flow projection basis for mathematical models.
Are They Still Usable?
Once a system has operated for over 25 years, it remains fully capable of continuing service. Inverters, which are responsible for converting direct current (DC) into alternating current (AC), typically fail and need replacement between years 10 and 15 because they contain a large number of vulnerable electronic modules like electrolytic capacitors. However, the main panel modules on the roof do not require replacement.
In early pilot projects across North America and Europe, solar arrays built in the late 1980s and early 1990s are still grid-tied and generating power today. The criteria for deciding whether to dismantle old equipment in the 25th year revolve around space utilization and opportunity costs. With technological iteration, new modules currently on the market boast power generation efficiencies over 50% higher than products from 25 years ago within the same physical footprint. When available space is limited and the owner's electricity demand has grown significantly, replacing them with new equipment becomes highly cost-effective in terms of output per unit area.
Why Do They Degrade at All
Fear of Light
By design, solar panels completely rely on sunlight to generate free electrons; however, within the first few hours to days of light exposure, the photons themselves trigger initial performance degradation within the crystalline silicon. The industry defines this as Light-Induced Degradation (LID), which is an unavoidable physical-chemical reaction at the material level. During the manufacturing of P-type monocrystalline silicon cells, a specific amount of boron is usually doped into the silicon wafer to improve conductivity. At the same time, quartz crucibles inevitably introduce trace amounts of oxygen into the silicon ingot during the high-temperature crystal pulling phase.
When silicon wafers containing boron and oxygen first operate under sunlight and generate photogenerated carriers, the injection of electrons prompts free boron ions and interstitial oxygen atoms to combine, forming highly active Boron-Oxygen Complexes (B-O Complexes). These complexes act as deep-level defect "trap centers" within the silicon crystal lattice, capturing large numbers of minority carriers involved in conduction. This drastically reduces minority carrier lifetime and causes the module to lose 1% to 3% of its rated power within the first week of operation. Beyond changes to the internal crystal lattice, the polymer encapsulation materials on the module's surface (such as EVA film) undergo photochemical degradation and chain scission after long-term exposure to high-energy ultraviolet (UV) radiation.
According to photovoltaic reliability studies by the National Renewable Energy Laboratory (NREL), the decrease in the transmittance of the polymer encapsulation layer caused by UV rays leads to an annual short-circuit current (Isc) loss of approximately 0.15% to 0.2% over the module's 25-year life cycle. The yellowed film acts like tinted glasses, blocking specific wavelengths of visible light from reaching the cell surface.
Current Leakage
Modern large-scale grid-tied solar systems are typically designed with string voltages of 1000V or 1500V DC to minimize line losses and improve inverter operation efficiency. This extreme system potential difference creates an incredibly strong stray electric field between the semiconductor solar cells inside the module and the externally grounded aluminum alloy frame.
Driven by the high-voltage electric field, sodium ions (Na+) contained in the photovoltaic glass panels gradually penetrate the encapsulation film, migrating violently toward the negative potential. When a massive amount of cations accumulates on the Anti-Reflective Coating (ARC) of the cell surface or even penetrates the PN junction, it leads to severe localized leakage current phenomena, greatly destroying the insulating properties of the semiconductor devices.
The International Electrotechnical Commission (IEC) points out in the IEC 62,804 standard that system-level high potential differences drive the accumulation of impurities like sodium ions, triggering severe Potential-Induced Degradation (PID). For modules lacking anti-PID treatment, operating in high-humidity and high-voltage environments for several months can result in an output power drop of over 30%, significantly lowering the Fill Factor of the grid-tied system.
Thermal Stress
Outdoor solar arrays experience extreme temperature cycles every day, with a massive disparity between the cold of early morning and the intense heat of the midday sun. A standard solar module is a complex multi-layer composite structure containing tempered glass, ethylene-vinyl acetate (EVA), crystalline silicon cells, tin-plated copper interconnect ribbons, and a polymer backsheet.
The physical properties of each material are entirely different, particularly their Coefficients of Thermal Expansion (CTE), which exhibit highly significant differences. While absorbing solar radiation and heating up rapidly during the day, the materials expand at different rates; when temperatures plummet at night, they contract at different rates. High-frequency dimensional changes over years and months accumulate massive mechanical and shear stress at the interfaces of different materials within the module.
Long-term reliability testing by the Fraunhofer Institute for Solar Energy Systems (Fraunhofer ISE) in Germany shows that after thousands of transitions between extreme high and low temperatures, the mismatch in thermal expansion coefficients between the copper ribbons (CTE approx. 16.5 ppm/K) and the silicon wafers (CTE approx. 2.6 ppm/K) generates extremely high fatigue damage accumulation at the interfaces. This ultimately leads to micro-fractures in solder joints or busbar peeling, causing the module's internal series resistance to climb continuously.
Moisture Ingress
Although panels undergo high-temperature vacuum lamination and aluminum frame silicone sealing before leaving the factory, physically blocking moisture penetration entirely over a quarter-century of exposure to the elements is impossible. Polymer backsheet materials have a measurable Moisture Vapor Transmission Rate (MVTR). Over time, ambient humidity slowly and continuously penetrates the laminate via the backsheet or through aging micro-cracks in the frame's silicone seal.
The ingress of moisture triggers a series of irreversible electrochemical corrosion reactions. The metallic grid lines on the surface of the cells are primarily made of sintered silver paste, while the interconnect ribbons between cells are rich in tin and lead. Under the dual action of water molecules and electric fields, these metallic materials are highly susceptible to oxidation-reduction reactions.
Under the combined effects of moisture and heat, the ethylene-vinyl acetate (EVA) encapsulation layer undergoes a hydrolysis reaction, continuously releasing free acetic acid. This highly concentrated acidic microenvironment exponentially accelerates the corrosion of the silver contacts on the grid lines, increasing contact resistance and permanently reducing current output capacity.
Minor Physical Damage
The physical thickness of crystalline silicon itself is typically only about 160 to 180 microns—thinner than the combined diameter of two human hairs—giving it an extremely brittle physical nature. In real-world physical environments involving transportation, trampling during installation, wind load vibrations, and the heavy weight of winter snow, microscopic cracks invisible to the naked eye silently form inside the silicon wafers. Initial hairline fractures usually do not cause a cliff-like drop in power generation immediately, as the conductors still maintain weak physical contact.
On-site dynamic mechanical load tests (such as wind pressure cycling under the IEC 62,782 standard) reveal that even initial microcracks only a few microns wide will continuously propagate under decades of wind pressure vibrations. The expanding cracks eventually completely sever the electron transport pathways, leading to electrical isolation of local cell areas and the formation of irreversible "Dead Zones," heavily shrinking the entire panel's power output.
ROI
Crunching the Numbers
Taking a standard residential quote in the North American market as an example, the comprehensive installation cost fluctuates between $2.80 and $3.50 per watt. Assuming a typical single-family home installs a 10-kilowatt (kW) system on its roof, the base quote will total around $30,000.
The federal Investment Tax Credit (ITC) policy allows taxpayers to deduct 30% of the total system cost when filing taxes. After deducting the tax break, the actual out-of-pocket net investment drops to $21,000. Dividing the total initial investment by the estimated total power generation over the system's 25-year life cycle yields a very clear Levelized Cost of Energy (LCOE).
While the LCOE for large utility-scale solar power plants has fallen to the $0.03 to $0.05 per kWh range, residential systems, constrained by scale effects, generally land in the $0.06 to $0.09 per kWh range. Compared to municipal grid retail electricity prices, which routinely run from $0.15 to $0.30 per kWh, physical-level photoelectric conversion possesses extremely high financial viability mathematically.
Payback Timeline
If every kilowatt-hour of electricity produced by the system can be immediately consumed by household appliances, it is equivalent to saving the cash that would have been spent buying that same amount of power from the utility company. Assuming a household's average monthly electricity bill is $200, the annual electricity expenditure totals $2,400. A 10 kW solar system with a net investment of $21,000, located in a region with medium solar irradiance, will generate roughly 13,000 kWh annually—enough to cover all of the household's electricity consumption for the year.
Dividing the net investment by the annual savings on the electricity bill ($21,000 divided by $2,400) gives a quotient of 8.75. Around the 8-year and 9-month mark of continuous operation, the initial principal investment will be entirely recovered. Considering that solar panels boast a 25-year warranty and extremely slow physical degradation rates, the system will continue to provide a net profit production window of over 16 years after crossing the breakeven point. Below is a standard return on investment reference table based on average sunlight conditions in North America:
System Capacity (kW) | Pre-Tax Total Price (USD) | Net Price after 30% Tax Credit (USD) | Estimated First-Year Generation (kWh) | Estimated Annual Bill Savings (USD) | Estimated Payback Period (Years) |
6.0 | 18,000 | 12,600 | 8,100 | 1,450 | 8.6 |
8.0 | 24,000 | 16,800 | 10,800 | 1,940 | 8.6 |
10.0 | 30,000 | 21,000 | 13,500 | 2,430 | 8.6 |
12.0 | 36,000 | 25,200 | 16,200 | 2,910 | 8.6 |
Hidden Costs
When building a financial model, you cannot solely calculate one-way static returns. Over the system's quarter-century operational journey, there are long-term maintenance expenses that must be factored into the Profit and Loss (P&L) statement. The crystalline silicon panels on the roof have no moving parts and rarely experience sudden failures. However, the inverter—which converts DC to AC—is packed with electronic modules, like electrolytic capacitors, that are highly sensitive to temperature and lifespan. Standard warranties for mainstream string inverters are mostly set at 10 to 12 years.
The total replacement bill for a brand-new 10 kW string inverter, including the hardware, cable connector updates, and electrician labor fees, usually falls between $1,500 and $2,500. Furthermore, if the roof environment is subject to heavy tree shading, frequent dust storms, or bird congregations, dirt accumulation can block photons and cause power generation to drop by 5% to 10%. Hiring a professional pressure-washing cleaning crew once a year for maintenance will generate an additional service bill of $150 to $300 annually. Amortizing these repair and cleaning costs across every month of the 25 years will push the previously calculated perfect payback period back by several months to a year.
Electricity Rate Variables
According to long-term tracking statistics by the U.S. Energy Information Administration (EIA), residential retail electricity prices in North America have maintained an average annual increase of 2% to 3% over the past two decades. During frequent extreme weather events or severe fluctuations in the fossil fuel supply chain, unit price hikes in certain state power grids can even exceed 10% in a single year. When the constant electricity price turns into an upward-trending compounding variable in the model, the anti-inflationary attribute of a solar system as a fixed asset becomes prominent on the financial statements. The higher the cost of external electricity rises, the greater the equivalent monetary book value of every free kilowatt-hour generated on the roof.
Net Energy Metering (NEM) allows excess power generated during the day to be sold back to the grid at a 1:1 full retail rate, essentially acting as a virtual energy storage cell. However, when utility companies realize that excessive daytime surplus power places a load strain on the grid, policies shift toward a Net Billing model. For instance, California's NEM 3.0 policy drastically slashed the compensation rate for surplus daytime power sold to the grid by over 70%. Selling power to the grid at wholesale prices is completely unviable in financial logic, forcing owners of newly installed systems to spend an extra $7,000 to $10,000 on physical lithium cell storage cabinets to retain power locally for nighttime use, thereby greatly extending the overall capital recovery cycle.
Home Sale Premium
Stretching the timeline across decades, very few families will live in the exact same house for a full 25 years; selling the property halfway through is a highly probable asset disposal event. The solar system fixed to the roof is transferred to the next title holder as an appurtenance to the home. The Lawrence Berkeley National Laboratory (LBNL) conducted large-scale cross-comparative data analyses on real estate transaction records across multiple U.S. states. The statistically significant results confirmed that a fully owned solar system (excluding leased or PPA agreements) can bring a quantifiable premium to a home's appraised value.
When listed on the open market, the appraised book value of a home equipped with a 6 kW solar system will be approximately $24,000 higher than a comparable home in the same neighborhood without any photovoltaic equipment. This asset appreciation effect generated at the real estate transaction terminal allows homeowners to monetize the residual value of the system's remaining lifespan in a lump sum through the home sale premium, even before they have fully recouped their costs through electricity bill savings.