How long do solar panels work?
Solar panels can generally be used stably for 25—35 years, and many product warranties also cover around 25 years;
Industry research shows that the median annual attenuation of modules is about 0.5%, which means that by the 25th year, they usually still retain about 87% of their power generation capacity.
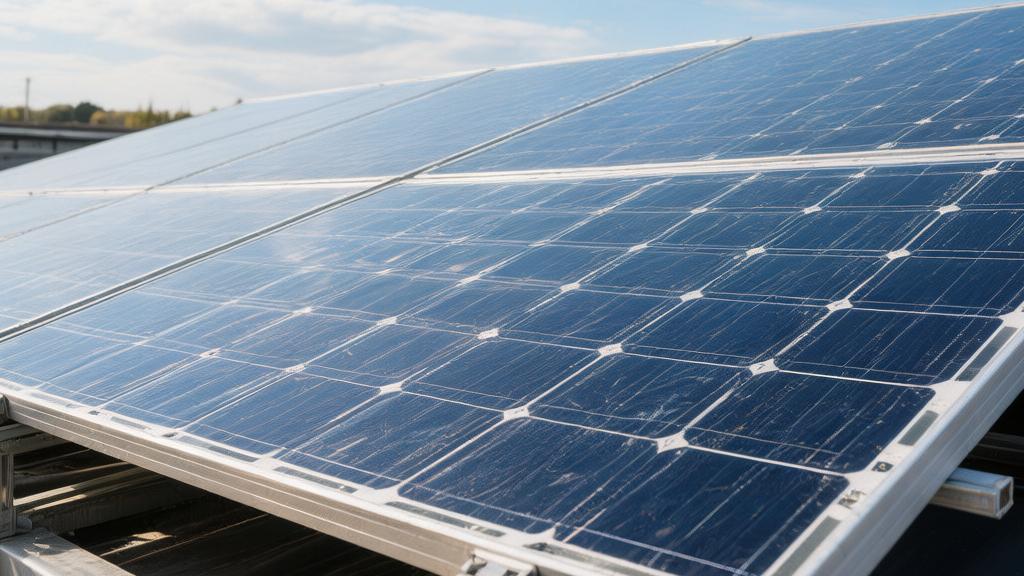
Performance Degradation
Fear of Heat and Roasting
When the actual environmental temperature on the roof breaks the standard test baseline of 25°C, the activity of exciton movement inside the silicon crystal increases. For every 1°C increase in temperature, the real-time output power of the photovoltaic module will generate a negative power temperature coefficient offset of -0.35%.
At high noon in July, when the local peak solar intensity reaches 1,000 W/m², the matte black aluminum alloy frame and deep blue anti-reflective glass panel will quickly push the working temperature of the module backplane to 65°C.
Compared to the ideal power generation conditions of a 25°C laboratory constant temperature chamber, the extreme outdoor high temperature of 65°C will cause a module with a rated power of 500 W to instantly evaporate 14% of its electrical energy output, and its actual grid-connected power generation capacity will quickly fall to the low range of 430 W.
The intense alternation between the direct high temperature of 70°C during the day and the sudden low temperature of 15°C at midnight will generate more than 1,000 severe physical thermal expansion and contraction cycles over a 36-month span, forcing microscopic micro-cracks with a depth of about 0.1 mm on the surface of fragile cells.
The distribution variance of thermal stress caused by repeated pulling will cause the physical series resistance of the silver grid line solder ribbon inside the module to soar by 5%, eating away an absolute gain of 0.8% to 1.2% in the DC-to-AC power conversion of the entire system.
Ultraviolet Rays
Beneath the 3.2 mm thick high-transmittance tempered ultra-white glass on the front of each photovoltaic panel, a layer of Ethylene Vinyl Acetate (EVA) polymer film responsible for vacuum sealing and isolating air moisture is tightly laminated.
After the sun-facing side of the photovoltaic array has accumulated more than 10,000 hours of intense high-energy irradiation with a UV index of level 8 or above, the high-frequency light transmittance of the transparent encapsulation film will turn yellow and decrease by 2% to 3.5%.
Laboratory spectral statistical results showing reduced optical transmittance indicate that the number of high-energy short-wave photons in the 300 nm to 400 nm range blocked by the cloudy glass layer has actually increased by 1.2%, thereby lowering the rated short-circuit current parameters of the individual cells at the source.
Under a high DC system voltage circuit design of 1500 V in commercial power plants, active sodium ions on the surface of the insulating glass will forcibly undergo microscopic free migration toward the negative pole of the circuit in a high relative humidity climate environment of 85%, forming a continuous leakage current with a strength as high as 10 μA at the module frame.
Tracking and monitoring of large-scale grid-connected projects found that such severe Potential Induced Degradation (PID) effects can cause the individual rated output power of a damaged string of modules to experience a precipitous capacity drop of 20% to 30% under extreme high-humidity conditions with continuous heavy rain in summer.
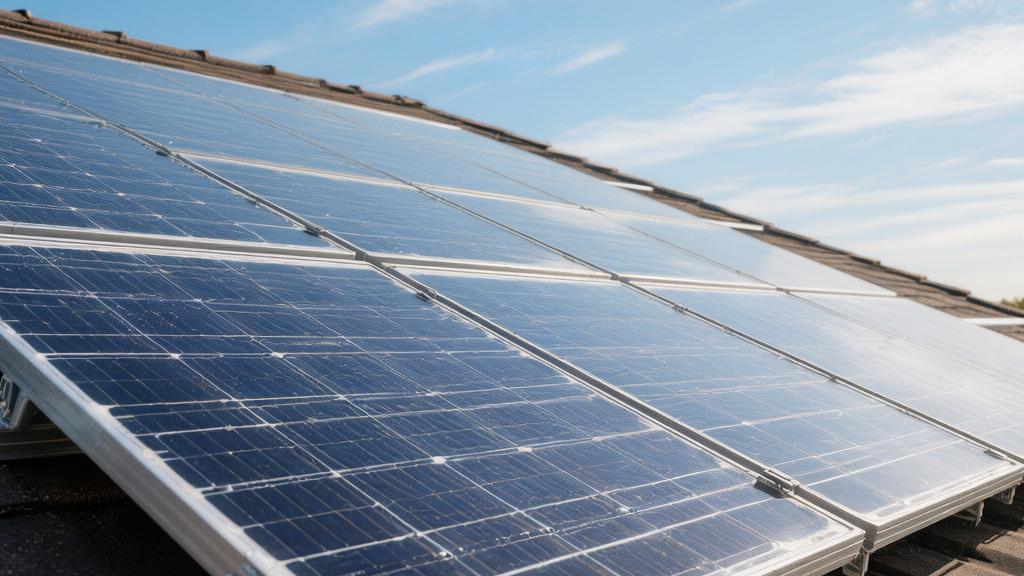
Lifespan Extension Tactics
During the early construction phase of rooftop bracket hardware installation, forcibly reserving a 15 cm physical heat dissipation convection gap between the top surface of the tiles and the backplane of the silicon module can allow the natural flow rate of cold air in the rear air duct to easily reach 1.5 m/s.
A passive Bernoulli effect air-cooling aerodynamic design can lower the maximum operating limit temperature of the panel in July summer by 4°C to 6°C, recovering about 1.5% of additional temperature loss power through physical cooling.
· Equipping each silicon panel independently with a micro-inverter module with 99.8% conversion efficiency can eliminate severe local shading efficiency deviations of 3% to 5% caused by the "barrel effect" of leaf shadows in traditional series busbar systems within a millisecond response.
· The three thermal physical bypass protection diodes standardly equipped inside industrial assembly line modules can forcibly fuse and intercept the malignant decline in the overall current output of the array within a system safety threshold of 33% when facing heavy shading of up to 30% of the surface sensing area by autumn leaves or stubborn bird droppings.
· In inland arid desert high-light areas where the annual average natural rainfall is far below 400 mm, maintaining a manual deep cleaning frequency executed every 90 days, with each operation consuming 5 L of low-conductivity deionized water, can greatly avoid huge grid-connected power generation losses of 7% to 12% caused by long-term accumulation of surface dust and mud.
· Hiring professionals every quarter to use a handheld industrial infrared thermal imager with a measurement accuracy of ±2°C to scan and inspect the entire array can completely prevent the overall annual available capacity index of the rooftop system from experiencing uncontrollable downward data fluctuations of more than 2% once hot-spot short-circuited modules with working temperatures abnormally 15°C higher than surrounding healthy pixel areas are discovered and removed.
The Weakest Link
Replacing the Inverter
String inverters undertake the high-intensity physical conversion task of transforming the 300 V to 600 V continuous high-voltage DC electricity generated by photovoltaic panels into 120 V or 240 V standard AC electricity.
Taking a household grid-connected inverter with a rated power of 7.6 kW and a nominal conversion efficiency of 97.5% as an example, its internal IGBT power module needs to complete millions of high-frequency switching actions every day at a fixed frequency of 60 Hz.
Statistical variance of failure distributions from 5000 residential solar hardware maintenance orders in North America shows that single-phase string inverters at the 75th percentile will experience irreversible hardware physical downtime between the 120th month and the 180th month of grid-connected operation.
After the device's operation age crosses the manufacturer's nominal warranty boundary of 10 years, the random peak shocks of local grid voltage fluctuations combined with the deep thermal fatigue accumulation of local semiconductor modules will cause the annual failure probability of the entire machine to jump from 0.2% when first commissioned to a statistical high of 8.5%.
Purchasing a brand-new 5 kW to 8 kW replacement hardware with the same specifications on the market usually consumes a pure equipment budget of $1,200 to $1,800, plus paying a licensed electrician a labor fee of $80 to $150 per hour for on-site wiring construction.
Capacitors Fear Heat
The physical and chemical degradation rate of industrial-grade aluminum electrolytic capacitors is governed by the Arrhenius empirical equation. For every 10°C increase in ambient operating temperature, the physical volatilization rate of the internal liquid electrolyte doubles, resulting in the expected working time being precisely halved.
Under the roasting of 45°C extreme outdoor air temperature at noon in the peak of July, the local ambient temperature inside the sealed metal casing of the inverter will easily break the physical extreme of 70°C.
After five consecutive summers of full-load high-temperature roasting for a cumulative total of more than 4,000 hours, the actual available capacitance parameters of a DC bus filter capacitor with a rated capacity of 4700 μF will experience an irreversible attenuation rate of more than 20%.
When the value of the equivalent series resistance inside the capacitor undergoes an exponential upward deviation of 300% due to the large-scale drying of the electrolyte, the system will dissipate more than 5% of the effective conversion energy as useless physical waste heat into the air.
Serious errors in internal deep physical parameter indicators will significantly lower the dynamic maximum peak output power of the entire 5 kW photovoltaic array, leading to a 40% increase in the frequency of low-frequency cut-off protection actions of the inverter when the grid AC voltage exceeds the safety upper limit of 253 V.
Batteries Can't Hold On
For a Lithium Iron Phosphate (LiFePO4) home wall-mounted storage cell pack with a physical capacity of 13.5 kWh, its nominal electrochemical charge-discharge cycle life upper limit is usually strictly locked within the standard test sample range of 6,000 to 8,000 times.
Based on a fixed charge-discharge frequency of one 80% depth of discharge per day for an average family, after 3650 days of continuous high-intensity chemical redox reactions, the microscopic crystal structure of the cathode material inside the cell pack will undergo physical collapse.
In the capacity calibration test of the 10th accounting year, the actual maximum available health storage index of the cell bank will irrevocably fall below the 70% level of the factory-rated full charge state.
For a set of household backup lithium cell packs with an initial purchase price as high as $8,500, its Levelized Cost of Storage (LCOS) per kWh of energy storage capacity remains in the economic range of $0.12 to $0.15, which is much higher than the pure photovoltaic power generation cost generated during the same period.
If the ambient temperature of the basement or garage is long-term lower than 5°C or continuously exposed to heat higher than 35°C, the microscopic shuttle migration rate of lithium ions inside the cell will experience a negative correlation deviation of more than 20%, forcibly compressing the single-day available discharge volume by about 1.5 kWh.
ROI
For installing a rooftop grid-connected power generation system with a nominal power of 8 kW, the median average installation price in the North American market in 2025 is $2.85 per Watt.
Multiplying the total system capacity by the unit price parameter, the total initial cost budget for equipment procurement plus manual installation is distributed within a confidence interval of $21,000 to $24,000.
After applying the 30% Federal Investment Tax Credit (ITC) monetary incentive, the homeowner's actual net expenditure will drop to $15,960.
In this statistical sample, hardware costs, including the physical weight of polysilicon panels, inverter volume, and cable specifications, account for 45% of the total cost, while the ratio of applying for grid-connected permits, rooftop load-bearing pressure testing, and manual labor wages occupies the remaining 55%.
The application fees for installation and grid connection from different state utility companies show clear dispersion, with a standard deviation as high as $350, a minimum value of $150, and a maximum value that may break $800.
Offsetting Bills
For a family of four with a living area of 250 square meters, their single-month power grid load flow in summer is usually maintained at 1,200 kWh, with an average annual total power consumption reaching 11,500 kWh.
Based on a basic electricity price settlement of $0.18 per kWh from the local grid provider, the standard annual electricity expenditure for this family is as high as $2,070.
Considering the cyclical fluctuations in fossil fuel prices, the annualized compound growth rate of residential electricity prices in North America over the past decade has consistently remained above the statistical median value of 4.2%.
On an unshaded roof with excellent sunlight conditions, this 8 kW photovoltaic array can stably produce 12,500 kWh of AC electricity annually with a photoelectric conversion efficiency of 18% to 21%, and its actual capacity exceeds the family's basic electricity load by 8.6%.
Excess electrical energy is back-injected into the public grid at a physical transmission rate close to the speed of light, generating a 1:1 kWh billing credit incentive through the Net Metering policy.
Because there is a huge seasonal deviation in the output of solar panels between the peak of July summer and the peak of January winter, the peak daily average power generation frequency in summer can reach 45 kWh, while in winter, due to snowfall and increased cloud thickness, the daily average power value will drop below 12 kWh.
Long-term meter measurement sample analysis shows that the correlation coefficient between the household electricity consumption curve and the photovoltaic power generation output curve is about 0.65, indicating a significant time-mismatch error.
Selling Green Power
Within a specific geographic area implementing a Renewable Portfolio Standard (RPS), for every 1 MWh of clean AC electricity delivered to the public grid, the system can automatically generate a Solar Renewable Energy Certificate (SREC) with legal trading attributes.
This virtual currency asset based on power generation quantity certificates has a market spot trading price influenced by supply and demand, fluctuating violently in a wide range of $30 to $85 year-round.
Based on a stable physical capacity frequency of 12.5 MWh per year, homeowners can frequently sell 12 complete certificate samples to the market annually, thereby obtaining additional cash commission income ranging from $360 to $1,020.
Linear regression analysis of spot market prices over the past five years by a statistical model indicates that as the density of clean energy connected to the grid continues to climb, the forward premium probability of a single certificate is converging and decreasing at a rate of 2.5% per year.
Adding this non-fixed fluid money income into the 30-year financial recovery period calculation, the internal rate of return (IRR) index of the entire power generation equipment can be pulled up by 1.5 to 2.2 percentage points.
To hedge against the risk of falling market prices, investors in large-scale commercial projects usually choose to sign a 10-year fixed-price offtake agreement with a power broker, locking the standard deviation of price fluctuations within a safety precision range of ±5%.
Home Value Increase
Statistical data from the National Association of Realtors covering 100,000 sets of existing property transaction samples shows that independent villas with rooftop photovoltaic assets purchased in full have a listed transaction average price 4.1% higher than the median of equivalent houses without such installations.
For a property valued at $400,000, the absolute amount of this book asset appreciation is equivalent to an actual dollar premium of $16,400, almost 100% covering the net installation budget of the photovoltaic modules in the early stage.
This property appreciation distribution brought about by clean energy attributes is not uniform; in areas with extremely high electricity prices and excellent light intensity, buyers are willing to pay a premium fee of $3,500 to $4,000 for every kWh of rated power generation capacity.
Installing photovoltaic equipment increases the overall physical load-bearing weight of the roof, adding a constant dead load mass of about 15 kg per square meter, but it does not substantially change the internal space volume of the house or the density parameters of the residents.