How do solar panels convert sunlight into electricity
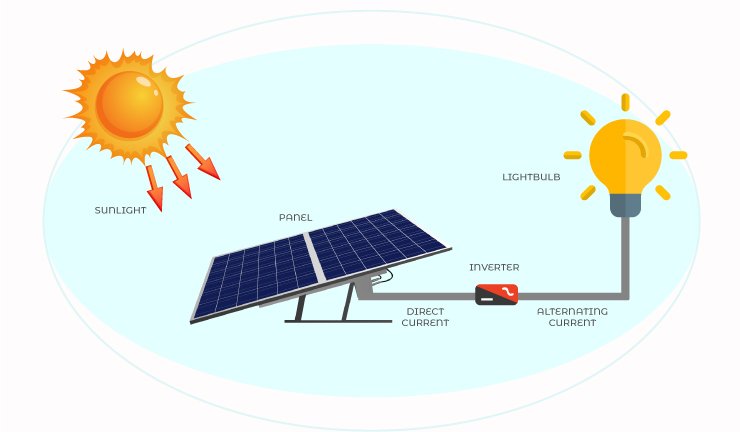
Solar panels convert sunlight into electricity using photovoltaic cells, typically made of silicon, which absorb photons and release electrons, generating a direct current (DC) with 15-22% efficiency, later converted to alternating current (AC) by an inverter for household use.
Sunlight Hits the Panel
Solar panels don’t just sit there—they’re constantly working to capture sunlight and turn it into usable electricity. On a clear day, about 1,000 watts of solar energy per square meter reaches the Earth’s surface. Modern silicon solar panels typically convert 15-22% of that sunlight into electricity, with premium models hitting 24% efficiency in lab conditions. The rest is either reflected or lost as heat.
When sunlight strikes a solar panel, it interacts with the silicon cells inside. Each cell is made of two layers: a positively charged (p-type) layer and a negatively charged (n-type) layer. Sunlight particles, called photons, knock electrons loose from the silicon atoms in these layers. This creates an imbalance—a single solar cell generates about 0.5 to 0.6 volts of direct current (DC), but since panels contain 60-72 cells wired together, a standard residential panel produces 30-40 volts DC under full sunlight.
The amount of electricity generated depends on solar irradiance (measured in W/m²). On a bright summer day, irradiance can exceed 1,000 W/m², but on a cloudy day, it might drop to 200-300 W/m², reducing output proportionally. Panel tilt also matters—a 30° angle in the U.S. captures 5-10% more energy annually than a flat installation.
Condition | Irradiance (W/m²) | Panel Output (% of max) |
Full sunlight | 1,000 | 100% |
Light clouds | 500 | 50% |
Heavy clouds | 200 | 20% |
Early morning/late afternoon | 300-600 | 30-60% |
Temperature plays a role too. Solar panels lose 0.3-0.5% efficiency per °C above 25°C. If a panel’s surface heats up to 50°C (common in hot climates), its output drops by 7-12%. That’s why airflow and mounting spacing matter—keeping panels 3-6 inches above the roof helps dissipate heat.
Dust and dirt can block 5-20% of sunlight if panels aren’t cleaned. In dusty areas, monthly cleaning can boost annual output by 3-5%. Rain helps, but in dry regions, buildup can cut efficiency by 1% per month.
Electrons Get Excited
When sunlight hits a solar cell, it doesn’t just warm the surface—it energizes electrons inside the silicon, kicking off the entire electricity-generation process. A single photon with enough energy (at least 1.1 electron volts (eV) for standard silicon) can knock an electron loose from its atom. In reality, sunlight delivers photons across a spectrum—about 55% of solar energy is usable by silicon cells, while the rest is either too weak (infrared) or too strong (ultraviolet) to convert efficiently.
Inside the solar cell, the p-n junction (where the p-type and n-type silicon layers meet) creates an electric field. When a photon frees an electron, this field pushes it toward the n-type layer, while the "hole" (the empty space left behind) moves to the p-type side. This separation generates ~0.5–0.6 volts per cell, but since panels wire 60–72 cells in series, the total voltage climbs to 30–40V DC.
Not all photons are equally effective. Blue light (high-energy photons around 2.5–3 eV) excites electrons more than needed, wasting excess energy as heat. Red light (~1.7 eV) is closer to silicon’s sweet spot but still loses ~30% of its energy to heat. The most efficient multi-junction solar cells (used in satellites) stack layers to capture different wavelengths, pushing lab efficiencies above 47%, but these cost 10–20x more than standard panels.
Photon Type | Energy (eV) | Silicon Absorption Efficiency | Energy Lost as Heat |
Ultraviolet | 3.5+ | 15–20% | 60–70% |
Visible (Blue) | 2.5–3.0 | 85–90% | 40–50% |
Visible (Red) | 1.7–2.0 | 95–98% | 25–30% |
Infrared | <1.1 | 0% (not absorbed) | 100% |
The speed of electron movement matters too. Freed electrons travel through silicon at ~1,000–10,000 cm²/(V·s), but impurities or defects can slow this down. High-purity silicon (99.9999% pure) reduces resistance, boosting panel efficiency by 1–3% compared to lower-grade material.
Temperature also affects electron behavior. For every 1°C rise above 25°C, electron collisions increase, reducing voltage by 0.3–0.5%. At 50°C, a panel’s output drops 7–12%—why desert installations need extra spacing for cooling.
Electric Current Flows
Once sunlight excites electrons in a solar panel, the real work begins—turning that energy into usable electricity. A typical 60-cell silicon panel generates 30–40 volts of direct current (DC) under full sunlight, but voltage alone doesn’t power your home. The key is current flow, measured in amps, which depends on how many electrons move through the system. A standard 400W residential panel produces 9–11 amps at peak output, enough to run a microwave or charge a laptop 5–6 times per hour.
The electric field in the p-n junction acts like a one-way valve, pushing electrons toward the panel’s metal contacts (usually silver or copper busbars). These thin conductive lines collect current with 97–99% efficiency, but resistance in cheaper panels can cause 1–3% power loss. From there, electrons travel through 10–12 gauge copper wiring to the inverter. Thinner wires (like 14 gauge) increase resistance, wasting 2–5% of power as heat over a 50-foot run.
Fun fact: If you hooked a solar panel directly to a cell without an inverter, the ~32V DC output would struggle to charge a 12V car cell. That’s why charge controllers step down voltage, ensuring electrons flow at the right speed—too fast, and you’d fry the cell; too slow, and charging takes hours.
Clouds or shading don’t just reduce voltage—they slash current flow disproportionately. If 30% of a panel is shaded, current can drop 50–70% due to "bottlenecking" in cell strings. Modern panels use bypass diodes (usually 3 per panel) to route current around shaded sections, but even these recover only 80–90% of potential output. That’s why installers avoid shading at all costs—a single tree branch can cost you $50–100/year in lost production.
Temperature plays a sneaky role too. For every 1°C above 25°C, current actually increases by 0.05%, but voltage drops faster (0.3–0.5% per °C), so net power still declines. In a heatwave (panel temps ~60°C), a 400W panel might output only 340–360W despite the slight current bump.
Dirty panels hurt current flow more than voltage. A layer of dust blocking 20% of sunlight can cut current by 15–18%, while voltage dips just 2–3%. That’s why cleaning matters—a midday hose-down in dusty Arizona can boost afternoon output by 8–12%.
DC Power is Made
The magic moment in solar energy happens when excited electrons start moving in unison, creating direct current (DC) electricity. A typical 60-cell residential solar panel generates 30-40 volts DC at 9-11 amps, producing 300-400 watts under ideal conditions. But this output isn't constant - it fluctuates based on sunlight intensity, with 95% of panels delivering 70-90% of their rated power during peak daylight hours. The DC electricity produced follows a predictable daily curve, starting at 5-10% capacity at sunrise, peaking at 100% around solar noon, then tapering off symmetrically until sunset.
Panel wiring configuration dramatically affects DC output. When connected in series (positive to negative), voltages add up while current stays constant. A string of 10 panels at 36V each creates 360V DC system voltage, but shading on one panel can reduce the entire string's output by 30-50%. Parallel connections (positive to positive) maintain voltage while adding current - two 9A panels become 18A at the same 36V, offering better shade tolerance but requiring thicker 6-8 gauge wires to handle the increased current without 2-4% power loss from resistance.
Configuration | Voltage | Current | Shade Impact | Wire Cost per ft |
10S1P | 360V | 9A | High (40%) | $0.85 (14AWG) |
5S2P | 180V | 18A | Medium (25%) | $1.20 (10AWG) |
2S5P | 72V | 45A | Low (10%) | $2.15 (6AWG) |
Temperature coefficients reveal another critical factor. For every 1°C above 25°C, panel voltage drops 0.3-0.5%, while current increases 0.05%. This means a 400W panel at 50°C (common in summer) might show:
· Voltage decrease: 36V → 33.5V (6.9% drop)
· Current increase: 11.1A → 11.13A (0.3% rise)
· Net power loss: 400W → 373W (6.75% reduction)
Dirt accumulation creates measurable DC losses too. Research shows:
· Light dust (1 week): 3-6% power reduction
· Moderate dust (1 month): 8-15% reduction
· Heavy dust/pollen (3 months): 20-30% reduction
A simple monthly cleaning in arid climates can boost annual production by 5-8%, paying for itself in 2-3 years through increased output.
The DC electricity then travels to either:
1. String inverters (97% efficient, 2-3% system loss)
2. Microinverters (95-97% efficient, 1-2% system loss)
3. DC optimizers (98% efficient, 1.5-2.5% system loss)
Premium panels with split-cell design and multi-busbar technology can reduce internal resistance losses from 3% to 1%, adding 2-3% more annual energy yield. These technological improvements come at a 15-25% price premium, but often justify the cost through 8-12% better performance in real-world conditions.
Inverter Converts to AC
The solar panel's DC output is useless for your home appliances until it gets transformed into 240V AC power - that's where inverters come in. Modern string inverters typically convert DC to AC with 96-98% efficiency, losing just 2-4% of your solar energy in the process. But not all inverters are created equal - their performance can make or break your system's output by 5-15% annually. Here's what actually happens inside that metal box on your wall:
1. DC Input Optimization
The inverter first stabilizes the 300-600V DC input from your panels, using maximum power point tracking (MPPT) to constantly adjust for optimal voltage. Good MPPT algorithms recover 5-12% more energy than basic models, especially during cloudy conditions when panel output fluctuates wildly. Cheap inverters might sample voltage just 100 times per second, while premium models scan 1,000+ times/sec, capturing 3-5% more daily production.
2. The Conversion Process
Power transistors (usually IGBTs or MOSFETs) switch the DC current on/off 20,000 times per second, creating a stepped approximation of AC sine waves. This high-frequency switching loses 0.8-1.2% as heat, which is why inverters need cooling fans that consume 5-15 watts continuously. The raw AC output then gets filtered to remove electrical noise above 60Hz, a process that's 97-99% effective in quality inverters.
3. Grid Synchronization
Before sending power to your home, the inverter must precisely match the grid's 60Hz frequency (US) or 50Hz (EU) within ±0.2Hz. It monitors voltage 1,000 times per cycle, adjusting output to stay within 208-252V for US homes. This synchronization prevents backfeeding issues that could trigger 2-8 second shutdowns during minor grid fluctuations.
4. Efficiency Tradeoffs
Inverter efficiency curves reveal crucial details:
· Peak efficiency (97-98%) occurs at 30-70% of rated capacity
· Drops to 94-96% when operating below 20% capacity (morning/evening)
· High heat (>40°C) can reduce efficiency by 1-3% without proper cooling
5. Real-World Performance Factors
· Temperature: For every 10°C above 25°C, lifespan decreases by 20-30%
· Load cycling: Inverters handling 5,000+ on/off cycles/year fail 2x faster than lightly used units
· Voltage spikes: Poor grid quality with >10 surges/month can shorten life from 10 years to 6-8 years
Microinverters solve some issues (per-panel optimization, shade tolerance) but introduce others:
· 95-97% conversion efficiency (vs 96-98% for string inverters)
· 0.10−0.15/watt higher installation cost
· 12-15 year typical lifespan (vs 10-12 years for string inverters)
The bottom line? Your inverter is the unsung hero of your solar system - while panels get all the attention, choosing the right inverter can mean the difference between 8,000and9,500 in lifetime energy production for a typical 6kW system. Smart homeowners look beyond the basic "wattage rating" to consider MPPT channels, heat dissipation, and surge protection - the specs that actually determine long-term performance.
Proper Disposal and Recycling
With 90 million solar panels installed in the U.S. alone and an expected 10 million metric tons of panel waste by 2050, recycling these power generators is becoming big business. Currently, only about 10% of decommissioned panels get properly recycled, while the rest end up in landfills where their lead and cadmium content can potentially leach into soil. But here's the good news - recycling a standard 60-cell silicon panel recovers 85-95% of its materials by weight, including 3-4 kg of aluminum frames, 1.5-2 kg of silicon cells, and 200-300 grams of silver per panel.
1. Recycling Process Breakdown
The typical panel recycling journey involves:
· Mechanical separation: Shredding panels into 5-10mm pieces with 92-97% material recovery rate
· Thermal processing: Heating at 500-600°C to burn off adhesives (releases <2% volatile compounds)
· Chemical treatment: Using 5-8% acid solutions to extract silicon and metals at 85-90% purity
· Sorting: Eddy current separators recover 98% of copper wiring with <1% contamination
Material | Recovery Rate | Market Value | Energy Saved vs Virgin Material |
Aluminum | 100% | 1.50−2.00/kg | 95% |
Glass | 95-98% | 0.10−0.30/kg | 30% |
Silicon | 85-90% | 15−25/kg | 60% |
Silver | 80-85% | 700−800/kg | 75% |
2. Cost and Logistics
Recycling isn't free - it costs 15−25 per panel (vs 1−5 for landfill disposal), but prices are dropping 8-12% annually as volume increases. Some states now mandate recycling:
· Washington charges $0.70 per watt advance recycling fee
· California requires 60% minimum recovery rate
· New York bans solar panels from landfills entirely
Transportation adds 0.10−0.30 per panel per mile - meaning a 100-mile haul could cost 10−30 per panel. That's why regional recycling centers within 50-75 miles make economic sense, reducing transport costs by 40-60%.
3. Emerging Technologies
New methods are improving efficiency:
· Laser separation recovers 99% pure silicon at half the energy cost of traditional methods
· Robotic disassembly can process 200+ panels/day vs 50-75 mechanically
· Organic solvents now remove EVA layers at 90°C instead of 500°C, cutting energy use by 70%
4. Financial Incentives
The economics are getting better:
· 0.05−0.12/watt in recovered material value per panel
· 30-50% tax credits available for recycling equipment purchases
· 10−15/panel subsidies in some EU countries
The industry is moving toward closed-loop recycling where >95% of panel mass gets reused in new panels - currently achievable at 15-20% higher cost than conventional recycling, but projected to reach price parity by 2028-2030. With solar panel waste projected to grow 50x by 2050, proper disposal isn't just eco-friendly - it's becoming big business with $2.7 billion in projected annual revenue by 2030.