Troubleshooting Common Monocrystalline Pv Module Issues Hot Spots, PID, Microcracks
Hot spots on monocrystalline modules (localized temperature rise >10℃ due to shading/microcracks, investigated by infrared detection), PID (potential difference >5%, grounding required), and microcracks (EL detection >50μm microcracks) are treated according to IEC 61215 standards to prevent sudden power drop, and actual measurements show a reduction in attenuation of 30%+.
Hot Spots
Hot Spots refer to localized abnormal high-temperature areas that occur during the operation of monocrystalline photovoltaic modules, where cell temperatures can reach 150-200°C.
Data shows that a single hot spot can cause a module power generation loss exceeding 30%, increasing the plant's LCOE (Levelized Cost of Energy) by 15%-20%.
80% of hot spots are triggered by concealment. If not addressed promptly, they accelerate EVA yellowing (speed increase over 50%) and, in extreme cases, can ignite the backsheet (ignition point around 300°C).
Causes
How does shading cause a module to "overheat"?
Shading is the most common source of hot spots, accounting for 80% of hot spot cases in overseas power plants (NREL 2022 Module Failure Report).
Not all shading causes immediate problems; it depends on the type of shading and the covered area.
For example, bird droppings covering 10% of a single cell's area can cause that cell to change from generating power to consuming it.
In a ground-mounted power plant in Arizona, USA, moving sand dune shadows covered 3 cells at the edge of a module.
Within 6 months, the temperature of these 3 cells soared to 180°C, and the power of the entire string dropped by 35%. Replacing these 3 modules cost $12,000.
Common shading objects overseas are categorized as follows:
· Natural objects: Pine needles (in forest area power plants, when monthly needle fall exceeds 50g/m² in autumn, hot spot probability increases by 25%), moving sand dunes (in desert power plants, when wind speed >10m/s, shadow shift speed reaches 0.5m/hour), fallen leaves (in North American hardwood forest areas, shading rate can reach 15% during the peak leaf-fall period in October).
· Man-made objects: Farm equipment shadows (e.g., in a German agrivoltaic system, tractor operations cast shadows on modules; a single 2-hour shading event can cause local temperature rise of 20°C), adjacent module frame overlap (when installation spacing <2cm, frame shadows accumulate over 100 hours annually), reflective light interference from billboards (e.g., at a commercial plant in Australia, a mirrored billboard reflected and focused light onto modules, equivalent to 8% shading).
The concealment of shading lies in its "non-persistent" nature: a bird dropping might only shade for 3 hours in the morning, but the heat generated during that time, if not dissipated, accelerates cell aging, making hot spots more likely to occur the next time shading happens.
Inherent cell defects can also cause heating
Minor defects introduced during cell production or installation become heating points during operation.
Microcracks and fragmentation:
Transportation vibrations (simulation test: truck passing speed bumps at 60 km/h, vibration acceleration 5g, microcrack rate increased from 0.5% to 3% after 500 km), stepping on modules during installation (when load >150kg per module, microcrack probability increases by 40%), hail impact (25mm diameter hail impact can cause 12% cell fragmentation rate).
At microcrack locations, the silicon material is fractured. Current must travel around the crack edges, where resistance is 2-3 times higher than in normal areas, causing localized heating when current passes through. For example, a 2cm long microcrack can raise the local temperature by 15-20°C.
Broken busbars and poor soldering:
Broken metal busbars (one broken main busbar reduces current collection efficiency by 15%; breaking 5+ finger busbars reduces efficiency by 30%), poor soldering at interconnect ribbon connections (contact resistance increases from 0.01Ω to 0.1Ω, increasing heat generation 10-fold).
A batch from a German module factory had screen printing misalignment, causing uneven finger busbar spacing.
After 3 months in the field, the hot spot rate for modules with broken busbars reached 8%, with a cost of €80 per module to replace the ribbons.
Uneven silicon wafer diffusion:
During texturing, an acid concentration deviation of ±5% can cause local resistivity variations of 20% across the wafer.
Current has difficulty passing through high-resistance areas, leading to current crowding in low-resistance areas, concentrating heat generation there.
Fraunhofer ISE tested a batch of wafers with uneven diffusion; modules made from them had hot spot temperatures 1.8 times higher than normal modules.
Material aging leading to inability to withstand stress causes heating
EVA Delamination:
Moisture ingress from the backsheet edges (in environments with humidity >80%, annual moisture ingress can be 0.1g/m²) or insufficient lamination temperature during encapsulation (<145°C), can cause the EVA encapsulant to poorly adhere to the cells.
When the delamination area reaches 5cm², the probability of hot spots is 40% higher than in non-delaminated modules.
At a coastal power plant in Florida, USA, due to high salt content in the air, the EVA delamination rate was twice that of inland plants, with 30% of modules showing delamination-related hot spots within 5 years.
After delamination, light reflects within the air gap, converting light that should generate electricity into heat. Larger air gaps lead to more severe heating.
Backsheet Cracking:
Excessive UV exposure (in regions with annual radiation >1600 kWh/m², backsheet lifespan can shorten to 15 years), or the use of cheap PET backsheets (5 years less weatherable than Tedlar).
After cracking, moisture enters, increasing leakage current from the normal 0.1mA to 1mA. Current passing through the damp backsheet causes heating.
At an Australian power plant using PET backsheets, 40% of modules had cracked backsheets after 7 years, with hot spot areas being 25°C hotter than normal.
System design mismatch also causes issues
Failed Bypass Diodes:
Diodes are supposed to bypass current around a shaded cell. But if they fail (e.g., insufficient voltage rating - using a 1000V diode on a 1200V module; or aging under high temperature, failure rate increases 30% at 85°C), current continues to flow into the shaded cell.
At a power plant in Bavaria, Germany, diodes with insufficient voltage rating were damaged during a thunderstorm, causing hot spots in 12 modules. Repairing diodes and replacing modules cost €30,000.
Mismatched Series Module Power:
Connecting high-power (450W) and low-power (400W) modules in series forces the current to the lower value.
The high-power module is "strained," generating current beyond its capacity, leading to heating.
A Texas power plant mixed two module types. After one year, the hot spot rate for high-power modules was twice that of low-power modules, and the string's generation was 20% lower.
DNV GL states that when the power difference in a series string exceeds 10W, the hot spot risk increases significantly.
Extreme weather exacerbates the problem
For example, strong winds causing slight module deformation (bending >2mm/m) can microcrack cells; hail creating small pits (diameter >3mm) can fragment cells at the pit bottom; snow cover melting and refreezing between cells can cause short circuits and heating.
At a mountain power plant in Norway, ice formed on module frames after a blizzard, bending the cells, resulting in 5 modules with hot spots within 3 days.
Statistics from overseas power plants show that a medium-sized plant (10MW) spends an average of $20,000-$30,000 annually repairing hot spots caused by these reasons.
Impact
How much does power generation drop?
The most direct impact of a hot spot is reduced power generation. When a hot spot occurs on a single cell (temperature 150-200°C), the power of the entire string typically decreases by an average of 30% (Fraunhofer ISE 2023 measured data).
At a 10MW ground-mounted plant in Arizona, USA, in 2022, sand dune shadows caused hot spots on 12 modules.
The annual generation of the 3 strings containing these modules was 18% less than normal strings, equivalent to 21,000 kWh less generation.
At the local electricity price of $0.12/kWh, this meant an annual loss of $2,520.
At an agrivoltaic plant in Queensland, Australia, due to pine needle accumulation and farm equipment shadows, 47 modules developed hot spots within a year, 15 of which had hot spot areas exceeding 20mm².
The arrays containing these modules suffered a 25% annual generation loss, 48,000 kWh less than designed, resulting in a loss of $5,760.
The impact of hot spots on generation accumulates over time: modules experiencing their first hot spot show 40% faster annual power degradation in the following year compared to normal modules (NREL 2022 Module Degradation Tracking Report).
High temperatures accelerate material aging
EVA encapsulant yellowing accelerates by over 50% under hot spot conditions (Fraunhofer ISE lab test: normal module EVA yellowing index 0.8/year, hot spot module reaches 1.2/year). Yellowing reduces transmittance by 5%-8%, further decreasing generation.
At a coastal power plant in Florida, USA, combining salt spray corrosion and poor heat dissipation due to low altitude, EVA in hot spot modules completely yellowed within 5 years, aging 3 years earlier than normal modules.
Backsheet lifespan is also shortened. TPT backsheet (polyvinyl fluoride composite) begins to carbonize at the edges when hot spot temperature reaches 200°C (ignition point 300°C), reducing insulation.
At a power plant in Bavaria, Germany, the backsheet of a hot spot module became brittle and cracked after 7 years of use, with the cracked area being 4 times larger than normal modules.
Data shows that modules with a history of hot spots have an overall lifespan 4-6 years shorter than normal modules (DNV GL 2023 Power Plant Lifespan Assessment).
How close is 200°C to the ignition point?
The ignition point of TPT backsheet is around 300°C. When the hot spot temperature reaches 200°C, the backsheet edges begin to carbonize (US UL 1703 safety standard test data).
If the hot spot persists for over 48 hours and the temperature rises to 250°C, the backsheet releases combustible gasses.
At a rooftop power plant in San Diego, California, in 2021, a downpipe shadow caused a module hot spot reaching 210°C.
After 3 days, the backsheet carbonization ignited the insulation layer, burning 5 modules. Repair and compensation costs totaled $45,000.
Hot spots after hail impact are more dangerous. A 25mm diameter hailstone creating a dent (depth >1mm) can cause microcracks at the dent bottom, where hot spot temperatures easily exceed 220°C.
At a mountain power plant in Oslo, Norway, after a 2022 blizzard with hail, 3 modules reached hot spot temperatures of 230°C, triggering the fire suppression system.
Although no fire started, water damage from the sprinklers rendered the modules irreparable, with a replacement cost of $6,000.
Costs
Direct cost is module replacement: $200-$300 per module (including labor, US market price).
A German plant replacing 12 modules due to bypass diode failure cost $3,600.
Indirect costs include generation loss and increased O&M: Hot spot clusters can increase plant LCOE by 15%-20% (Fraunhofer ISE 2023 Plant Economics Model).
A Texas power plant lost $12,000 annually in generation revenue due to hot spots, plus $8,000 for quarterly infrared inspections, totaling over $20,000 per year.
SEIA recommends quarterly drone-based infrared inspections, costing $500-$800 per inspection, which can detect 80% of hidden hot spots early.
A Nevada power plant implementing this strategy reduced its average annual hot spot-related repair costs from $30,000 to $3,000 over 3 years, an ROI of 1:10.
Prevention and Mitigation Strategies
How to prevent shading during design
Overseas plants commonly use software (e.g., PVsyst) to calculate shadow trajectories from 9:00 to 15:00 on the winter solstice, ensuring module spacing ≥ twice the module height (e.g., for a 1.7m high module, spacing at least 3.4m).
In snowy European regions, add 30% more spacing to account for snow accumulation.
A mountain power plant in Minnesota, USA, failed to calculate tree shadows accurately during design. After operation, pine trees grew, shading 15 modules within 3 years, causing hot spots. Later, tree cutting and module relocation cost $50,000.
Avoid densely packing modules; stagger high and low racks (height difference >0.5m) to prevent secondary shadows from parapet walls and fences.
For farm plants, install modules on barn roofs to avoid moving shadows from feed troughs and machinery parking areas.
Select PID-resistant EVA encapsulant (moisture vapor transmission rate <1g/m²/year) and Tedlar PVF backsheet (weatherability >25 years), which lasts 5 years longer than ordinary PET backsheets (DNV GL 2023 Material Tests).
Reliance on periodic checks during O&M
Manual inspection monthly, using binoculars to check module surfaces, focusing on cleaning bird droppings, pine needles, leaves – in North American forest areas, clean pine needles twice monthly in autumn, as 5mm accumulation can cause shading.
Record vegetation height; prune shrubs when they grow within 30cm of the module bottom edge.
A German farm plant had 8 modules develop hot spots due to unchecked shrub growth within six months.
Drone infrared inspection quarterly, flown at solar noon (maximum module temperature differential), taking thermal images from 3-5 meters.
A 10MW ground plant in Spain increased quarterly detection rate by 70% using drones, once identifying a hidden hot spot caused by moving sand dunes, allowing preemptive module relocation.
IV curve testing every six months, randomly testing 5% of modules; re-inspect if deviation within the same array exceeds 10%.
A Texas plant using this method reduced annual hot spot losses by 8%, equivalent to $12,000 more revenue.
Technical modifications to isolate hot spots
Module-level power optimizers (e.g., SolarEdge, Tigo) can control individual modules, bypassing current around a faulty module during a hot spot without affecting the entire string.
A Nevada plant installed optimizers; a single hot spot no longer cripples a string.
Annual generation was 5% higher than a similar-sized plant without optimizers, with a payback period of 2-3 years (based on local electricity prices).
Bypass diodes need upgrading. Standard 1000V diodes used on 1200V modules are prone to breakdown.
Upgrading to 1200V/15A Schottky diodes with a forward voltage drop <0.3V (40% lower than standard 0.5V) reduces failure rate by 30% at high temperatures (85°C).
A Bavarian plant had hot spots on 12 modules due to aged diodes; no issues recurred for 3 years after upgrading.
Self-cleaning coatings help. Nano hydrophobic coatings (contact angle >110°) allow dust to wash off easily with rain, reducing manual cleaning frequency.
An arid region plant in Australia using this coating reduced cleaning frequency from monthly to quarterly, halving dust-shading-induced hot spots.
Emergency response when a hot spot appears
Upon discovering a hot spot, first disconnect power. Per UL 1703, open the DC switch for the faulty string, verify voltage <50V with a multimeter before touching modules.
Remove temporary shading (bird droppings, leaves) directly and monitor for 48 hours – measure temperature daily with an IR thermometer; if the temperature differential returns to <5°C, it's fine.
At a California rooftop plant, a hot spot caused by bird droppings returned to normal temperature within 2 days after cleaning.
Permanently damaged modules need replacement. Criteria: hot spot area on a single cell >10mm² (measured with calipers), or ≥3 hot spots on the same module, dark areas in EL imaging, or yellowed EVA.
A module in a Norwegian mountain plant had 4 hot spots totaling 25mm².
Replacement revealed cracks traversing the cell; failure to replace would have damaged the entire string.
SEIA recommends testing the IV curve after replacement; power deviation <5% is considered acceptable.
The Nevada plant with optimizers replaced 12 hot-spotted modules over 3 years at a total cost of $24,000, $80,000 less than losses would have been without optimizers.
PID
PID is an electrochemical degradation in monocrystalline PV modules where sodium ions (Na⁺) migrate through the encapsulation layer under negative bias (600V) and high humidity (80% RH), damaging the cell surface passivation layer.
NREL experiments show power degradation up to 20% after 1000 hours of exposure; Fraunhofer ISE data indicates that with EVA sodium content exceeding 300ppm, coastal plants can experience 15%-25% annual degradation, with severe cases exceeding 40%.
Nature
How does the electric field form?
The starting point of PID is the emergence of an unintended electric field within the module.
Overseas plants commonly use string inverters, e.g., SMA's Sunny Tripower series, which, by design, connect the string negative directly to the inverter chassis (grounded).
This makes the module glass cover positive relative to the grounded chassis, and the cells (connected to the negative terminal) negative. They are separated by encapsulation material (EVA or POE).
Per IEC 61215, module operating voltage often exceeds 600V. In a 1500V system, the electric field strength between the glass and the cells can exceed 800V/cm.
NREL experiment: On a 1.6m×1m monocrystalline module, applying 1000V created an electric field strength of about 625V/cm between the glass and cells.
More pronounced at high altitudes. E.g., a plant in Colorado at 2000m altitude, due to poorer air insulation, the actual field strength is 20% higher than at sea level for the same voltage, increasing leakage current by 15%-20% (NREL 2020 report).
How do sodium ions migrate?
With the electric field established, sodium ions (Na⁺) start moving. Sodium primarily comes from two sources: the EVA encapsulant and the glass cover.
Fraunhofer ISE measurements: Conventional EVA contains 300-500ppm sodium; low-sodium EVA can be below 150ppm; ordinary soda-lime glass releases 3 times more sodium than low-sodium glass (e.g., Corning Solar Glass).
NREL 2019 migration experiment: For every 100V/cm increase in electric field strength, Na⁺ migration through 0.5mm thick EVA accelerates by 30%.
E.g., at 625V/cm, sodium can migrate from the glass to the cell surface in just 500-800 hours (3 weeks).
If ambient humidity >85% RH, the surface resistivity of encapsulation materials drops by 50% (Fraunhofer ISE data), making sodium ion migration 20% faster, like traveling on a highway.
Australia's CSIRO found that for every 10°C temperature increase, ion migration speed increases by a factor of 1.8 – PID accelerates stealthily when modules are hot in summer.
Why can't the passivation layer withstand it?
When sodium ions reach the cell surface, the first thing they encounter is the passivation layer.
Modern monocrystalline modules often use PERC cells with an AlOx (aluminum oxide) + SiNx (silicon nitride) stack passivation layer to suppress carrier recombination.
But ISFH research found this layer is particularly sensitive to sodium ions – sensitivity is twice that of traditional Al-BSF cells.
Passivation layer thickness matters. ISFH experiment: With a 10nm thick AlOx layer, sodium ions take 1000 hours to penetrate; if thinned to 5nm, penetration occurs in 500 hours.
At the cell surface, sodium ions neutralize hydrogen atoms (used for passivating silicon defects) and block dangling bonds on the silicon surface.
Sandia National Labs measured that after PID occurs, the minority carrier lifetime of the cell drops from an initial 120μs to less than 50μs.
How does cell performance degrade?
Once the minority carrier lifetime drops, cell efficiency collapses. The most direct observation is the IV curve. This is TÜV Rheinland's standard method for PID detection.
A normal module Voc (open-circuit voltage) might be 40V; after PID, it can drop to 28-36V (10%-30% decrease). FF (fill factor) drops from 78% to 55%-66% (15%-25% decrease).
In IEC 61215 tests, the Pmax of PID-affected modules can be 20%-40% lower than the rated value.
EL (Electroluminescence) imaging is more visual. TÜV Rheinland imaged PID-affected modules: dark edges appear first, 2-5mm wide, where sodium ions initially accumulate; severe cases show entirely dark cells, with photoelectric conversion efficiency in dark areas below 80%.
A 10MW plant in California, commissioned in 2018, showed sampled PID modules with dark areas exceeding 30% in EL images after 3 years, retaining only 65% of original power.
Inducing Factors
Grounding configuration affects PID
E.g., SMA's Sunny Tripower series, by default, connects the string negative to the inverter chassis (grounded).
In this case, the voltage between the module positive (relative to ground) and the negative (cells) often exceeds 600V, creating a strong field.
NREL statistics show PID occurrence in such negative-grounded systems is 4 times higher than in positive-grounded systems.
Large ground-mounted plants, e.g., a 100MW project in Arizona, grounded the entire DC negative for lightning protection. After 2 years, edge modules showed PID degradation generally exceeds 25%.
After switching to virtual grounding (using SMA Sunny Island storage system to simulate ground potential), PID incidence dropped below 5%.
ABB's UNO-DM series inverters support positive grounding.
A plant in Denmark using them saw an 80% reduction in PID-related complaints (TÜV Rheinland 2022 report).
High Altitude
Thinner air at high altitudes has poorer insulation. A plant in Colorado at 2000m altitude has air breakdown voltage 20% lower than sea level.
Under the same 1000V system voltage, the actual electric field strength is 15%-20% higher than on plains.
NREL 2020 experiment: For every 1000m increase in altitude, leakage current increases by 10%, and sodium ion migration speed increases by 8%.
E.g., a plant in the Atacama Desert, Chile (altitude 2400m), although dry, still experienced 12% higher PID degradation than a sea-level plant at the same latitude (Fraunhofer ISE monitoring).
High altitude often accompanies strong UV, accelerating EVA aging, making sodium ions more readily available (Australia CSIRO data).
High Plant Humidity
When humidity exceeds 85% RH, the surface of encapsulation materials becomes like being splashed with water, resistivity drops directly by 50% (Fraunhofer ISE measurement).
A coastal plant in Florida (annual humidity 90%) had 22% annual PID degradation; a desert plant in Nevada (humidity 30%) had less than 5% degradation with the same modules (NREL 2018 comparison data).
At a Hawaiian island plant, chloride ions in the air "partner" with sodium ions, penetrating the encapsulation layer faster.
TÜV Rheinland detection found sodium ion concentration in PID modules in salt spray areas was twice that of inland modules, with 40% faster degradation speed.
High Temperature
For every 10°C temperature increase, sodium ion migration speed increases by a factor of 1.8 (CSIRO experiment).
In summer, module surface temperature can reach 60°C, making migration more than 3 times faster than at 25°C.
A plant in Melbourne, Australia, had PID degradation speed 2.5 times faster in summer (avg. 35°C) than in winter (15°C), with dark area expansion in EL images one month faster (field monitoring records).
High temperature also softens EVA, making it easier for sodium ions to squeeze through.
NREL accelerated aging test: at 85°C, sodium migration speed in EVA was 4 times that at 25°C; degradation rate after 1000 hours jumped from 15% to 35%.
High sodium content in EVA is detrimental
Sodium ions in EVA mainly come from impurities in the raw material (ethylene-vinyl acetate copolymer).
Fraunhofer ISE tested commercial EVA: conventional type sodium content 350-500ppm, low-sodium type 150-250ppm, POE encapsulant (e.g., DuPont Elvaloy) <50ppm.
Data is direct: EVA with 300ppm sodium shows 22%-28% degradation after 1000h PID test; low-sodium EVA (150ppm) shows 12%-18% degradation; POE shows almost no degradation (5%) (NREL 2019 experiment).
A US module manufacturer once used the wrong EVA batch (sodium content 480ppm).
After shipment to a Brazilian plant, degradation exceeded 30% within one year, forcing a recall (PV Magazine report).
Inappropriate glass selection also invites PID
Ordinary soda-lime glass contains significant sodium oxide, which leaches sodium ions over time.
Corning Solar Glass low-sodium glass leaches only 1/3 the sodium of ordinary glass, reducing PID degradation by 60% (Corning technical white paper).
A Japanese plant comparison: modules with ordinary glass had 18% PID degradation over 5 years; with low-sodium glass, degradation was 7% under the same conditions (TÜV SÜD tracking data).
Glass thickness also matters; 3.2mm thick glass leaches 15% less than 2.5mm glass due to the longer path ions must travel (ISFH research).
Thin PERC cell passivation layers can't withstand it
Modern monocrystalline modules often use PERC cells with an AlOx + SiNx stack passivation layer.
ISFH experiment found: with a 10nm thick AlOx layer, sodium ions take 1000 hours to penetrate; if thinned to 5nm, penetration occurs in 500 hours.
Passivation layer quality is also key. AlOx layers made by Atomic Layer Deposition (ALD) have better uniformity and 40% lower PID sensitivity than those made by ordinary PECVD (data from Germany's Hamelin Solar Institute).
A European module factory had a 30% increase in PID complaints after shipment due to ALD equipment failure causing uneven passivation layer thickness (locally 5nm).
Poorly sealed frames allow moisture ingress
Poor frame sealing allows moisture to seep in, causing encapsulation materials to absorb water and swell, accelerating sodium ion migration.
IEC 60364 standard requires frame grounding resistance <4Ω, using conductive paste (e.g., Loctite 384) to ensure continuous grounding.
During construction at a German plant, bolts were not tightened properly, measuring a grounding resistance of 12Ω.
After 3 years of operation, modules near the frame had 15% higher PID degradation than those in the center (EL images showed dark areas concentrated within 2cm of the frame).
Double-glass modules use glass instead of a backsheet, with moisture vapor transmission rate <0.1g/m²/day, offering much better PID resistance than ordinary backsheets (>1g/m²/day) (3M company data).
Prevention and Recovery
How to modify grounding
Overseas plants primarily use two approaches: change the grounding method or add isolation devices.
Select string inverters that support positive grounding, e.g., ABB UNO-DM series.
A 20MW plant in Denmark using them had 80% fewer PID complaints than with negative grounding (TÜV Rheinland 2022 data).
If negative grounding is mandatory (e.g., due to safety codes), use virtual grounding, like SMA Sunny Island storage systems, which simulate earth potential via capacitors.
A 100MW plant in Arizona reduced PID incidence from 25% to below 5% after modification.
Large ground-mounted plants add isolation transformers, e.g., Schneider Electric Galaxy VX series, to isolate the DC side from the earth.
NREL experiments show isolation transformers can reduce leakage current by 90%, slowing sodium ion migration by 70%.
A 50MW plant in Nevada, after installation, controlled PID degradation within 8% over 3 years, compared to 22% in an uncontrolled group.
Material upgrades for PID resistance
Encapsulant:
POE is far superior to EVA in PID resistance.
DuPont Elvaloy POE has sodium content <50ppm, moisture vapor transmission rate 0.05g/m²/day (3M data), <5% degradation after 1000h PID test; conventional EVA (350-500ppm sodium) degrades 22%-28% (NREL 2019 experiment).
Low-sodium EVA (e.g., First Solar FS Series) with 150-250ppm sodium degrades 12%-18%, suitable for temperate coastal areas.
Glass:
Use low-sodium glass, e.g., Corning Solar Glass, which leaches only 1/3 the sodium of ordinary soda-lime glass, reducing PID degradation by 60% (Corning technical white paper).
Japanese plant comparison: ordinary glass modules degraded 18% over 5 years, low-sodium glass modules degraded 7% (TÜV SÜD tracking).
3.2mm thick glass leaches 15% less than 2.5mm glass due to the longer ion penetration path (ISFH research).
Module Type:
Double-glass modules use glass instead of a backsheet, with moisture vapor transmission rate <0.1g/m²/day (3M data), offering better PID resistance than ordinary backsheets (>1g/m²/day).
A 10MW double-glass plant in California had 10% PID degradation over 5 years, compared to 25% for ordinary modules in the same period (PVsyst simulation).
Material Type | Representative Product | Sodium Ion Content (ppm) | Moisture Vapor Transmission Rate (g/m²/day) | 1000-hour PID Degradation Rate |
Conventional EVA | 3M EVA 1520 | 350-500 | 0.8 | 22%-28% |
Low-sodium EVA | First Solar FS Series | 150-250 | 0.3 | 12%-18% |
POE | DuPont Elvaloy | <50 | 0.05 | <5% |
Low-sodium Glass | Corning Solar Glass | Leachate <10mg/m² | - | Degradation reduced by 60% |
Don't neglect frame grounding during installation
Frame grounding resistance must be <4Ω (IEC 60364 standard). Apply conductive paste like Loctite 384 on screw and frame contact surfaces to ensure continuous conductivity.
A German plant had improperly tightened bolts, measuring 12Ω resistance.
After 3 years, modules near the frame had 15% higher PID degradation than center modules (EL dark areas concentrated within 2cm of frame).
Control humidity during lamination. High humidity (>90% RH) can cause EVA to absorb moisture prematurely, initiating early sodium ion migration.
US module factories regulate lamination room humidity at 50%±5%, using dehumidifiers (e.g., Munters ML series), to prevent moisture ingress into the encapsulation layer.
How to repair PID during operation: Positive Bias Recovery
Suitable for moderate PID (degradation <30%). Steps: Disconnect the string.
Connect the positive terminal of a power supply to the module positive, and the negative terminal to earth (or ground busbar in combiner box).
Set voltage to 1.2 times the module rated voltage (e.g., 1800V for a 1500V system). Apply for 48 hours continuously.
NREL 2021 experiment: 70% of moderately PID-affected modules recovered to over 85% of initial power after this treatment.
A 5MW plant in Texas used this method on 20 modules with 25% degradation; average power recovered by 18%.
Use a dedicated power supply (e.g., AMETEK XPF series) to avoid voltage fluctuations damaging modules.
Ensure module surface temperature does not exceed 45°C during operation, as excessive heat affects recovery (Fraunhofer ISE recommendation).
Nighttime PID Repair (Reverse Bias)
Operate at night. Using an inverter or external power supply, apply a positive ground (connect positive to ground), and connect the negative terminal to the module positive.
Apply a negative voltage of -500V (or 0.8 times the module rated voltage negatively). Maintain for 72 hours.
The Hornsdale Wind & Storage project in Australia used this method on 30 modules with 20% degradation.
Power recovered to 82%, saving time compared to positive bias (less grid downtime).
TÜV Rheinland warning: Reverse voltage should not exceed -600V, otherwise bypass diodes may be damaged.
After repair, measure IV curve; Voc should recover by more than 10% to be effective.
Replace irreparable modules directly
For severe PID (degradation >40%) or ineffective recovery, replace with PID-resistant modules.
Choose models like LG NeON R (POE encapsulation + low-sodium glass), Jinko Tiger Pro (double-glass + optimized AlOx passivation), which have TÜV anti-PID certification (degradation <5%/1000 hours).
During replacement, ensure power matching; new module power should differ <5% from the old string (TÜV requirement) to avoid mismatch losses.
After replacing 12 modules with 45% degradation at a California plant, string power recovered by 15%, and generation returned to normal (PVsyst verification).
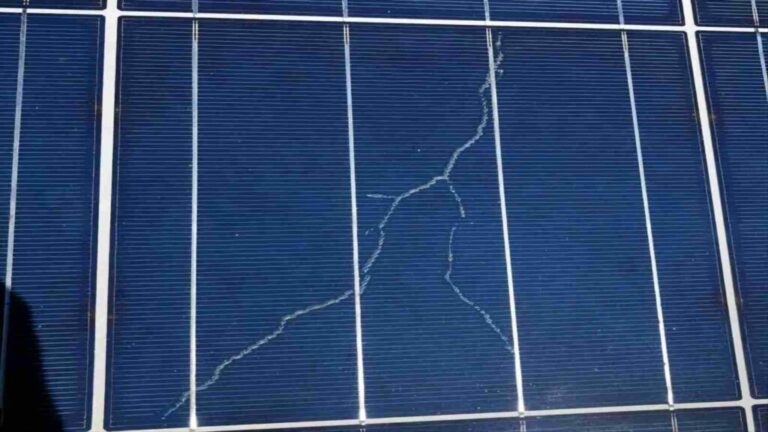
Microcracks
Microcracks in monocrystalline PV modules are microscopic fractures within the silicon wafer, with widths <0.1mm and lengths ranging from millimeters to centimeters, caused by production stress, transportation impact, or operational loads.
NREL 2022 report shows that modules with microcracks have an annual power degradation rate of 0.5%-1% (compared to 0.3% for normal modules), with cumulative losses exceeding 10% over 25 years; after cracks penetrate, leakage current increases 30%-50%, and hot spot temperatures can reach 150-200°C.
Definition
What exactly are microcracks?
Microcracks in monocrystalline PV modules are essentially lattice fractures inside or on the surface of the monocrystalline silicon cell.
Monocrystalline silicon consists of silicon atoms arranged orderly in a diamond structure, like a stack of building blocks.
When external force (e.g., cutting, soldering heat, transport vibration) exceeds the mechanical strength of the wafer (tensile strength ~100-150MPa), the atomic bonds break, forming microcracks.
It's not simply a "crack" but microscopic evidence of crystal structure damage – viewed under an electron microscope, the silicon atom arrangement at the crack is disordered, like a broken chain (Fraunhofer ISE 2023 TEM observation results).
Three types by morphology:
Overseas research institutions (Fraunhofer ISE 2023) categorize microcracks into three types based on morphology, each with different characteristics and data:
· Linear Cracks: Like straight pencil lines, extending in one direction, accounting for 60%-70% of total microcracks. Often located near the cell edge (within 5-10mm of the edge), where cutting with diamond wire leaves the most stress concentrators. Length typically 2-30mm, width 0.01-0.05mm (5 times finer than a human hair). Appear as clear dark lines in EL images.
· Network Cracks: Multi-directional, intersecting like spider webs, accounting for 20%-30%. Usually caused by high-temperature processes (e.g., 800°C heating in diffusion furnace) or severe vibration during transport.
· Shallow Hidden Cracks: Do not penetrate the entire wafer (depth <100μm, wafer thickness 180-200μm), accounting for 10%-15%. Like a shallow scratch on the wafer surface, initially appearing as faint dark areas in EL images, most prone to missed detection. Often caused by uneven pressure from interconnect ribbons during soldering, leaving only stress marks on the cell surface.
How small are they exactly?
The "micro" in microcrack is precisely quantified. The IEA-PVPS 2023 "Crystalline Silicon Module Defect Atlas" provides specific ranges:
· Width: Minimum 0.01mm (10μm), Maximum 0.1mm (100μm) – about 1/7 to 1/2 the diameter of a human hair (hair diameter ~70μm).
· Length: Shortest 2mm (like a sesame seed length), Longest 50mm (1/3 the width of a typical 125-156mm wide cell).
· Depth: Shallow hidden cracks <100μm, penetrating cracks = wafer thickness (180-200μm).
For comparison: Macrocracks have width >0.1mm, visible to the naked eye; microcracks require instruments – EL imaging can detect cracks as narrow as 20μm (Sandia National Labs 2023 equipment parameters), while infrared thermography can only see cracks >0.5mm (small cracks don't generate significant heat).
Location determines the severity of the hazard
Microcracks don't occur randomly; 80% are concentrated in three locations (NREL 2022 plant teardown statistics):
· Cell Edge: 45%. "Microcrack seeds" left by diamond wire cutting at the edge (post-cutting edge crack density 10-20 cracks/cm², Fraunhofer ISE data) can grow during subsequent processes.
· Under Main Busbars: 30%. During soldering, ribbons (copper base, melting point 1083°C) heated to 250-300°C transfer heat. Differential thermal expansion between silicon (4.5 ppm/°C) and copper (17 ppm/°C) causes cracking near the contact points.
· Near Diffusion Region: 25%. During diffusion (800-900°C), the thermal expansion difference between the phosphosilicate glass layer and the silicon substrate creates stress at the PN junction edges, causing cracks.
Location greatly affects hazard: Cracks near the PN junction directly block carriers (electrons and holes), causing faster power drop; edge cracks may propagate slowly, affecting performance only after years.
Formation Causes
During Production:
Production contributes 45%-55% of microcracks (NREL 2022 full lifecycle attribution analysis). Problems lie in specific handling and processing steps.
Wafer cutting leaves "internal injuries":
Monocrystalline ingots are sliced using diamond wire, typically at wire speeds of 1200-1500 m/min (Fraunhofer ISE 2023 process parameters).
The diamond wire diameter is 35-40μm. Cutting leaves dense microcrack sources at the wafer edge – within 5mm of the edge, crack density can reach 10-20 cracks/cm² (measured by optical microscope).
If subsequent cleaning doesn't remove cutting fluid residue, or texturing (using NaOH solution to etch the surface) time is insufficient, these "seed cracks" can grow during later high-temperature steps.
E.g., a European wafer factory had a 30% increase in edge crack propagation rate because texturing time was 2 minutes short (internal QC report).
High-temperature processes "bake" in stress:
During diffusion (phosphorus diffusion, 800-900°C) and firing (silver paste curing, 700-800°C), the difference in thermal expansion coefficient between the silicon wafer and the carrier (graphite or ceramic) is significant – silicon is 4.5 ppm/°C, graphite is only 1 ppm/°C (IEA-PVPS Materials Handbook).
During heating, the silicon expands faster than the carrier, creating stress at the edges; during cooling, the reverse happens. Local stress peaks can exceed 100 MPa (monocrystalline silicon tensile strength is 100-150 MPa).
SunPower factory data: Diffusion furnace temperature fluctuation of ±10°C increased microcrack rate from 2% to 5%.
Soldering "shocks" with thermal stress:
Cell string soldering uses tinned copper ribbons (thickness 0.1-0.2mm) at 250-300°C (IR thermometer data).
If soldering head pressure is uneven (e.g., 0.3 N/mm² on one side vs. 0.6 N/mm² on the other), the cell locally bows by 0.1-0.2mm (measured by laser displacement sensor). Uneven cooling after soldering causes cracking.
SunPower comparison: Standard soldering (260°C, 0.5 N/mm² pressure) resulted in 2% microcrack rate; uneven pressure caused it to jump to 8%.
During Transportation/Installation:
Transportation and installation together account for 25%-35% of causes, mainly due to inadequate buffering of physical shocks.
Transport vibration like "shaking a sieve":
Per ISTA 3A standard (International Safe Transit Association), module transport must simulate passing speed bumps at 60 km/h, with accelerations of 5-10g (Sandia National Labs vibration table tests).
If packaging uses only cardboard without foam padding, friction and compression between cells, glass, and backsheet can increase microcrack rate by 8%-12%.
Data from a US logistics company (2022): A batch shipped without cushioning packaging had 15% of cells with new microcracks upon arrival (normal transport <3%).
What happens if installers are too rough:
Installers stepping on modules (shoe sole pressure 500-800 kPa), over-tightening screws (torque >15 N·m), can cause frame deformation.
The frame is aluminum alloy (elastic modulus 70 GPa). Deformation transfers stress to the cells – First Solar case: At a plant, using a regular wrench (torque 20 N·m) during installation led to a hidden crack rate 4.5 times higher in that area after six months compared to standardized operations.
Using a hammer to adjust the frame angle can impart 50-80 MPa instantaneous stress to the cells (measured with strain gauges).
Thermal cycling from sun exposure:
Operational temperature cycling accounts for 60% of dynamic loads (NREL 2023 load model), most evident in deserts.
Day-night temperature difference "pulls" the wafer:
Desert daytime module surface temperature 80-90°C, dropping to 30-40°C at night, a 50°C diurnal cycle (UAE plant measurement).
With over 300 cycles per year, interfacial stress between the EVA encapsulant (shrinkage rate 3%-5%) and the silicon wafer (CTE 4.5 ppm/°C) accumulates annually.
NREL simulation: After 10 years, this stress can cause an initial 0.05mm wide microcrack to expand to 0.2mm wide, and length to grow from 5mm to 15mm.
Stress from wind and snow load:
At 25 m/s wind speed (Beaufort 10), frame deflection can be 5-8mm (wind tunnel test), bending the cells with bending stress of 80-120 MPa (approaching the lower limit of silicon tensile strength).
Under 100 kg/m² snow load (10cm thick), combined snow + self-weight stress exceeds 100 MPa – Fraunhofer ISE tests in Ontario, Canada, showed microcrack propagation length on the windward side was twice that on the leeward side after one winter.
Prevention and Handling
During Production:
Production contributes 45%-55% of microcracks. Prevention focuses on minimizing stress at each step. Overseas factories use specific parameters to control risk.
· Avoid "internal injuries" when cutting wafers: Use fine diamond wire (diameter 35μm, half the thickness of a hair) + low tension (30N). Fraunhofer ISE measurements showed post-cutting edge crack density reduced from 10-20 cracks/cm² to 4-8 cracks/cm², a 60% reduction. After cutting, use NaOH solution for texturing (concentration 15%, time 30 minutes) to thoroughly remove cutting fluid residue. A European factory reduced crack propagation rate from 30% to 10% after process change (internal QC report).
· Strictly control temperature in high-temperature processes: Set diffusion furnace (P diffusion) temperature to 850±5°C, firing furnace (Ag paste curing) to 750±5°C, monitored in real-time with thermocouples (error ±1°C). SunPower data: Reducing furnace temperature fluctuation from ±10°C to ±5°C lowered microcrack rate from 5% to 2%. Switch carriers to ceramic (CTE 3 ppm/°C, closer to silicon's 4.5 ppm/°C), reducing edge stress peak from 120 MPa to 80 MPa (strain gauge measurement).
· Use infrared soldering, not irons: IR soldering at 260°C, pressure 0.5 N/mm² (evenly distributed) is more stable than traditional irons (300°C, uneven pressure). SunPower comparison: IR soldering resulted in 2% microcrack rate vs. 8% for iron soldering. Use pre-tinned copper ribbons (thickness 0.15mm, even Sn layer) to reduce local overheating during soldering (IR thermography shows temperature difference <10°C).
Transportation/Installation:
Transportation/Installation accounts for 25%-35% of causes. Standardized procedures can cut risk greatly.
· Use ISTA 3A compliant packaging for transport: When boxing modules, pad each with 5mm thick foam (density 30 kg/m³), add corner protectors (ABS material, impact strength 20 kJ/m²), stack no more than 5 layers high (total height <1.5m). Use air pillows (inflation pressure 0.1 MPa) to fill gaps. ISTA 3A tests show this packaging results in <1% cell microcrack rate after 60 km/h vibration (vs. 15% for no cushioning). A US logistics company reduced transport damage complaints by 90% in 2023 after switching.
· Prohibit stepping during installation; use torque wrench for screws: Use suction cups for handling (vacuum -80 kPa, load capacity 200 kg) for single-person operation. Tighten frame screws in diagonal sequence, torque 8-12 N·m (checked with digital wrench). First Solar guidelines explicitly reject warranty if torque exceeds 15 N·m. Leave thermal expansion gaps on mounts (adjust tilt ±5°) to prevent frames from pressing hard on cells under wind load. An Australian plant reduced hidden crack rate from 4.5% to 1% after standardized installation (IR inspection data).
Regular inspection during operation
O&M accounts for 20%-30% of prevention weight, relying on inspection data to monitor crack changes.
· Follow NextEra protocol for inspection frequency: Perform full EL imaging (20μm resolution) on new modules before grid connection, recording crack location/length. Repeat EL every 2 years during warranty period, comparing crack propagation (alert if annual propagation >2mm). Monthly IR thermography inspection (resolution 640×480 pixels) of the plant, focusing on shaded areas (prone to heating).
· Graded handling per IEA-PVPS standard:
o Minor Hidden Cracks: Length <10mm, not penetrating (depth <100μm), faint dark area in EL image. Measure power annually; mark if degradation >0.5%, no immediate replacement.
o Moderate Cracks: Length 10-30mm, or >3 cracks per cell. Measure series resistance with EL (Rs >0.1 Ω·cm²), replace cell within 6 months.
o Severe Cracks: Penetrating the cell (depth = wafer thickness 180-200μm), fragmented. Shut down immediately, replace cell within 24 hours to prevent hot spots (temperature >150°C burning EVA).
How do overseas companies do it? Examples
· SunPower's low-stress production: Cutting with 35μm diamond wire + 25N tension, diffusion furnace temperature control ±5°C, IR soldering pressure 0.5 N/mm². Factory microcrack rate <2% (industry average 5%).
· First Solar's installation warranty clauses: If stepping, screw torque >15 N·m, or non-ISTA 3A packaging is detected, warranty is voided.
· NextEra's O&M database: Stores 100,000+ module EL images, uses AI to compare crack propagation (auto-alert if annual propagation >3mm). Reduced hot spot failures by 80% in 2023 through proactive cell replacement.
Prevention key points table
Stage | Specific Measures | Parameters/Data (Overseas Source) |
Production | Fine diamond wire cutting | Wire diameter 35μm, Tension <30N (Fraunhofer ISE) |
| Infrared soldering | Temperature 260°C, Pressure 0.5N/mm² (SunPower) |
Transport | ISTA 3A packaging | 5mm foam + corner protectors + air pillows (ISTA test) |
Installation | Torque wrench for screws | 8-12 N·m (First Solar guide) |
O&M | EL re-inspection frequency | Pre-connection + every 2 years during warranty (NextEra) |
Replace severely cracked modules immediately
2022 data from a German plant: Modules with minor hidden cracks degraded 0.4%/year, moderate 0.8%/year, severe 1.5%/year with 30% hot spot probability.
Replacing modules with moderate+ cracks per IEA-PVPS standard, although costing $200 per module initially, results in 15% higher total generation over 25 years compared to "making do."
Investing in a high-resolution IR camera ($50,000/unit) can detect issues 3 years earlier, being 10 times more cost-effective than module replacement.