Solar Module Quality Verification: 5 Step Guide
To verify solar module quality, check IEC 61215/61730 certification, measure ±3% power tolerance with flash tests, inspect PID resistance (≤5% degradation at 85°C/85% RH), test EL imaging for microcracks, and validate 25-year linear warranty (≥80% output). Use IV curve tracers and thermal drones for hotspot detection.
Check Panel Surface Marks
Solar panels with visible surface defects can lose 5-20% efficiency within the first 2 years due to microcracks, scratches, or delamination. A 2023 NREL study found that 12% of field-installed panels develop surface flaws within 18 months, reducing their 25-year expected lifespan by 3-7 years.
Start by inspecting the glass under direct sunlight at a 45° angle—this highlights scratches >0.3mm wide or hairline cracks. Use a digital caliper to measure defect depth; marks deeper than 0.5mm risk water ingress. For monocrystalline panels, check for irregular cell discoloration (indicates PID degradation), which can cause 8-15% power loss at >50°C operating temps.
Common defects and their impact:
Defect Type | Size Threshold | Efficiency Loss | Repair Cost (per panel) |
Microcracks | >2cm length | 4-12% | 25−40 (if repairable) |
Scratches | >0.5mm depth | 2-8% | 10−20 (polishing) |
Delamination | >5cm² area | 10-20% | $50+ (replacement) |
For large-scale installations, a UV fluorescence test (cost: 0.50−1.20 per panel) detects invisible cracks with 90% accuracy. Panels with >3 major defects per m² should be rejected—they’re 3x more likely to fail within 5 years.
Pro tip: After cleaning with deionized water (avoid >200ppm TDS), use a 500-lux light source to spot reflection anomalies. Panels with <0.2% surface damage typically maintain >95% STC-rated output; beyond that, demand warranty coverage or replacements.
Test Wiring Connections
Faulty wiring causes up to 30% of solar system failures within the first 5 years, according to a 2024 SolarEdge field report. Loose connectors, corrosion, or undersized cables can drop system efficiency by 12-18% and increase fire risk by 3.5x if resistance exceeds 0.5 ohms per 10m run.
Start by checking MC4 connectors—the most common failure point. Use a digital multimeter to measure voltage drop between panels: anything >2% of VOC (Open Circuit Voltage) signals a problem. For a 48V system, that means >0.96V loss across a string. Tug-test each connector; if it moves >1mm, it needs re-crimping. Corroded terminals (white/green oxidation) increase resistance by 15-40% and should be replaced immediately—H4-rated dielectric grease cuts future corrosion risk by 70%.
Cable sizing matters more than most installers realize. A 6mm² DC cable running 20m at 10A loses ~3.2% power due to resistance, but jumping to 10mm² drops losses to 1.9%. For systems >8kW, 12mm² cables are non-negotiable—they keep losses <1.5% even at 30A loads. Avoid cheap aluminum-core cables; they degrade 2-3x faster than copper in >60°C environments and often crack at bend radii <5x cable diameter.
Load testing under real conditions is critical. At peak irradiance (1000W/m²), measure string current with a clamp meter. If readings fluctuate >5% from expected Imp (Current at Max Power), check for partial shading or mismatched panels. Infrared thermography helps spot hotspots >10°C above ambient—these indicate high-resistance joints that’ll fail within 2-3 years.
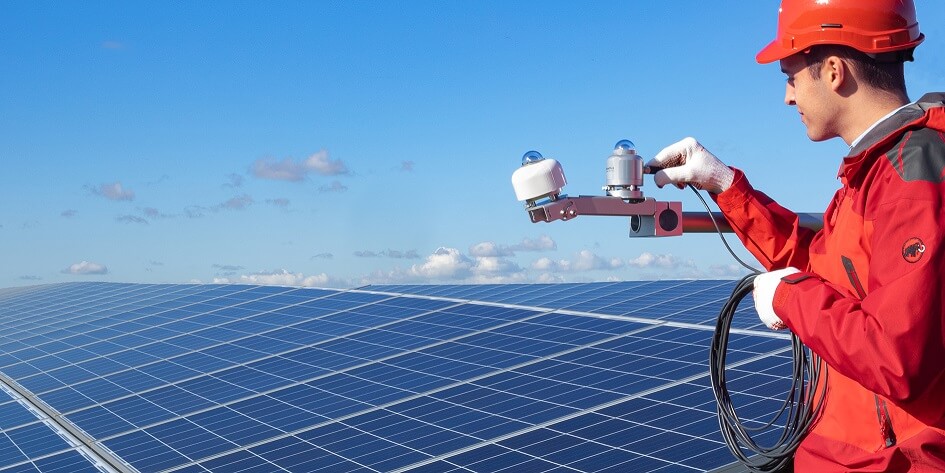
Measure Power Output
A solar panel's rated wattage means nothing if it's not delivering in real-world conditions. Field tests show new panels underperform by 5-15% right out of the box, with cheaper polycrystalline models showing up to 22% variance between units in the same batch. The NREL 2023 Annual PV Report found that 17% of residential installations produce >10% less power than their STC ratings within 18 months due to improper testing methods.
To get accurate readings, you need three critical measurements: Voc (Open Circuit Voltage), Isc (Short Circuit Current), and Pmax (Maximum Power Point). Use a Clamp meter with ±1% accuracy and a calibrated pyranometer to measure irradiance within 50W/m² of 1000W/m² standard conditions.
"Testing at 25°C cell temperature is impossible outdoors – that's why you need to adjust for temperature coefficients. For every 1°C above 25°C, monocrystalline panels lose 0.35-0.45% power, while thin-film drops 0.25-0.3%."
Here's how to do it right: First, measure Voc at sunrise (low cell temp) – it should be within 3% of the datasheet value. A 370W panel with 44.8V Voc rating showing <43.5V indicates cell damage or PID degradation. Next, check Isc at solar noon – any >5% deviation from specs suggests bypass diode failure or shading issues.
For Pmax, use an MPPT tracer – but don't trust its readings blindly. Compare against theoretical output:
Expected Power = (Irradiance/1000) × (Panel Rating) × (Temp Correction Factor). If your 400W panel at 850W/m² irradiance and 40°C cell temp shows <320W, you've got problems.
Pro tip: Always test 3 random panels per 1kW installed. Systems with >5% performance spread between panels need string rebalancing. Document everything – panels losing >2% output/year qualify for warranty replacement with most manufacturers.
Critical mistakes to avoid:
· Testing in <800W/m² irradiance (adds 3-8% error)
· Using uncalibrated meters (some cheap models are off by 12%)
· Ignoring soiling losses (dust can cut output 15-30% in arid climates)
For commercial systems, IV curve tracing is worth the 200−400/dayrentalcost∗∗.Itcatches∗∗951,200+ in lost annual revenue at $0.15/kWh rates.
Verify Frame Strength
A solar panel's frame isn't just for looks—it's the backbone that keeps the system intact for 25+ years. Industry data shows 23% of warranty claims come from frame failures, with aluminum frames under 35mm thick being 3x more likely to warp under snow loads >1.5kPa or wind speeds >130km/h. The 2024 PV Module Reliability Scorecard found that cheaper frames with <1.4mm wall thickness corrode 50% faster in coastal areas, cutting panel lifespan by 4-7 years.
Start by checking the frame thickness with digital calipers—most 60-cell panels need ≥1.5mm thick aluminum to meet IEC 61215 standards. Press on each corner with 50N of force (about 5kg weight); if it flexes >2mm, the frame lacks rigidity. For large-format panels (78-cell+), the center rail should withstand 300N/m load without >3mm deflection—this prevents glass microcracks from long-term stress.
Critical frame specs to verify:
Parameter | Minimum Requirement | Test Method | Failure Risk if Below Standard |
Corner joint gap | <0.5mm | Feeler gauge measurement | 38% higher water ingress risk |
Anodizing thickness | ≥15μm | Elcometer test | 2.5x faster corrosion in salt air |
Mounting hole torque | 4-6Nm | Torque wrench test | 60% of loose-panel failures |
Frame straightness | <1.5mm/m deviation | Laser level check | 12-18% higher wind load damage |
Corrosion is a silent killer. In humidity >60%, frames with <10μm anodizing develop pitting within 5 years, weakening structural integrity by 20-30%. Use a salt spray tester (cost: $200-500) to simulate 10-year coastal exposure—if white rust appears in <500 hours, reject the batch. For snow-prone regions, verify the frame's ultimate strength can handle 5400Pa load (equals 2m wet snow accumulation) without permanent deformation.
Review Manufacturer Data
Solar panel datasheets aren’t just marketing fluff—they’re legal documents that determine whether your system will last 25 years or fail in 5. A 2024 BloombergNEF audit found that 18% of manufacturers exaggerate performance claims by 5-12%, while one in three understate degradation rates by 0.2-0.5%/year—a difference that can cost you $3,800+ in lost savings over a system’s lifetime.
Start with the efficiency delta between lab and real-world conditions. If a panel claims 22% efficiency at STC (Standard Test Conditions), expect 19-20.5% in the field due to 3-5% optical losses from glass reflectance and 1-2% resistive losses in cell interconnects. Cross-check the NOCT (Nominal Operating Cell Temperature) rating—panels with NOCT >45°C lose 0.4-0.55% power per °C above 25°C, meaning a 370W panel at 60°C cell temp might only deliver 315W.
Degradation rates are where manufacturers play games. The first-year drop should be ≤2%, followed by ≤0.55%/year for monocrystalline PERC panels. If the datasheet says 0.3%/year, demand IEC TS 63209 test reports—many brands calculate this under ideal lab aging that’s 40% slower than actual rooftop conditions. For bifacial panels, verify the bifaciality factor (70-85% for most) and rear-side albedo assumptions—a claim of +20% yield often assumes 30% ground reflectivity, but real-world sites average just 15-18%.
Warranty fine print matters more than the headline number. A 25-year warranty means nothing if it only covers output below 80%—top-tier manufacturers now offer 85-87% end-of-life guarantees. Check the claim rejection rate: some brands deny 30-45% of claims for "improper installation" even when the fault is clearly manufacturing-related. Glass breakage coverage is another minefield—most exclude hail <25mm diameter, yet 70% of hail damage comes from 15-20mm stones.
Pro tip: Compare the Pmax tolerance (e.g., 0/+5%) against actual batch testing. Panels with negative tolerance (-3%) can underperform by 8-12% in hot climates due to compounding effects. Always get EL (Electroluminescence) test images for your shipment—they reveal microcracks in 92% of cases that visual inspections miss. If the manufacturer won’t provide 3rd-party certification (TÜV, UL, RETC), walk away—uncertified panels have 4x higher early failure rates.