Solar Module Efficiency: 6 Improvement Methods
Solar module efficiency can be boosted by anti-reflective coatings (increasing light absorption by 3-5%), PERC technology (adding 1% absolute efficiency), and bifacial designs (yielding 10-30% more energy). Optimizing cell interconnection (reducing resistive losses) and using high-purity silicon (99.9999%) minimizes defects, while tracking systems enhance daily output by 25-35%.
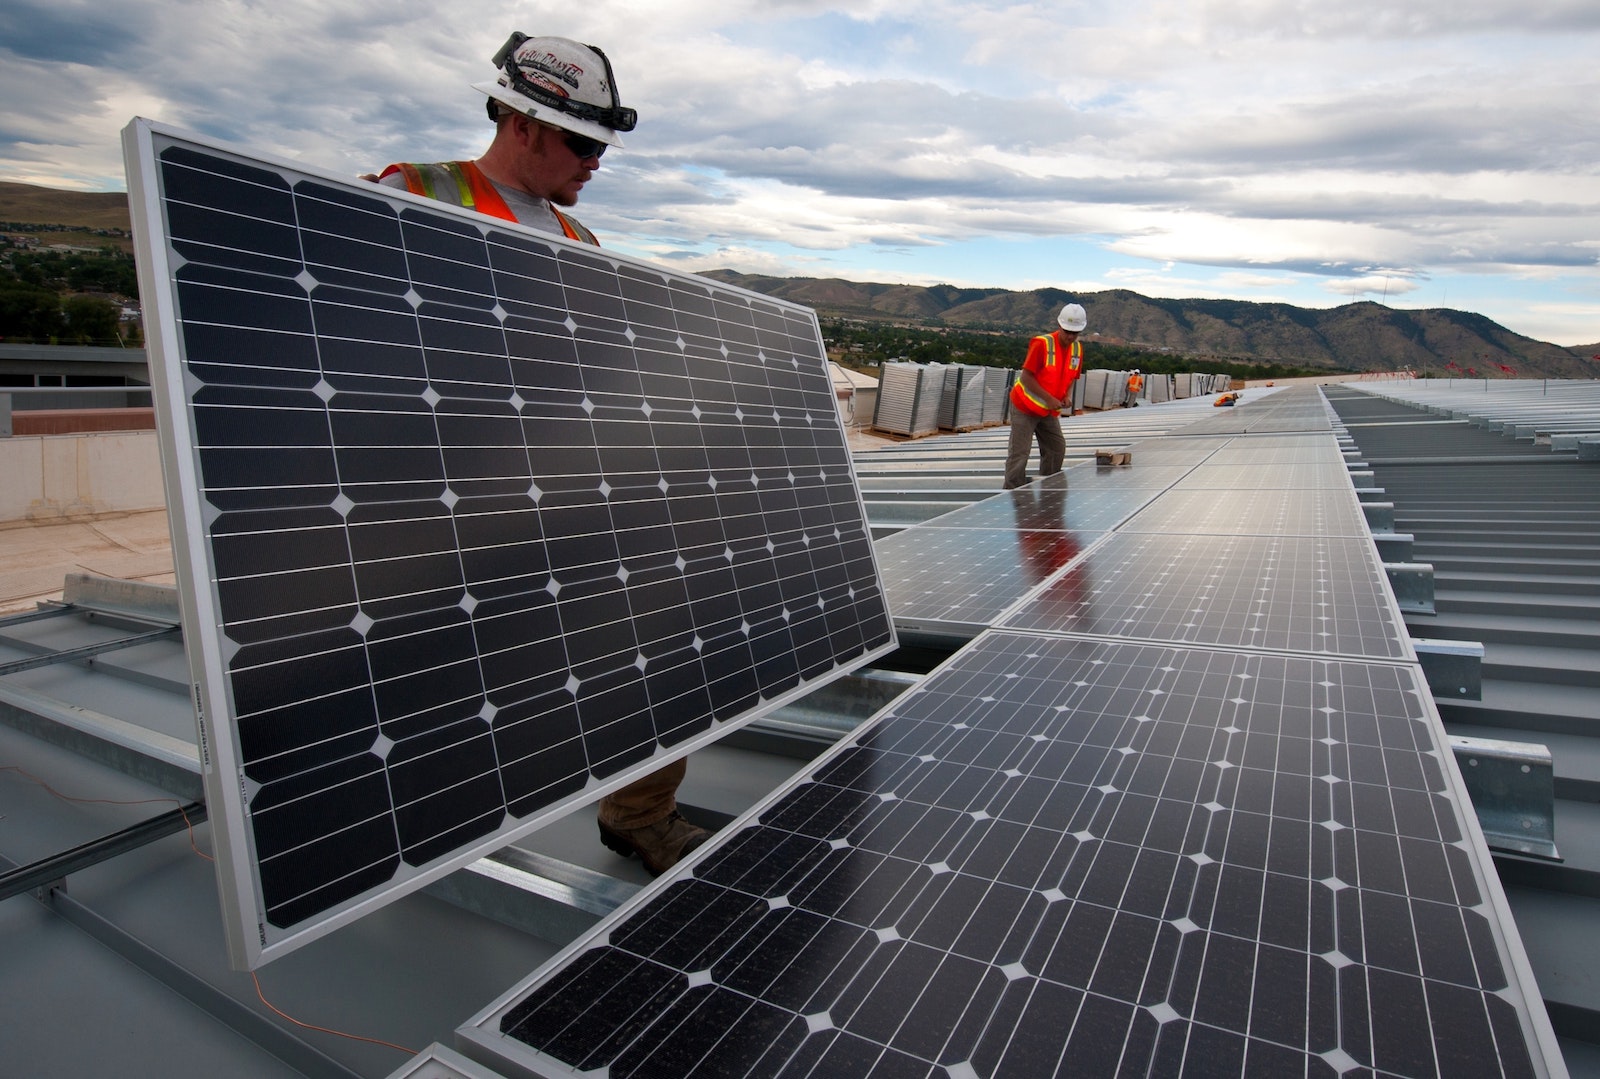
Choose Better Materials
Solar panels aren’t all the same. The materials used directly impact efficiency, cost, and lifespan. Monocrystalline silicon panels, for example, typically deliver 20-22% efficiency, while polycrystalline variants average 15-17%. Thin-film panels, though cheaper, often fall below 13% efficiency and degrade faster—losing about 1% per year compared to silicon’s 0.5%. If you want the best long-term performance, material choice matters.
The most efficient commercial panels today use N-type monocrystalline silicon with TOPCon (Tunnel Oxide Passivated Contact) technology, reaching 24-25% efficiency in lab conditions. These outperform standard P-type cells, which suffer from higher light-induced degradation (LID) of 1-3% in the first 1,000 hours. N-type cells also last longer, with annual degradation rates below 0.4%, meaning they retain 90% output after 25 years instead of the typical 80-85% from older tech.
Cost is a factor—premium N-type panels cost 10-15% more upfront than P-type, but the higher energy yield (5-8% more per year) means they pay back faster in sunny regions. For example, a 10 kW system with N-type panels might produce 1,500 kWh more annually than P-type, saving 180/yearat0.12/kWh. Over 25 years, that’s $4,500 extra—easily covering the initial price difference.
Thin-film panels (like CIGS or CdTe) are cheaper (0.50−0.70/W vs. 0.80−1.20/W for silicon) but need 20-30% more space due to lower efficiency. They work best in large commercial setups where space isn’t a constraint. However, their temperature coefficient (-0.2% to -0.3%/°C) is better than silicon (-0.3% to -0.5%/°C), making them slightly more efficient in hot climates.
Bifacial panels, which capture light on both sides, add 5-15% extra output when installed over reflective surfaces (e.g., white roofing or gravel). They cost 5-10% more but can boost ROI in high-albedo environments.
For maximum durability, look for panels with robust frames (anodized aluminum, 35-40 mm thick) and tempered glass (3-4 mm, with anti-reflective coating). Cheap frames warp under wind loads above 2,400 Pa, leading to microcracks that cut efficiency by 5-10% over time.
Reduce Energy Loss
Even the best solar panels waste 5-25% of potential energy due to inefficiencies in wiring, shading, heat, and system design. For example, a 10 kW system losing 15% efficiency effectively operates at 8.5 kW, costing **300+peryear∗∗inmissedsavings(assuming0.12/kWh). The good news? Most losses are fixable with smart adjustments.
1. Shading & Mismatch Losses
Partial shading from trees, chimneys, or debris can slash output by 30-50% on affected panels. Even a 10% shaded area on one panel in a string can drag down the entire array’s performance due to module mismatch. Microinverters or DC optimizers fix this by isolating underperforming panels, recovering 10-25% lost energy.
Solution | Cost Increase | Energy Recovery | Payback Period |
DC Optimizers | 0.10−0.20/W | 10-15% | 3-5 years |
Microinverters | 0.20−0.30/W | 15-25% | 4-7 years |
String Inverters (baseline) | - | 0% | - |
2. Wiring & Resistance Losses
Thin or long cables increase resistive losses, wasting 2-5% of power as heat. Upgrading from 10 AWG to 8 AWG wiring reduces resistance by ~20%, saving 1-2% more energy per year. For a 10 kW system, that’s 100-200 kWh/year—worth 12−24 annually. Keep wire runs under 50 ft where possible, and use copper (not aluminum) for lower resistance.
3. Heat & Voltage Drop
Solar panels lose 0.3-0.5% efficiency per °C above 25°C. On a 45°C summer day, that’s 6-10% lower output. Mounting panels 6+ inches above the roof improves airflow, cutting operating temps by 5-10°C and recovering 2-4% efficiency.
4. Inverter Efficiency Gaps
Cheap inverters operate at 92-95% efficiency, while premium models hit 97-99%. A 3% difference in a 10 kW system means 300 kWh/year—worth $36/year. Hybrid inverters with MPPT (Maximum Power Point Tracking) further optimize voltage, squeezing 1-3% extra yield.
5. Dust & Soiling
Dirt buildup reduces output by 5-15% if panels go uncleaned for 6+ months. In dusty areas, monthly cleaning restores 3-8% efficiency. Automated systems cost 500−1,500 but pay back in 2-4 years for large arrays.
6. System Voltage & MPPT Ranges
Mismatched voltage between panels and inverters wastes 1-3% energy. Ensure your MPPT voltage window (e.g., 200-500V) aligns with panel strings. 12-panel strings at 400V work better than 10-panel strings at 350V, minimizing losses.
Optimize Panel Angle
Getting your solar panel angle wrong can cost you 5-25% of potential energy output annually. For a 10 kW system, that’s 500-2,500 kWh/year—worth 60−300 at $0.12/kWh. The perfect tilt depends on latitude, season, and local weather, but even small adjustments can boost efficiency by 10% or more.
The ideal fixed tilt for year-round production is roughly equal to your latitude (e.g., 30° in Houston, 40° in New York). This maximizes exposure to the sun’s average position, but it’s not always the best for seasonal energy needs. In winter, increasing the angle by 10-15° (e.g., 45° in New York) captures more low-angle sunlight, improving output by 5-10% from November to February. Conversely, a flatter summer angle (latitude minus 10-15°) aligns better with the high sun, adding 3-8% efficiency from May to August.
Location | Year-Round Tilt | Winter Tilt (+10-15°) | Summer Tilt (-10-15°) | Seasonal Gain |
Los Angeles (34°N) | 34° | 44-49° | 19-24° | 8-12% |
Chicago (42°N) | 42° | 52-57° | 27-32° | 10-15% |
Miami (25°N) | 25° | 35-40° | 10-15° | 5-9% |
If manually adjusting panels twice a year isn’t practical, a compromise tilt (latitude ±5°) still recovers 3-7% lost energy compared to a flat roof mount. For example, a 35° tilt in Denver (39°N) instead of 20° (common on many roofs) increases annual yield by 8-12%.
Tracking systems take this further by following the sun’s path. Single-axis trackers (horizontal rotation) boost output by 25-35%, while dual-axis trackers (full sun-following) add 35-45%. But they cost 0.20−0.50/W more than fixed mounts, with payback periods of 6-10 years in sunny regions. For a 10 kW system, that’s 2,000−5,000 extra upfront but 2,500-4,500 kWh/year extra—worth 300−540 annually.
Roof vs. Ground Mounts also matter. Roof angles are often fixed at 18-30°, which can be 10-20% less efficient than an optimized ground system. If your roof pitch is 10° in Arizona (34°N), you’re losing 15%+ potential energy vs. a 34° ground mount.
Keep Panels Clean
Dirty solar panels are one of the easiest problems to fix—yet they still cost homeowners 5-25% of their potential energy output every year. In dusty or pollen-heavy areas, a single month without rain can reduce efficiency by 8-12%, and after six months of buildup, some systems lose 15% or more. For a 10 kW array, that’s 1,500+ kWh/year wasted—enough to power an entire household for 1-2 extra months. Bird droppings, tree sap, and industrial grime are even worse, creating "hot spots" that can degrade panels 2-3x faster than normal aging.
The impact varies wildly by location. In Arizona, where dust storms are common, uncleaned panels lose 20-25% efficiency during dry seasons. By contrast, rainy regions like Seattle might only see 3-5% losses since frequent showers provide natural cleaning. But even there, sticky residues from trees or air pollution can still cause 8-10% annual losses if ignored. A simple hose-down every 3 months in moderate climates restores 95% of performance, while arid zones need monthly cleaning to stay above 90% output.
Manual cleaning costs 5−15 per panel if hired out, or just 0.50−2 in water and labor if done yourself. For a 30-panel system, that's 150−450/year professionally—but the 180−540 in recovered energy (at 0.12/kWh) makes it break even or better. The math shifts for large arrays: A 200-panel commercial system might spend 2,000/year on cleaning but regain 4,000+ in electricity. Automated robotic cleaners cost 3,000−10,000 upfront but cut long-term labor by 60-80%, paying back in 4-7 years for installations above 50 kW.
Not all dirt is equal. Dust and pollen reduce light transmission by 1-3% per week in dry climates, but cement dust or fertilizer residue (common near farms) can block 10-15% of sunlight in just 2-3 weeks due to their thicker, reflective coatings. Salt spray near coasts is another silent killer, creating a hazy film that slashes efficiency by 12-18% over 6 months while also accelerating corrosion. Soft brushes and deionized water work best for these stubborn deposits—high-pressure washers risk damaging seals and frames, leading to 5-10% long-term degradation from moisture ingress.
Timing matters too. Cleaning at dawn or dusk avoids rapid drying streaks, which can leave 2-4% shading effects from mineral deposits. Midday washing in direct sun also risks thermal shock—panels at 60-70°C cooled too fast can develop microcracks, cutting lifespan by 3-5 years. For most homeowners, early morning rinses every 8-12 weeks strike the best balance between effort and gains.
Improve Wiring Setup
Most solar system owners focus on panels and inverters but ignore wiring—a mistake that can silently drain 3-8% of your total energy output. Poor wiring causes resistive losses, where electricity converts to heat instead of powering your home. For a 10 kW system, that's 300-800 kWh/year vanishing into thin air—enough to run a refrigerator for 4-6 months. The worst part? Fixing it often costs less than $0.10 per watt, with payback periods under 2 years.
The longer the wire run, the worse the losses. A 100-foot 10 AWG DC cable carrying 40A at 300V loses 2.1% of its power as heat, while 8 AWG cuts that to 1.3%. In large commercial arrays with 500+ ft runs, voltage drop can exceed 5%, forcing inverters to operate outside their MPPT (Maximum Power Point Tracking) range and wasting another 1-3% efficiency. Thicker wires (lower AWG) and shorter paths are the simplest fix—every 10% reduction in wire length saves 0.5-1% in losses.
DC vs. AC wiring also matters. High-voltage DC strings (300-600V) lose 30-50% less energy than low-voltage systems (12-48V) over the same distance. That's why most modern installations use higher-voltage DC wiring paired with string inverters, rather than the old-school 12V cell setups. But there's a tradeoff: 600V+ systems require professional-grade insulation and safety measures, adding 0.05−0.15/W to installation costs.
Connectors are another weak spot. Cheap MC4 clones from online marketplaces have 2-3x higher resistance than UL-certified versions, creating hotspots that degrade 0.5-1% per year. Genuine Amphenol or Staubli MC4s cost 5−10 more per pair but last 15+ years without efficiency loss. Loose or corroded connections are even worse—a single bad joint can waste 5-10% of a string's output while posing a fire risk.
"Infrared thermal scans of solar farms show faulty connectors operating at 50-70°C—20-40°C hotter than normal. Each 10°C rise above ambient cuts connector lifespan by half while increasing resistance by 3-5%."
For ground-mounted systems, direct burial aluminum wiring saves 30-50% in material costs vs. copper but loses 0.5-1% more energy annually. If you must use aluminum, oversize the gauge by 2 steps (e.g., 6 AWG Al instead of 8 AWG Cu) to compensate. Better yet, run wires through UV-resistant conduit, which protects against weathering and rodent damage—two factors that cause 2-4% of solar system failures over 10 years.
Use Tracking Systems
Fixed solar panels miss 25-40% of available sunlight simply because they can't follow the sun's path. That's why solar trackers exist—they tilt panels throughout the day to maintain 90° angles to sunlight, boosting output by 25-45% compared to static mounts. For a 10 kW system, that extra 2,500-4,500 kWh/year means 300−540 in additional savings (at 0.12/kWh). But trackers aren't magic—they cost 0.20−0.50/W more than fixed systems and require 2-3x more space. The question isn't whether they work, but whether they're worth it for your location and budget.
Single-axis trackers (horizontal rotation) are the most popular, adding 25-35% more energy at 15-25% higher upfront costs. They follow the sun from east to west, adjusting panel angles 4-6 times daily to maintain 75-85% peak efficiency versus 55-65% for fixed mounts. In high-irradiation areas like Arizona or Texas, these systems pay back in 5-7 years. Dual-axis trackers go further by also adjusting for seasonal sun height, squeezing out 10-15% additional gains (totaling 35-45% more energy), but their 0.40−0.60/W premium and higher maintenance needs extend payback to 7-10 years.
Tracker Type | Energy Gain | Added Cost | Space Needed | Best For |
Single-Axis | 25-35% | 0.20−0.30/W | +30-50% | Large farms, high sun regions |
Dual-Axis | 35-45% | 0.40−0.60/W | +50-70% | Research/storage-heavy setups |
Fixed Tilt | 0% (baseline) | $0 | Standard | Residential/limited space |
Location drastically affects tracker performance. In Miami (latitude 25°N), single-axis systems deliver 28-32% gains thanks to consistent sun paths, while in cloudy Seattle (47°N), the same hardware might only achieve 18-22% due to frequent diffuse light. Dual-axis trackers struggle most in windy areas—their taller profiles face 3-5x more wind load, requiring heavier foundations that add 0.05−0.10/W to installation.
Maintenance is the hidden cost. Trackers have 10-15 moving parts (motors, sensors, gears) versus zero for fixed mounts, leading to 1-3% annual downtime for repairs. A failed actuator can idle a 50 kW tracker array for 2-5 days, costing 120−300 in lost production. Modern systems use self-lubricating bearings and IoT diagnostics to cut failures by 40-60%, but they still need bi-annual inspections—budget 50−100 per unit yearly.