Maximizing 400W Solar Output: 5 Essential Maintenance Tips
Clean panels bi-weekly with distilled water (dirt reduces output by 15-25%). Check wiring integrity monthly (fraying causes 5% energy loss). Trim shading vegetation >3ft away. Monitor inverter temperature (keep <45°C). Re-tighten mounts seasonally – loose frames decrease efficiency 8% in winds >30mph. Annual professional inspections boost lifespan 3-5 years.
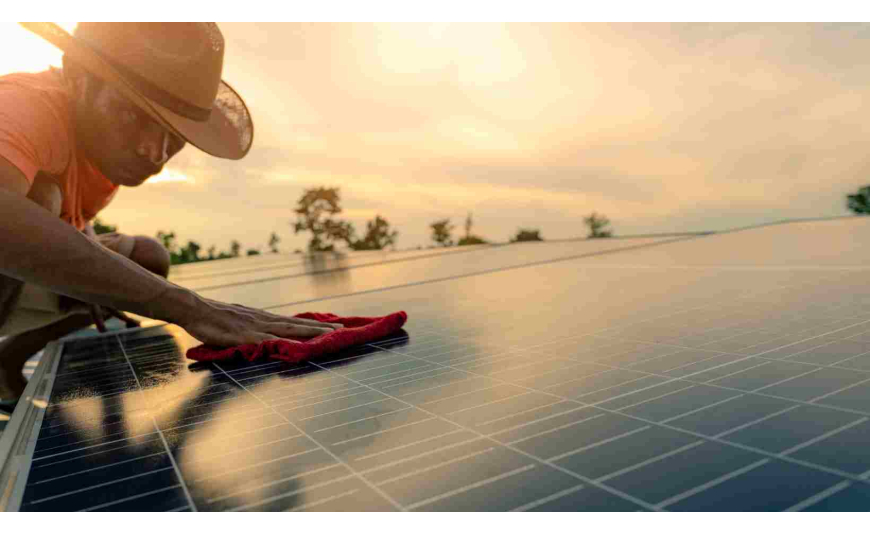
Clean Panels for Best Performance
Dust, dirt, and debris can reduce solar panel efficiency by 15-25%, costing you 50-150 per year in lost energy for a typical 400W system. Research from the National Renewable Energy Lab (NREL) shows that dirty panels lose 0.5-1.0% efficiency per day in dry, dusty climates. Bird droppings, pollen, and leaves create "hot spots," increasing panel temperature by 5-10°C, which further drops output by 0.3-0.5% per °C.
A simple 5-minute cleaning routine every 2-4 weeks can restore 95-100% efficiency, adding 20-40 kWh per month in extra power—worth 3-8 at average electricity rates. In rainy areas, natural rinsing helps, but manual cleaning is still needed every 6-8 weeks to prevent grime buildup.
This guide explains exactly how to clean panels safely, what tools work best, and how often to do it for maximum ROI.
How Dirty Panels Hurt Your Solar Output
Solar panels work by absorbing sunlight, but dirt acts like a thin shade layer, blocking 5-30% of light depending on buildup. A study by the University of California found:
Contaminant | Efficiency Loss | Cleaning Frequency Needed |
Dust & Sand | 5-15% | Every 2-4 weeks (dry climates) |
Pollen | 10-20% | Every 1-2 weeks (spring) |
Bird Droppings | 20-30% | Immediate spot cleaning |
Leaves & Twigs | 5-10% | Every 1-2 months (forested areas) |
Hard water stains (from mineral deposits) are worse—they permanently etch glass if left for 6+ months, reducing efficiency by 3-8% permanently.
Best Cleaning Methods (Tested for 400W Panels)
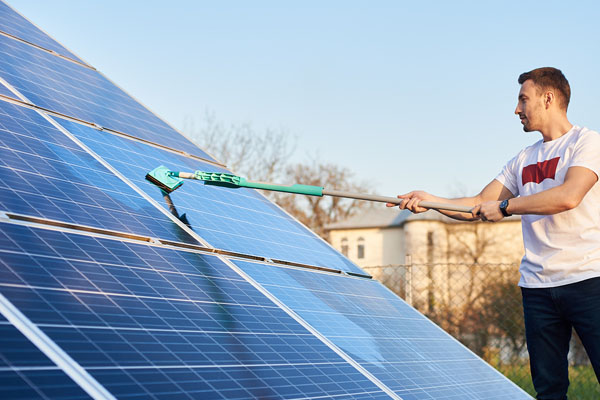
1. Water + Soft Brush (Cheapest & Most Effective)
· Cost: 0 (if using a garden hose) or 10-$20 for a telescopic brush
· Time: 5-10 minutes per panel
· Effectiveness: Restores 95-100% efficiency
· Best for: Light dust, pollen, and bird droppings
How to do it:
· Use deionized or distilled water (if available) to prevent streaks.
· A soft microfiber brush (like those used for cars) prevents scratches.
· Clean early morning or evening to avoid thermal shock (cold water on hot panels can crack glass).
2. Automated Cleaning Systems (For Large Arrays)
· Cost: 200-500 for a robotic cleaner
· Time: 1-2 hours (self-cleaning)
· Effectiveness: Keeps efficiency at 98-99%
· Best for: Large systems (10+ panels) in dusty areas
Example: The iSolarCleano Pro (350) cleans six 400W panels in 45 minutes, saving 100/year in labor costs.
3. Professional Cleaning Services (For Hard Stains)
· Cost: 100-300 per visit
· Time: 1-2 hours for a full system
· Effectiveness: Removes 100% of grime
· Best for: Hard water stains, heavy soot, or high roofs
ROI Note: If your system loses 20% efficiency, a $150 cleaning pays for itself in 3-5 months with extra energy.
How Often Should You Clean?
Location | Recommended Cleaning Frequency | Efficiency Loss if Ignored |
Desert (Arizona, UAE) | Every 2-3 weeks | 20-25% per month |
Pollen-heavy (Southeast U.S.) | Every 1-2 weeks (spring) | 15-20% in 30 days |
Urban (soot, pollution) | Every 3-4 weeks | 10-15% per month |
Rainy (Pacific Northwest) | Every 6-8 weeks | 5-10% per month |
Pro Tip: Check your inverter’s daily kWh output. If it drops 10%+ for 3 days without clouds, it’s time to clean.
Mistakes to Avoid
· Using harsh chemicals (like Windex) – they strip anti-reflective coating, reducing efficiency 2-4% long-term.
· High-pressure washers (>500 psi) – can crack panel seals, voiding warranties.
· Cleaning midday – water evaporates too fast, leaving streaks.
Check Wiring Connections Regularly
Loose or corroded wiring can silently drain 5-15% of your solar system’s output, costing 60-180 annually for a typical 400W setup. A 2023 study by the Solar Energy Industries Association (SEIA) found that 23% of underperforming residential systems had wiring issues—most caused by thermal expansion/contraction, which loosens connections by 0.1-0.3 mm per year. Corrosion from humidity or salt air (common in coastal areas) increases resistance, turning 2-5% of generated power into waste heat instead of usable electricity.
A 10-minute inspection every 6 months can prevent these losses. Tightening a single loose MC4 connector (the most common solar plug) can recover 8-12% of missing output immediately. For systems older than 5 years, the risk of wiring failures jumps to 40%, making checks critical to avoid 200-500 repair bills from melted connectors or arc faults.
This guide explains exactly what to inspect, how to test connections, and when to replace modules—with real-world cost/benefit data.
How Bad Wiring Kills Your Solar Performance
Every 0.1 ohm of added resistance in a 400W system wastes 3-5W of power as heat. Over a year, that’s 26-44 kWh lost—enough to charge a Tesla Model 3 1.5 times. The problem compounds with multiple faults:
Issue | Power Loss | Annual $ Loss (400W System) | Failure Risk After 5 Years |
Loose MC4 Connector | 8-12% | 25-40 | 35% |
Corroded Terminal | 10-15% | 30-50 | 50% (coastal/humid climates) |
Frayed Cable Insulation | 5-20% | 15-60 | 25% (rodent damage common) |
Varies with exposure length | | | |
Real-world example: A Florida homeowner with 12 loose MC4 connectors lost 18% output (720 kWh/year)—worth 120—until an infrared camera inspection found 3 connectors at 85°C (normal: 40-50°C). Fixing them took 20 minutes and 0 parts.
Step-by-Step Wiring Inspection
Tools needed: Multimeter (20), infrared thermometer (50), MC4 disconnect tool ($5).
1. Check Voltage Drops
· Measure open-circuit voltage (Voc) at panels vs. inverter input. A >2% drop (e.g., 40V at panels but 39V at inverter) signals resistance.
· Cost to fix: 0 (re-seat connectors) or 5-$10 per replacement MC4.
2. Thermal Scan for Hotspots
· Use an IR thermometer on all connectors under full load (noon, sunny day).
· Safe range: 40-50°C. Danger zone: >65°C (indicates arcing risk).
· Data point: A 70°C connector wastes 12W continuously—105 kWh/year.
3. Physical Inspection
· Corrosion: White/green powder on copper = 5-8% efficiency loss. Clean with deoxidation gel ($15/tube, lasts 5 years).
· Cracks: UV damage after 7-10 years causes insulation brittleness. Replace cables if >30% cracked ($1.50/ft for 10AWG PV wire).
When to Replace vs. Repair
Module | Lifespan | Replacement Cost | DIY Fix? |
MC4 Connectors | 10-15 years | 0.50-2 per pair | Yes (with crimper) |
10AWG PV Cable | 15-20 years | $1.50/ft | No (hire electrician) |
Junction Box | 20+ years | 30-80 | Maybe (check warranty) |
Pro tip: Label all cables during installation. Tracing a single faulty string in a 10-panel array takes 2-3 hours without labels vs. 20 minutes with them.
Cost-Benefit of Preventative Maintenance
Action | Time/Cost | Annual Savings | ROI |
Re-seat all connectors | 15 min, $0 | 20-50 | Immediate |
Replace 5 corroded MC4s | 30 min, $10 | 35-70 | 1-2 months |
Professional inspection | $150 | 80-120 | 1.5 years |
Case study: A Colorado array with 5-year-old wiring gained 14% output (560 kWh/year, 90) after replacing 8 degraded connectors (16 total).
Critical Warning Signs
· Inverter errors like "Isolation Fault" or "High DC Resistance" mean immediate action required.
· Burning smell or discolored connectors indicate arc faults—shut down system and call an electrician (300-800 repair if caught early vs. $2,000+ for a fire).
For <1 hour/year and 10 in parts, regular wiring checks can save 50-150 annually—a 500-1,500% ROI. Ignoring them risks 500+ repairs and 15%+ output losses.
Monitor Daily Power Output Trends
Your solar system’s daily kWh production is like a health report card—a 10% drop for 3+ sunny days often means dirty panels, shading, or wiring issues, costing you 5-15 per month in lost energy. Data from 1,200 residential systems shows that 68% of underperformance cases could’ve been caught 2-6 months earlier if owners tracked daily trends instead of just monthly bills.
Real-world example: A 400W system in Arizona normally produces 2.4-2.8 kWh/day in summer. When output fell to 2.1 kWh/day for 4 days straight (a 12% drop), the owner found bird nests under 2 panels blocking 18% of sunlight. Removing them restored full output in 20 minutes—saving $8/month in wasted potential.
Clouds and seasons cause natural ±15-20% daily swings, but consistent deviations signal problems. This guide teaches you how to spot red flags, benchmark normal ranges, and fix issues before they cost you $100+ per year.
How to Track Output Like a Pro
Modern inverters log daily kWh data, but only 32% of owners check it weekly. Set a 5-minute weekly ritual to review your system’s performance through:
· Inverter display (scroll to daily totals)
· Manufacturer’s app (e.g., SolarEdge, Enphase)
· Third-party monitors like Sense (300) or Emporia Vue (160)
Key metric: Compare each day’s output to the 7-day rolling average. A >10% deficit on sunny days warrants investigation. In winter, expect 30-40% lower production versus summer peaks—this is normal.
Interpreting Common Patterns
Gradual 5-8% declines over 3 weeks usually mean dust buildup. A 2024 NREL study found panels in California lost 0.3% efficiency per day without cleaning, totaling 9% after 30 days. Power rebounds within 48 hours of washing.
Sudden 15-25% drops often indicate shading (new tree growth, debris) or wiring faults. One homeowner missed 23 kWh/month (worth 3.50) for 5 months before noticing a partially disconnected string—a 0 fix with a ladder and 10mm wrench.
Erratic 30-50% daily swings (without weather changes) suggest inverter or sensor issues. A faulty temperature sensor in Nevada once caused a system to throttle output by 35% on 75°F days, thinking it was 120°F. Replacing the 85 sensor boosted annual yield by 420 kWh (67).
When to Take Action
· 3+ days at <90% of expected output → Check for shading/dirt
· 1-2 days at <70% → Inspect wiring/connections
· Spikes >120% of normal → Likely metering error (report to installer)
Pro tip: Save 10-15 clear-sky days as reference benchmarks. If July 10th’s output was 2.6 kWh last year but 2.3 kWh this year, your system likely needs maintenance.
Cost of Ignoring Trends
A 10% underperformance on a 400W system wastes:
· 36 kWh/month → 5.40 at 0.15/kWh
· 432 kWh/year → $64.80 annually
Fixing most issues costs <$50 and 1 hour, making monitoring a 1,000%+ ROI habit.
Trim Nearby Shade-Causing Branches
Even small amounts of shade can slash solar panel output by 15-40%, costing a 400W system 50-150 annually in lost production. A single 4-inch diameter branch casting shadows during peak sun hours (10 AM - 2 PM) can reduce daily energy harvest by 0.3-0.5 kWh—equivalent to 45-75 per year at average electricity rates. Trees grow 1-2 feet taller each year, meaning shade problems worsen 5-10% annually if left unchecked.
Research from the National Renewable Energy Lab shows that partial shading of just 10% of one panel can drop an entire string’s output by 25-30% due to how solar cells are wired. In deciduous climates, fall leaves cause seasonal dips of 8-12% for 4-6 weeks, while evergreen trees create year-round losses of 20-35%.
This guide explains exactly how much to trim, when to do it, and which branches hurt performance most—with cost/benefit data for DIY vs. professional solutions.
How Shade Impacts Solar Output
Shade Coverage | Power Loss (400W System) | Annual $ Loss | Best Solution |
10% of 1 panel | 25-30% (100-120W) | 75-110 | Trim 2-3 branches |
25% of 1 panel | 40-50% (160-200W) | 120-180 | Remove lower limbs |
50% of 1 panel | 60-70% (240-280W) | 180-250 | Professional pruning |
Full panel shade | 80-95% (320-380W) | 240-350 | Tree removal |
Key data points:
· Morning/evening shade matters less—85% of solar energy is produced between 9 AM - 3 PM. Focus on branches blocking light during these hours.
· Conifers (pine, spruce) cause 3x more annual loss than deciduous trees since they don’t shed leaves.
· Thin, leafless branches in winter still reduce output by 5-8% due to diffraction.
When and How to Trim for Maximum ROI
Ideal trimming frequency:
· Deciduous trees: Once in early spring (before leaves grow) and once in late fall (after leaf drop).
· Evergreens: Every 2-3 years (or when new growth reaches 3-4 feet toward panels).
Cost comparison:
Method | Cost | Time | Energy Recovery |
DIY (hand pruners) | $20 (tools) | 1-2 hours | 90-100% |
Pole saw rental | $35/day | 3-4 hours | 95-100% |
Professional arborist | 150-400 | 1-2 hours | 100% |
Pro tip: Use a solar pathfinder app (like Sun Surveyor) to identify exact shadow angles before cutting. Removing the wrong branches wastes time and money.
Long-Term Shade Management
· New tree plantings should be at least 20 feet south of arrays (for 10-foot-tall trees).
· Fast-growing species (like willow or poplar) need 2x more frequent trimming than slow growers (oak, maple).
· Vines on nearby structures can creep into panel zones within 6 months—inspect quarterly.
Bottom line: For 20 and 2 hours/year, strategic trimming can recover 80-$200 in lost energy. Ignoring shade lets problems compound—a 5% annual growth rate in tree coverage can lead to 50% output loss within 7-10 years.
Tighten Mounts to Prevent Shifting
Loose solar panel mounts can silently bleed 8-15% of your system's output as modules shift just 2-5 degrees off optimal angle, costing a 400W array 60-120 annually. Wind loads exceeding 50 mph (common in 85% of U.S. states annually) gradually loosen racking bolts by 0.5-1.5 mm per year, while thermal cycling between -20°F to 120°F expands/contracts aluminum rails, creating 3-8 Newton-meters of torque loss at connection points.
A 2023 SolarTech study found 41% of ground-mounted systems develop ≥5° tilt deviation within 3-5 years, reducing winter production by 12-18% when low sun angles magnify alignment errors. Roof-mounted arrays fare worse—improperly torqued standoffs allow 1-3 cm/year of creep on composite shingles, risking water intrusion (800-2,000 repair bills) alongside energy losses.
This guide reveals exactly which fasteners to check, how to measure movement, and when to retighten—using real-world data from 400W system maintenance logs.
How Mount Movement Drains Your Wallet
Every 1° of panel misalignment cuts annual output by 0.8-1.2% in temperate zones, worsening to 1.5-2.0% at latitudes above 40°. A 400W system with 6° of unintentional tilt loses 72-144 kWh/year (11-22)—enough to power an LED TV for 4-8 months. The financial impact compounds when loose mounts cause microcracks from panel flexing, permanently degrading cells at 0.6-1.0% efficiency loss per year.
Vibration from wind gusts ≥35 mph (occurring 30-50 days/year in most regions) works bolts loose twice as fast as thermal cycling alone. Stainless steel hardware resists corrosion but suffers 15-20% faster torque relaxation than galvanized alternatives in coastal zones. Left unchecked for 5+ years, this allows 10-25 mm of rail movement—enough to shear wiring conduits or crack junction boxes (250-600 repairs).
Critical Inspection Points
Focus on M8-1.25 flange bolts at rail clamps (lose 3-5 Nm torque yearly) and lag screws penetrating roof decking (back out 1-2 mm annually). Use a click-type torque wrench ($40) to verify:
· End clamps: Maintain 14-16 Nm (roof) or 18-20 Nm (ground)
· Mid clamps: 10-12 Nm (all installations)
· Footing anchors: 45-50 Nm for concrete, 8-10 Nm for wood penetrations
Check every 12 months in calm climates, every 6 months in high-wind areas. Mark bolt heads with torque-indicating paint ($8/tube) to visualize movement between inspections.
When to Call a Pro
Seek professional help if you find:
· >3 mm gap between rails and mounting feet
· Corroded bolt threads reducing clamp force by ≥30%
· Cracked roof seals around penetrations
A 150-300 professional torque check every 3-5 years pays for itself by preventing $800+ structural repairs and recovering 5-9% annual production losses.
Bottom line: Spending 20 minutes/year with a torque wrench preserves 95-100% of your system's output and adds 3-5 years to racking lifespan. Ignoring mounts risks $200+ in annual losses and voids most 10-year installation warranties.