How Does Indirect Sunlight Affect Solar Panel Efficiency?
Indirect sunlight, with scattered photons and lower intensity, reduces efficiency by 15-30% vs direct light (monocrystalline: ~25% drop; thin-film: ~18%) due to fewer electron-hole pairs generated under diffused spectra.
What is Indirect Sunlight
On a typical overcast day, indirect light might provide only 10% to 25% of the power potential compared to full direct sunlight. For example, while a 400W panel under ideal direct sun produces around 400 watts, under thick cloud cover its output can drop to just 40–100 watts. The intensity of indirect light is measured in watts per square meter (W/m²); direct sunlight delivers about 1000 W/m², but indirect light can range anywhere from 50 W/m² to 300 W/m² depending on weather and obstructions.
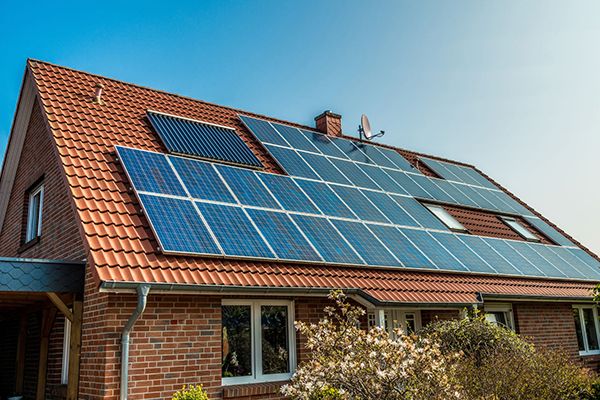
Indirect sunlight is sunlight that has been scattered or reflected before reaching the solar panel. This is different from direct sunlight, which travels in a straight path from the sun. Common causes of indirect light include cloud cover, fog, air pollution, shade from trees or buildings, and seasonal sun angle changes. The energy intensity of indirect sunlight is significantly lower. For instance, on a clear day, direct irradiance measures around 1000 W/m², but under light cloud cover, diffuse irradiance may only reach 300–500 W/m². In heavy overcast conditions, this can fall to 50–100 W/m².
Most silicon panels are rated at Standard Test Conditions (STC), which assume 1000 W/m² of direct light. Under indirect lighting, efficiency decreases. On a cloudy day, a panel might operate at only 10–25% of its rated capacity.
Panel orientation and local weather patterns heavily influence how often a system receives indirect light. For example, in regions with frequent overcast skies, annual energy production may be 20–30% lower than in sunnier climates. Modern solar panels with better low-light performance can reduce this gap. These panels often use half-cut cells or advanced passivation coatings that capture a broader light spectrum, improving yield under indirect light by 3–6% compared to conventional modules. Keeping panels clean and well-tilted also helps maximize exposure to available light, whether direct or indirect. Even a thin layer of dust can block 5% or more of incoming light, further reducing output.
Direct vs. Indirect Light
Direct sunlight delivers full-intensity radiation in a straight path from the sun, typically measuring 1000 W/m² under clear skies. This is the baseline used for panel ratings. Indirect (diffuse) sunlight, on the other hand, is scattered by clouds, dust, or other obstacles. Its intensity varies widely—from 50 W/m² on a heavily overcast day up to 300 W/m² under thin clouds or in early morning light. This difference directly impacts system performance: the same 400W panel that produces 400 watts in direct sun may only yield 40–100 watts in indirect conditions. That’s a 60–90% drop in real-time output, which over a full year can reduce total energy generation by 20–30% depending on location and season.
Feature | Direct Sunlight | Indirect Sunlight |
Light Intensity | ~1000 W/m² | 50–300 W/m² |
Typical Output from a 400W Panel | 380–400W | 20–100W |
System Efficiency | 19–22% (near STC rating) | 5–10% |
Spectral Quality | Full spectrum, peak in visible band | Diffuse, shifted spectrum |
Annual Contribution in Mixed Climates | 60–80% of total yield | 20–40% of total yield |
Direct light provides a concentrated energy input of 1000 W/m², allowing panels to operate near their nameplate capacity—a 400W panel can produce around 380–400 watts. Indirect light delivers significantly less power. Under a uniform overcast sky, irradiance can drop to 100 W/m² or lower, causing that same panel’s output to fall to ~40 watts. This isn’t just about cloud cover; seasonal sun angle plays a major role. In winter, at higher latitudes, the sun’s lower position increases atmospheric scattering, so even on clear days, early morning and late afternoon light is largely indirect, with intensity often below 300 W/m².
Indirect sunlight is more diffuse due to Rayleigh scattering, which reduces the proportion of usable photons that match silicon’s peak response wavelength around 900–1000 nm. This spectral shift can lower conversion efficiency by an additional 3–5% compared to direct light, even at the same irradiance level. Panel technology matters here. Monocrystalline cells, particularly those with PERC or half-cut cell designs, lose less efficiency in low light than polycrystalline panels. A high-quality mono PERC panel may operate at 12–15% efficiency in indirect light, while a standard poly panel might drop to 9–12%.
A system in Los Angeles might get 75% of its annual yield from direct light, while one in London could see 45% or more coming from indirect sources due to frequent cloud cover. To maximize production, installers factor in this ratio. They might recommend tilting panels at a steeper 40-degree angle in cloudy regions to better capture diffuse light from the entire sky dome, not just the sun’s direct path. Even a 5-degree tilt adjustment can improve annual diffuse light capture by 2–4%. Regular cleaning is also critical—a layer of dust can block 5% of already limited indirect light, further reducing output.
Measuring Efficiency Loss
Unlike lab tests under Standard Test Conditions (STC—1000 W/m², 25°C), real environments vary significantly. On a cloudy day, irradiance can drop to 100 W/m², causing a typical 400W panel to output only 40–60 watts—an 85% decrease from its rated capacity. Over a year, systems in frequently overcast regions may experience 15–25% lower total energy production compared to sunnier locations. This loss isn't linear; it depends on panel technology, temperature, and even surface cleanliness. For example, dust accumulation of just 5 g/m² can further reduce output by another 5–8% in low-light conditions, compounding the efficiency drop.
Factor | Impact on Efficiency Loss | Typical Performance Drop |
Low Irradiance (<300 W/m²) | Reduced photon absorption | Output drops by 60–85% |
Cloudy vs. Clear Sky | Diffuse light scattering | Efficiency falls by 10–25% |
Panel Temperature (>25°C) | Increased semiconductor resistance | -0.3% to -0.5% per °C above STC |
Dust/Debris Accumulation | Blocking incident light | 5–15% loss in output |
Angle of Incidence | Non-optimal light capture | 3–10% reduction per 10° misalignment |
Efficiency loss in solar panels is primarily driven by irradiance levels, spectral changes, and operating temperature. Under indirect light, efficiency decreases non-linearly—most sharply below 200 W/m².
For instance, a panel rated at 22% efficiency under STC might operate at only 8–12% when irradiance falls to 200 W/m². This drop occurs because semiconductor cells require a minimum photon energy to excite electrons, and indirect light provides fewer usable photons per square meter.
While indirect light often means cooler panels, any temperature above 25°C reduces voltage output. For every 1°C increase, efficiency drops by approximately 0.3–0.5%. So, even if a panel is in indirect light but at 40°C, it experiences an additional 4.5–7.5% loss compared to STC. Real-world monitoring using I-V curve tracers or smart inverters can track these losses in real-time. For example, a system in Portland, Oregon might show an average efficiency of 16.5% annually due to frequent clouds, while the same system in Phoenix operates at 19.5%.
Panels with PERC or bifacial cells can achieve 3–6% higher efficiency in low light than standard modules. Microinverters also help by optimizing each panel’s output independently, reducing mismatch losses in partially shaded conditions by up to 15%. Regular maintenance, like cleaning panels every 3–6 months, can recover 5–10% of lost output. For accurate long-term assessment, many installers use performance ratio (PR) calculations, which compare actual vs. expected output—a system with a PR of 85% loses 15% of its potential energy due to all combined factors, including indirect light.
Effect of Weather Conditions
Weather is one of the most significant factors influencing daily solar panel output, causing fluctuations that can reduce energy production by 10% to over 60% on a given day. Unlike stable lab conditions, real-world weather involves dynamic changes in cloud cover, precipitation, and atmospheric clarity. For instance, a passing thick cloud can slash irradiance from 1000 W/m² to 100 W/m² in under 10 seconds, causing panel output to plummet by 80–90%. Over a full year, regional climate patterns—like frequent rain or seasonal haze—can lead to 15–30% lower annual energy yield compared to locations with consistently clear skies. Systems in very sunny areas like Arizona average 5–6 peak sun hours daily, while those in cloudy regions like Washington State may see only 2.5–3.5 hours, directly impacting ROI and system sizing.
l Cloud Cover: Thin clouds may reduce irradiance to 300–600 W/m², causing a 30–50% power drop. Thick storm clouds can block 80–90% of light, leaving only 100 W/m² or less.
l Rain: Rainfall itself often reduces irradiance to 100–200 W/m², cutting output by 80–90%. However, rain cleans panels, potentially boosting subsequent output by 5–10%.
l Snow: A light snow cover can block 90–100% of light, but a dusting may melt or slide off, especially on tilted panels.
l Fog & Haze: Reduces light intensity to 200–400 W/m² due to high aerosol scattering, decreasing efficiency by 15–40%.
l Temperature Extremes: While sunny cold days are ideal, hot days above 35°C can reduce efficiency by 0.3–0.5% per °C due to rising panel resistance.
The type and thickness of clouds determine how much light reaches the panels. Cumulus clouds, for example, can cause irradiance to drop to 200 W/m², leading to a 70% decrease in power generation for a standard 400W panel, which might only produce 60–80 watts. Even on a partly cloudy day, rapid fluctuations between sun and shade can cause output to swing by 50% or more within minutes, challenging inverter optimization and grid stability. Over the course of a year, a solar array in a region with 150 cloudy days (like the Pacific Northwest) may produce 20–25% less energy than an identical system in a sunnier climate with only 50 cloudy days annually.
Rain has an immediate negative impact, often reducing output to 10–20% of rated capacity. However, it also washes away dust and pollen; after a rainfall, systems often operate at 5–10% higher efficiency due to cleaner surfaces. Snow is more severe; a 1-inch layer can completely shut down production until it melts or is removed. On the other hand, cold, clear winter days can be highly efficient due to high irradiance and cool panels, sometimes exceeding STC output by 2–3%. High humidity and haze common in tropical or polluted areas scatter light, reducing its intensity to 400–600 W/m² and shifting its spectrum, which can lower panel efficiency by an additional 3–5% even at moderate light levels. To mitigate these effects, designers often oversize systems by 10–20% in less ideal climates and use inverters with wide operating voltage ranges to capture every possible watt under diffuse or weak light conditions.
Panel Angle and Placement
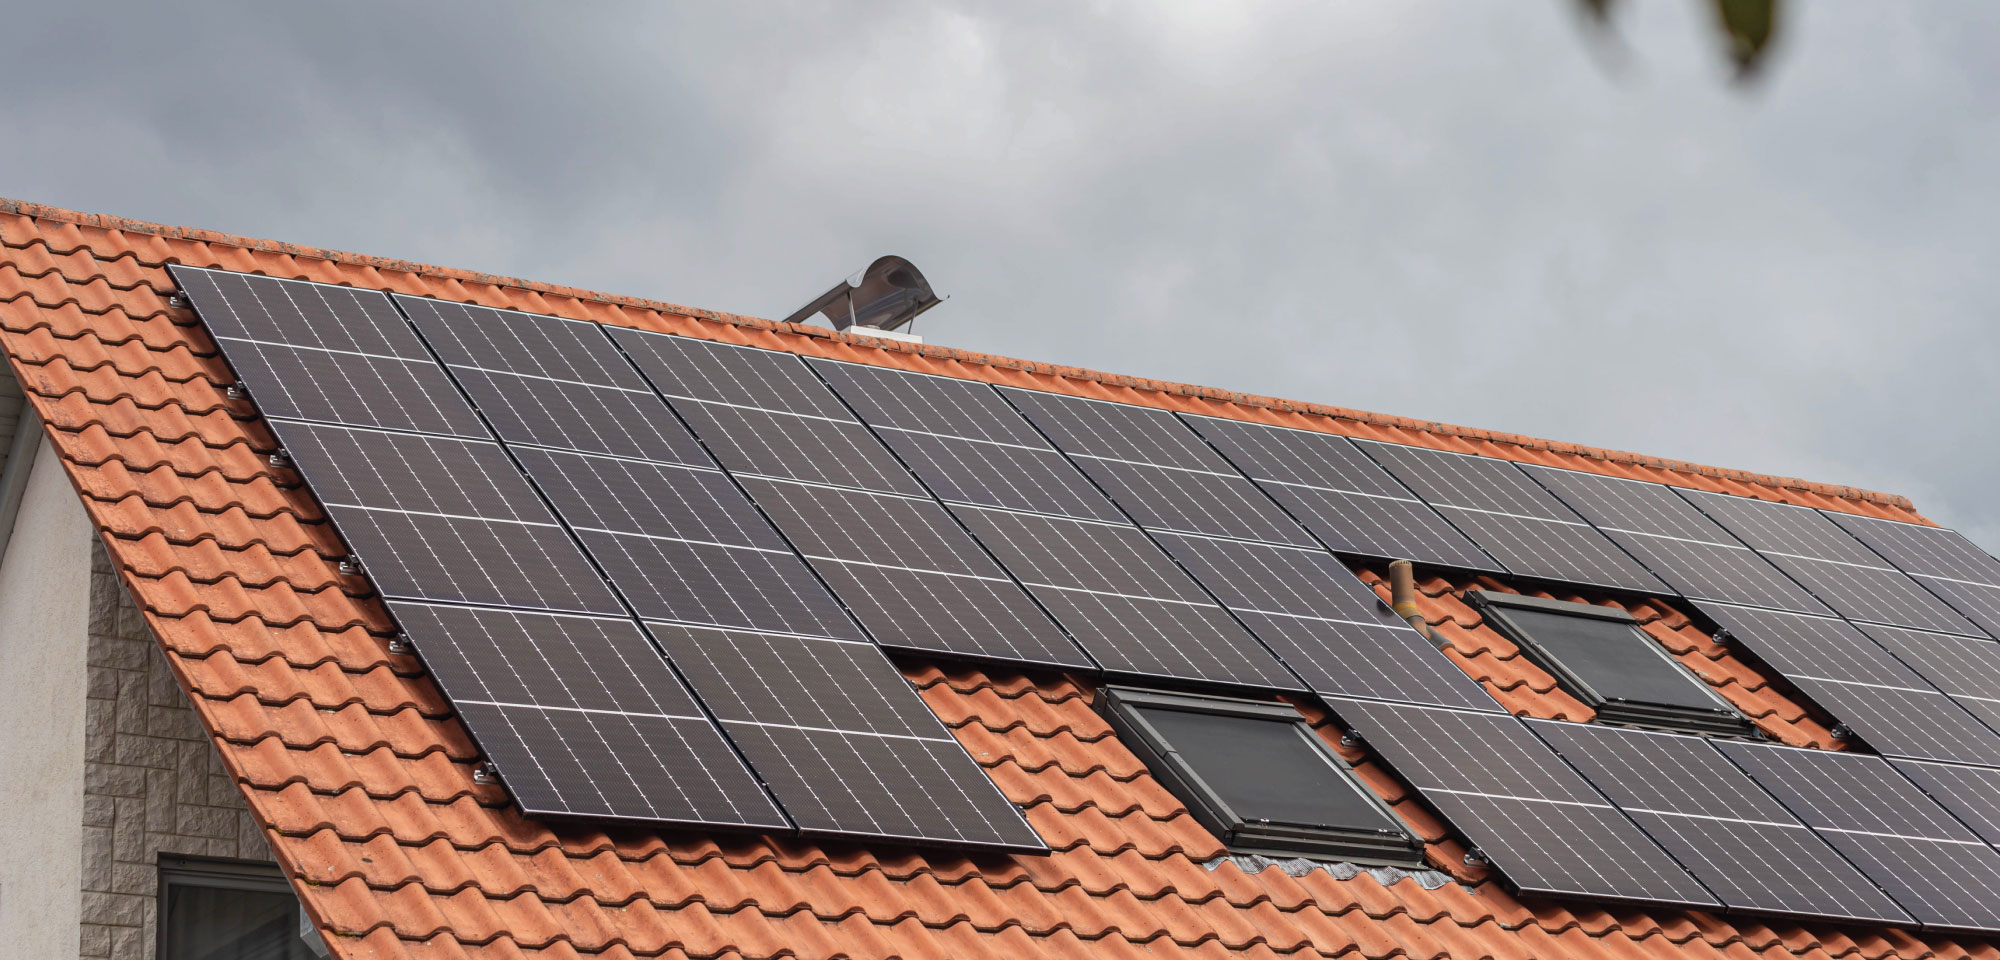
A misaligned panel can sacrifice 15–25% of its potential annual energy production. The ideal tilt angle is typically within 5–10 degrees of your location’s latitude to maximize yearly yield—for example, a 35-degree tilt is often optimal near Los Angeles (latitude 34°N). Direction matters just as much: in the northern hemisphere, south-facing panels generate up to 30% more energy annually than east or west-facing ones. Even small obstructions like a chimney or growing tree can cast shadows that reduce a system’s output by 5–20%, depending on the time of day and season. In regions with significant diffuse light, positioning panels to capture light from the entire sky (not just the sun’s direct path) becomes increasingly important.
l Tilt Angle: A 10-degree deviation from the optimal angle can cause 3–5% energy loss; seasonal adjustment (2–4 times per year) can boost yearly yield by 4–8%.
l Azimuth (Direction): True south (azimuth 180°) is ideal in the northern hemisphere; every 15° deviation east or west may result in a 1.5–3% decrease in annual production.
l Shading Impact: Even 10% shading of a panel can reduce system output by 30–50% if string inverters are used; microinverters or optimizers can cut these losses to 5–15%.
l Row Spacing: To avoid inter-row shading, a ground mount typically requires 2–3 times the row height in spacing, especially in winter when shadows are longest.
Placement Factor | Typical Value or Range | Impact on Annual Energy Yield |
Optimal Tilt Angle | Latitude ±5–10° | Maximizes yield; ±15° error reduces output by 5–10% |
Azimuth Orientation | 180° (True South) | South vs. west: 10–20% higher annual production |
Height above Roof | 4–6 inches | Improves airflow, reduces operating temp by 3–5°C, boosting output 1.5–2.5% |
Inter-Row Spacing | 1.5–2× row height | Prevents self-shading; too close can cause 12–18% winter loss |
At 40 degrees north latitude (e.g., New York), setting panels at 35–40 degrees optimizes annual production. However, seasonal adjustment can add 4–8% more energy: increasing the tilt to 50 degrees in winter helps capture low-angle sun and reflectivity from snow, while lowering it to 25 degrees in summer aligns better with the high sun position. Azimuth orientation has an even greater effect. A panel facing 30 degrees west of south (azimuth 210°) will produce 6–8% less annually than one facing true south, with losses concentrated in the morning hours.
Placement is equally important. Panels should be installed with at least 4–6 inches of clearance above the roof to allow cooling airflow; this can reduce operating temperatures by 3–5°C, improving efficiency by 1.5–2.5%. For ground-mounted systems, row spacing is critical to avoid shading. Rows should be spaced 1.5 to 2 times the height of the panel rows, particularly at higher latitudes where the sun remains low in winter. In a 10-row array, inadequate spacing can lead to 12–18% energy loss from November to February due to inter-row shading. For properties with partial shading, using microinverters or DC optimizers can mitigate losses—instead of a single shaded panel dragging down the entire string’s output by 30–50%, these devices limit the loss to just 5–15% for the affected module.
Improving Low-Light Performance
While a standard panel may operate at only 10–25% of its rated capacity in low light, targeted enhancements can boost this performance by 5–20%, significantly impacting annual energy yield. For example, systems using advanced module technologies like PERC or bifacial cells can generate 3–6% more energy in diffuse light conditions compared to conventional panels. Similarly, pairing panels with microinverters instead of string inverters can reduce shading losses by 10–30%, recovering valuable output during overcast days. For a typical 6 kW residential system, these improvements can translate to an additional 300–600 kWh per year in cloudy climates, improving the return on investment by 1-3 years over the system's lifetime.
l Module Technology: Panels with PERC cells improve low-light efficiency by 3–5%; bifacial models add 5–15% extra energy from reflected light.
l Inverter Selection: Microinverters or DC optimizers reduce shading losses by 10–30% compared to string inverters.
l Cleaning & Maintenance: Removing dust and debris restores 5–10% of output; performing this quarterly is optimal in dry or dusty areas.
l Tilt & Orientation Adjustment: Optimizing angle for seasonal sun position can increase annual yield by 4–8%; even a 5-degree change matters.
l Reflective Surfaces: Using light-colored roofing or ground surfaces boosts bifacial gain by 2–4%, enhancing output in low light.
Modules built with Passivated Emitter and Rear Cell (PERC) architecture are particularly effective because they reflect unused light back into the silicon layer, increasing efficiency by 3–5% under irradiance levels below 400 W/m². Similarly, bifacial panels, which capture light from both sides, can gain an additional 5–15% in energy output from reflected light on cloudy days—especially when installed over a light-colored surface or with elevated mounting. For example, a bifacial 400W panel in a diffuse-light environment may produce 420–430 watts equivalent due to rear-side gain, while a monofacial panel of the same rating outputs only 380–390 watts.
In a string inverter system, shading on one panel can reduce the output of the entire string by 20–50%, but with module-level electronics, this loss is limited to only 5–15%. Regular maintenance is also critical; dust, pollen, or bird droppings can block 5–10% of incoming light. Cleaning panels every 3 months in arid or high-pollution areas can maintain peak efficiency. For fixed-tilt systems, adjusting the panel angle 2–4 times per year optimizes exposure to the sun’s lower position in winter, adding 4–8% to annual production. Even a simple 5-degree increase in tilt during winter can improve daily energy capture by 2–3% in regions above 40 degrees latitude. Lastly, positioning panels to avoid shading from trees, vents, or chimneys—especially between 9 AM and 3 PM—ensures consistent generation, as even minor shading during peak light hours can disproportionately reduce daily output by 15–30%.