What are Maintaining Solar Panel Efficiency | 3 Tips
Cleaning with fresh water every six months can prevent a 15% loss in power generation;
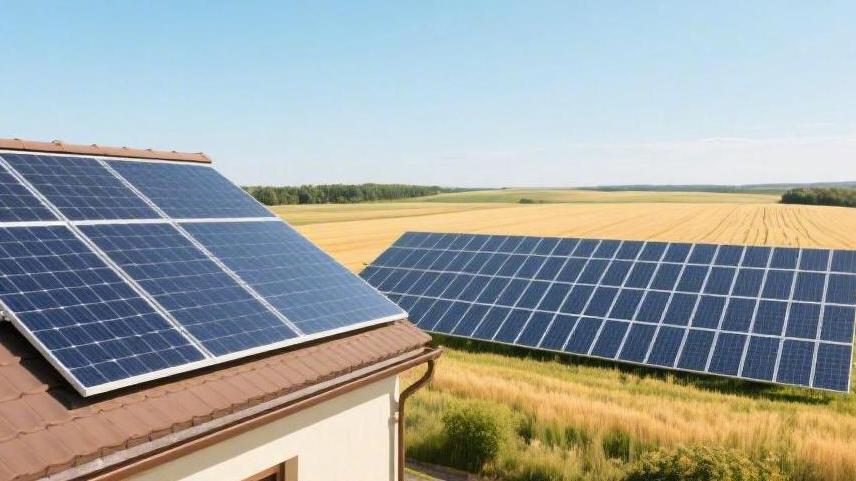
Trimming branches within a 5-meter radius prevents shading from triggering the hot spot effect;
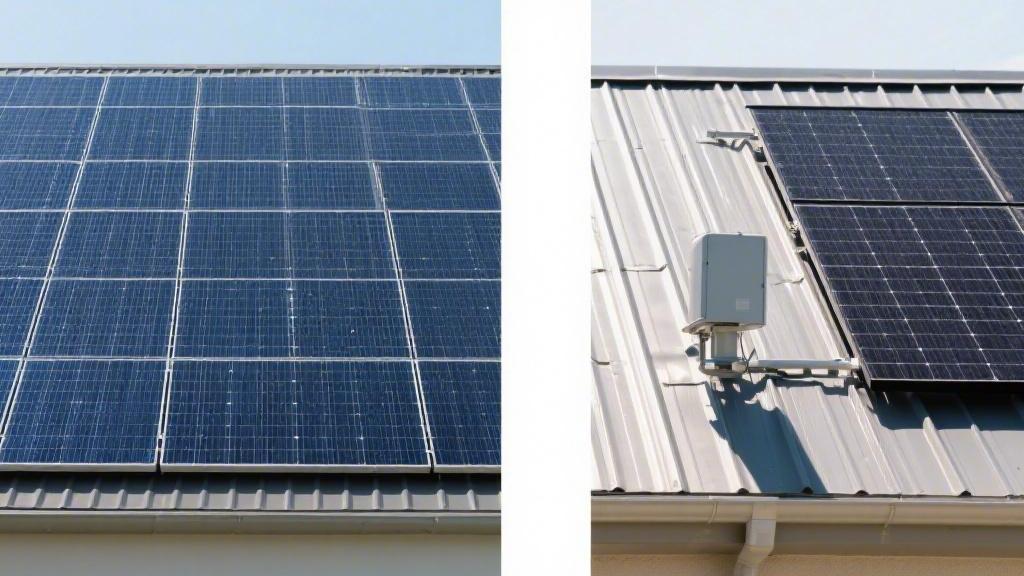
Checking the inverter monthly is essential; if the power drops below 80% of its rated value, immediate maintenance is required.
Clean Strategically, Not Constantly
Blindly pursuing zero dust can drive water consumption above 100 liters per cleaning, which paradoxically pushes the maintenance cost per kilowatt-hour (kWh) up by $0.05. According to long-term monitoring data from the Arizona Solar Center, in arid regions with less than 250 mm of annual rainfall, the difference in total annual power generation between a 60-day and a 15-day cleaning cycle is merely 1.2%. When surface dust accumulation reaches 4 grams per square meter, the light transmittance of the photovoltaic (PV) panels drops by about 8.5%.
Initiating a cleaning protocol when the reading falls below 88% causes the return on investment to soar to 300%. If an automated cleaning robot with mechanical arms is deployed when the dirt coverage rate on the module surface is less than 3%, the 15 minutes of electricity consumption combined with a $75 hourly labor rate will result in a net profit of -15% for the day.
Watch the Rain
Natural precipitation can clear away about 70% to 85% of loose debris on the panel surface for free. Weather forecasts indicating over 15 mm of continuous rainfall for 3 days mean the terminal velocity of falling raindrops can generate a gravitational acceleration kinetic energy of 9.8 m/s&²; washing away 90% of the dirt on solar panels tilted at an angle greater than 15 degrees. Based on sample statistics of residential PV systems in California, scheduling one manual water wash right before entering a 4-month dry season allows the system's power generation efficiency to remain above 91% of its rated power for the subsequent 120 days. Conversely, spending $200 to hire someone to clean the panels during months with frequent thunderstorms and 80% relative humidity will result in mud spots measuring 0.5 mm to 2 mm in diameter accumulating again within 48 hours. By simply scheduling one manual cleaning in the middle of a dry season when the precipitation probability is below 10%, and another right after the monsoon season ends, nearly $400 in ineffective annual maintenance expenses can be saved.
Measure Light Transmittance
Determining whether a hose and brush are necessary depends on the mean squared error deviation data on the daily system output charts. When the inverter app shows that the 12:00 PM peak power on 7 consecutive cloudless, sunny days is 12% lower than the factory-calibrated 5,000W (i.e., less than 4,400W), it constitutes the first trigger metric to initiate a water washing protocol. After excluding the degradation variable caused by the temperature coefficient, where power drops by 0.4% for every 1°C increase, the following 4 quantitative inspection metrics should be referenced to formulate a cleaning strategy:
l Place a light transmittance meter at the edge of the panel for real-time measurement. A reading below 88% indicates that the dirt layer on the glass surface has exceeded a thickness of 0.3 mm.
l Use a portable TDS water quality testing pen to measure a 20 ml sample of standing water collected from the roof. If Total Dissolved Solids exceed 300 ppm, the calcium carbonate crystals formed after air-drying will increase the probability of localized hot spot effects by 25%.
l When there are active civil construction projects within a 5-kilometer radius, dust settlement will increase at a rate of 0.5 grams per square meter per day, requiring the inspection cycle to be shortened from 30 days to 14 days.
l Flat roof systems with a tilt angle of less than 10 degrees have a rainwater drainage rate of less than 0.1 liters per second. This makes it extremely easy for a mud band wider than 2 cm to accumulate at the bottom frame, causing the bottom row of solar cells to be shaded and resulting in a 30% voltage loss for the entire string.
Choose the Right Time
When executing a cleaning task, six environmental testing parameters must be strictly controlled within the extreme limits physically tolerated by the modules. When the ambient temperature hits 35°C at noon in the summer, the surface temperature of black monocrystalline silicon solar panels will soar to between 65°C and 75°C. Spraying 20°C tap water when the panel temperature is at 70°C will cause a 50°C thermal shock, creating micro-cracks in the tempered glass that is only 3.2 mm thick, pushing the hardware scrap rate for a $500 module close to 100%. The operational window is between 6:00 AM and 8:00 AM or after 6:00 PM (18:00), when the panel surface temperature stabilizes in the 25°C to 30°C range, and the water evaporation rate drops to 0.1 grams per square meter per minute, giving the cleaning agent at least 3 minutes of reaction time to break down oil and grease. Using a washing solution containing 0.5% non-ionic surfactant at a constant pH of 7 can compress the softening and dissolving time of bird droppings and tree sap from 30 minutes to under 5 minutes.
Run the Numbers
Planning the cleaning frequency requires calculating marginal costs and recovered electricity revenue within a 25-year financial model. Assuming a 10 kW system has a theoretical full-load annual generation of 14,600 kWh, and calculating based on an average 8% efficiency drop due to dust shading, the annual power loss is approximately 1,168 kWh. At a standard electricity rate of $0.20 per kWh, the annual financial loss caused by a lack of cleaning is $233.60. The budget can be optimized by comparing the following 4 sets of financial data:
l Spending $300 a year to hire a professional team for two high-altitude cleanings results in a net profit of -$66.40 ($233.60 minus $300). The ROI for this decision is -22%.
l Purchasing a dedicated tool set with a 6-meter telescopic aluminum pole and soft-bristle brush costs $120. Depreciated over a nominal 5-year lifespan, the amortized equipment cost is $24 per year.
l A single-person operation consumes about 80 liters of tap water per session, generating a water cost of less than $0.50. Adding $2 for the cleaning solution, the total consumable expense per session is $2.50.
l If the homeowner performs the cleaning twice a year, once in spring and once in autumn, the total expenditure is only $29 ($24 plus $2.50 times 2). This successfully recovers $233.60 in lost electricity value, yielding an ROI of 705% and a net gain of $204.60.
Select the Right Bristles
The physical friction generated by contact with the glass must be kept below 15 Newtons per square centimeter to protect the anti-reflective coating, which is 100 to 150 nanometers thick. Nylon bristles should have a diameter of less than 0.2 mm and a hardness rating not exceeding Shore 50A, preventing irreversible mechanical scratches deeper than 2 microns on the light-transmitting glass surface. Scratches will cause over 5% diffuse reflection of incident light, permanently dragging down the maximum power generation of the entire module by 3%. The water flow from the nozzle connected to the hose should be adjusted to 8 liters per minute, just enough to wash away the 0.1 mm thick dust particles dislodged by the bristles. Keeping the water pressure under 40 psi avoids destructive squeezing of the 1.5 mm thick silicone sealant ring around the module, ensuring its physical lifespan at an IP68 protection rating can be maintained for 25 to over 30 years.
Monitor Inverter App
Opening the inverter mobile app to check the daily parabolic power generation chart is a standard operation to keep the system's physical depreciation rate under 0.4% annually. For an 8 kW residential PV system, during the 3 hours between 11:00 AM and 2:00 PM in the spring, the input voltage on the DC side of the inverter should stabilize between 350 volts and 450 volts, with current readings maintained at 8 amps to 10 amps. When ambient temperatures meet the 25°C standard test condition, the conversion efficiency figure on the parameter dashboard for a single 10 kW rated string inverter will typically be fixed between 97.5% and 98.2%. If the system's peak power reading at 12:00 PM noon is below 75% of the installed capacity (i.e., less than 6000 watts) for 5 consecutive days, and weather stations within a 10-kilometer radius have not reported cloud cover thicker than 2 mm, it indicates that the bypass diode of at least one module within the string has suffered a short or open circuit fault, causing the single-string voltage to instantly drop by over 30 volts.
Check the Daily Chart
The app's homepage typically uses a 2D chart spanning from 6:00 AM to 6:00 PM (18:00) to display real-time power. Every 5 minutes, the built-in data logger sends a data packet containing over 30 fields to the cloud server via a 2.4 GHz wireless frequency. On a normal, sunny day with no physical shading, the curve formed by 144 collected samples should present a normal distribution, peaking around 1:00 PM. If a jagged, cliff-like drop deeper than 20% appears on the left or right side of the parabola during a specific timeframe, such as between 9:00 AM and 10:00 AM, and lasts for 45 minutes, it indicates that a chimney taller than 3 meters or a newly grown tree canopy on the east side has cast a shadow larger than 0.5 square meters.
Shading just 10% of a single 1.9-square-meter panel will trigger the inverter's Maximum Power Point Tracking (MPPT) algorithm to perform a global scan, causing all 15 modules connected in series on that circuit to collectively drop their load, resulting in a wasted loss of about 1.5 kWh per hour.
Check Both Current Circuits
Residential inverters priced between $1,200 and $1,800 on the market come standard with 2 or 3 independent MPPT input channels on the back. On the app's "Device Details" page, open the operating parameters for "PV1" and "PV2" separately to compare the direct current (A) readings of the two circuits. For two branches installed on the same south-facing roof, at the same 20-degree tilt angle, and equipped with the same quantity (10 modules each) and specification (400 watts each) of PV panels, the current deviation rate between them under identical light intensity must be less than 3%.
If the first circuit shows 9.5 amps while the second only has 8.1 amps—a difference of 14.7%—and after ruling out external interference like bird droppings covering an area larger than 10 square centimeters, it usually indicates that the contact resistance of an MC4 waterproof connector on the second line has increased from the standard 0.005 ohms to over 0.1 ohms.
Industry data models show that when the two MPPT currents in a system maintain a deviation of over 5% for an extended period, the cumulative 25-year power generation of the entire equipment set will shrink by about 11,000 kWh. Calculated at $0.18 per kWh, this invisibly evaporates $1,980 in pure profit. An abnormal resistance value lasting up to 6 months will generate an extra 10 watts of heat loss, eventually baking the cable insulation to 90°C and triggering a short-circuit shutdown.
Calculate Degradation
Within the first 12 months after leaving the factory, monocrystalline silicon solar panels undergo a physical-chemical reaction known as Light-Induced Degradation (LID), causing a permanent drop of 1.5% to 2.5% in their rated power. Use the app's "Export Historical Data" function to download Excel spreadsheet data from the past 36 months, filter out rainy days with daily precipitation exceeding 5 mm, and single out the 5 sunny days with the longest sunshine hours in July of each year. Divide the daily average output of these 5 days in the 3rd year (e.g., 38 kWh) by the baseline data from the 1st year (e.g., 40 kWh). If the resulting ratio falls below the passing grade of 95%, exceeding the manufacturer's guaranteed extreme limit of 0.5% linear degradation per year, it constitutes a quantitative metric for filing a warranty claim with the manufacturer.
Replacing a defective module with a degradation rate as high as 8% will require a materials and labor budget of roughly $250 to $300. If left unaddressed for the remaining 22-year cycle, the entire string system will generate about 2,800 kWh less electricity, leading to over $500 in bill losses.
Set Up Alerts
To avoid a financial deficit caused by up to 30 days of unnoted equipment offline downtime, you need to manually configure three dimensions of trigger alert parameters on the app's advanced settings page. Set the grid AC overvoltage protection threshold to 264 volts, preventing a 270-volt surge current—generated when the community transformer is underloaded—from instantly blowing through the electronic modules inside the inverter, which only have a 600-volt withstand capacity. Enable the insulation resistance monitoring function and set it to push a mobile pop-up notification when the value falls below 50 kilo-ohms. This prevents leakage currents from damaged DC cables from exceeding 30 milliamps when nighttime humidity reaches 90%.
Enable the daily minimum power generation alert, using the historical median average for the same period locally as a baseline. For instance, if the daily average output in September is 30 kWh, draw the alarm line at 21 kWh (i.e., 70% of the baseline). Once the system falls below this threshold for 3 consecutive days with no local precipitation, the homeowner can spend $75 to hire a drone equipped with a 640x512 resolution thermal imaging camera. Hovering 50 meters above, it takes just 10 minutes to pinpoint high-temperature hot spots reaching up to 85°C.
Manage Environmental Shading Proactively
A monocrystalline silicon PV module with a rated power of 400 watts and an area of 1.9 square meters is internally composed of 108 or 144 half-cut cells connected in series. As long as just one cell with an area of merely 1.5 square centimeters is completely shaded by a leaf or building shadow, the internal resistance of the entire circuit will instantly spike 1,000 times. Severe physical blockage occurs when current passes through a high-impedance node, causing the overall output power of that panel to plummet from 380 watts to under 120 watts within 0.1 seconds.
In a traditional string system without individual microinverters or power optimizers, a 70% power drop in one panel will forcibly drag down the other 14 fully illuminated panels on the same string to the identical 120-watt output level. Fifteen panels that could originally produce 5.3 kWh (5300 watt-hours) per hour will see their actual output shrink to 1.8 kWh due to the shading of a single leaf, resulting in a single-hour power loss of 3.5 kWh.
Calculated at a peak rate of $0.22 per kWh, a 2-hour shading from 1:00 PM to 3:00 PM every day will result in a $46.20 economic drain over 30 days. A slender branch just 2 cm in diameter projecting a shadow on the module glass across the control areas of 3 internal diodes will trigger the bypass diodes' protection mechanism. After running continuously for up to 200 hours, the junction temperature of the diode will breach its physical limit of 150°C, causing a permanent thermal breakdown, and the $250 panel will face physical scrappage.
Trim the Tree Canopy
The natural growth rate of surrounding trees constitutes a long-term shading variable. The branch extension length of broadleaf forests each spring is between 40 cm and 60 cm, while the vertical growth speed of coniferous forests also maintains at around 30 cm per year. Within 10 meters south of the roof, an oak tree whose canopy diameter increases by 1.2 meters annually will expand its shadow projection area by 3.5 square meters by November of its 3rd year.
The sun's elevation angle on the winter solstice will drop to its annual low between 28 degrees and 32 degrees. A tree canopy that originally had no impact during the summer will cast a shadow 2.5 times longer than on the summer solstice. Spending $150 to $250 to hire an arborist with high-altitude operating permits to cut back branches within 5 meters of the roof edge by 2 meters is an expenditure with an extremely high financial return.
After truncating the tree canopy, the array's daily unshaded direct sunlight time will recover from 4.5 hours back to 6.5 hours. For an 8 kW system, the extra 2 hours per day can convert to about 12 additional kWh. Over a 90-day winter cycle, the cumulatively recovered electricity adds up to 1,080 kWh. The homeowner essentially trades a one-time manual trimming cost of $250 for a current-season electricity bill recovery worth $237.60, and the identical sunlight dividend in the second year will fully convert into pure profit.
Calculate Shadow Length
An exhaust pipe or brick chimney rising just 0.8 meters above the roof slope will cast a 2.1-meter diagonal dark shadow to the northeast at 4:00 PM when the solar azimuth angle reaches 240 degrees.
If the dark shadow slides across two side-by-side installed solar panels at a moving speed of 5 cm per minute, it will cause a 25% voltage drop for the entire string over the subsequent 45 minutes. At 12:00 PM noon on the autumnal equinox each September, conduct on-site tape measurements to record the length and width dimensions of all fixed protrusions on the roof, as well as their absolute distance from the edges of the PV array.
Input the measured 3D data into 3D modeling software to generate a 12-month shadow shading simulation report. When the report indicates that the year-round light reception loss rate of a specific panel exceeds 15%, investing $80 to purchase a DC extension cable with MC4 connectors and shifting that panel 1.5 meters into an unshaded area will generate 60 watts of extra power, recuperating the cable and manual modification budget in less than 18 months.
Obstacle Height (m) | Solar Elevation Angle (Degrees) | Shadow Projection Length (m) | Number of Shaded Cells | String Instantaneous Power Loss Rate (%) | Estimated Annual Financial Loss ($) |
0.5 (Exhaust Vent) | 65 (Summer) | 0.23 | 2 | 4.5 | 35.50 |
0.5 (Exhaust Vent) | 25 (Winter) | 1.07 | 12 | 18.2 | 145.20 |
1.2 (Satellite Dish) | 65 (Summer) | 0.56 | 6 | 11.4 | 92.80 |
1.2 (Satellite Dish) | 25 (Winter) | 2.57 | 36 | 33.5 | 278.40 |
3.5 (Neighbor's Tree Canopy) | 45 (Spring/Autumn) | 3.50 | 48 | 45.0 | 415.00 |
Check Panel Temperature Differences
When a 156 mm by 156 mm monocrystalline silicon cell is 50% covered by a fallen leaf, its original working mode of converting photons into electrons is forcefully reversed, turning it into a load resistor that consumes electricity. The high DC current of up to 8 amps on the string circuit continuously surges into the shaded area, accumulating over 60 watts of heat within 5 minutes.
The temperature of the tempered glass on the module's surface will rapidly climb from a normal 45°C to 95°C or even 105°C. The 0.5-mm-thick EVA encapsulant film sandwiched between the glass and the solar cells will experience broken chemical cross-linking bonds after enduring over 200 hours of high-temperature baking above 85°C, presenting yellowish-brown scorch marks visible to the naked eye.
This aging damage, a permanent 12% drop in light transmittance, will cause the short-circuit current of the damaged cell to stay below 85% of its normal level over the long term. Using a handheld infrared thermal imager with a thermal sensitivity of 0.5°C to scan the entire array surface every 6 months during the high-load period at 2:00 PM, finding and removing shading sources causing abnormal temperature differences exceeding 15°C, can compress the probability of hardware failure over the equipment's 25-year lifecycle down to 0.2%.