How much power does a 1000 watt solar panel produce in a day
A 1000-watt solar panel system typically generates between 3.2 to 4 kWh of electricity per day, assuming an average of 4 hours of effective peak sunlight and deducting approximately 20% for system losses.
Actual output is influenced by geographic latitude, installation tilt angle, and seasonal climate fluctuations.
In-depth Analysis
How Big Is the Panel?
Achieving 1000 watts of power depends on the rated parameters of the individual panels. Currently, mainstream 500-watt class panels on the market usually weigh around 28 kg, with frame thicknesses ranging from 30 mm to 35 mm.
When connecting two 500-watt panels in series, the system's open-circuit voltage will reach 80 V to 100 V, while the operating current remains around 13 Amperes.
To ensure structural safety, the aluminum alloy brackets supporting these 1000-watt panels must withstand a static load of 30 kg per square meter and resist wind gusts of up to 35 meters per second.
During the photoelectric conversion process, the light transmittance of the tempered glass on the panel surface is typically set above 93% to ensure as many photons as possible strike the silicon wafers, which are only 180 microns thick.
If lower-efficiency polycrystalline silicon panels are chosen, achieving the same 1000-watt power would require an approximately 15% increase in installation area, reaching about 8.5 square meters.
How Long Does the Sun Shine?
In most temperate regions globally, the annual average daily peak sun hours fluctuate between 3.8 and 5.2 hours.
Even if a region has 12 hours of daylight, the time during which a 1000-watt panel runs near full capacity is often only the 3.5 hours around noon.
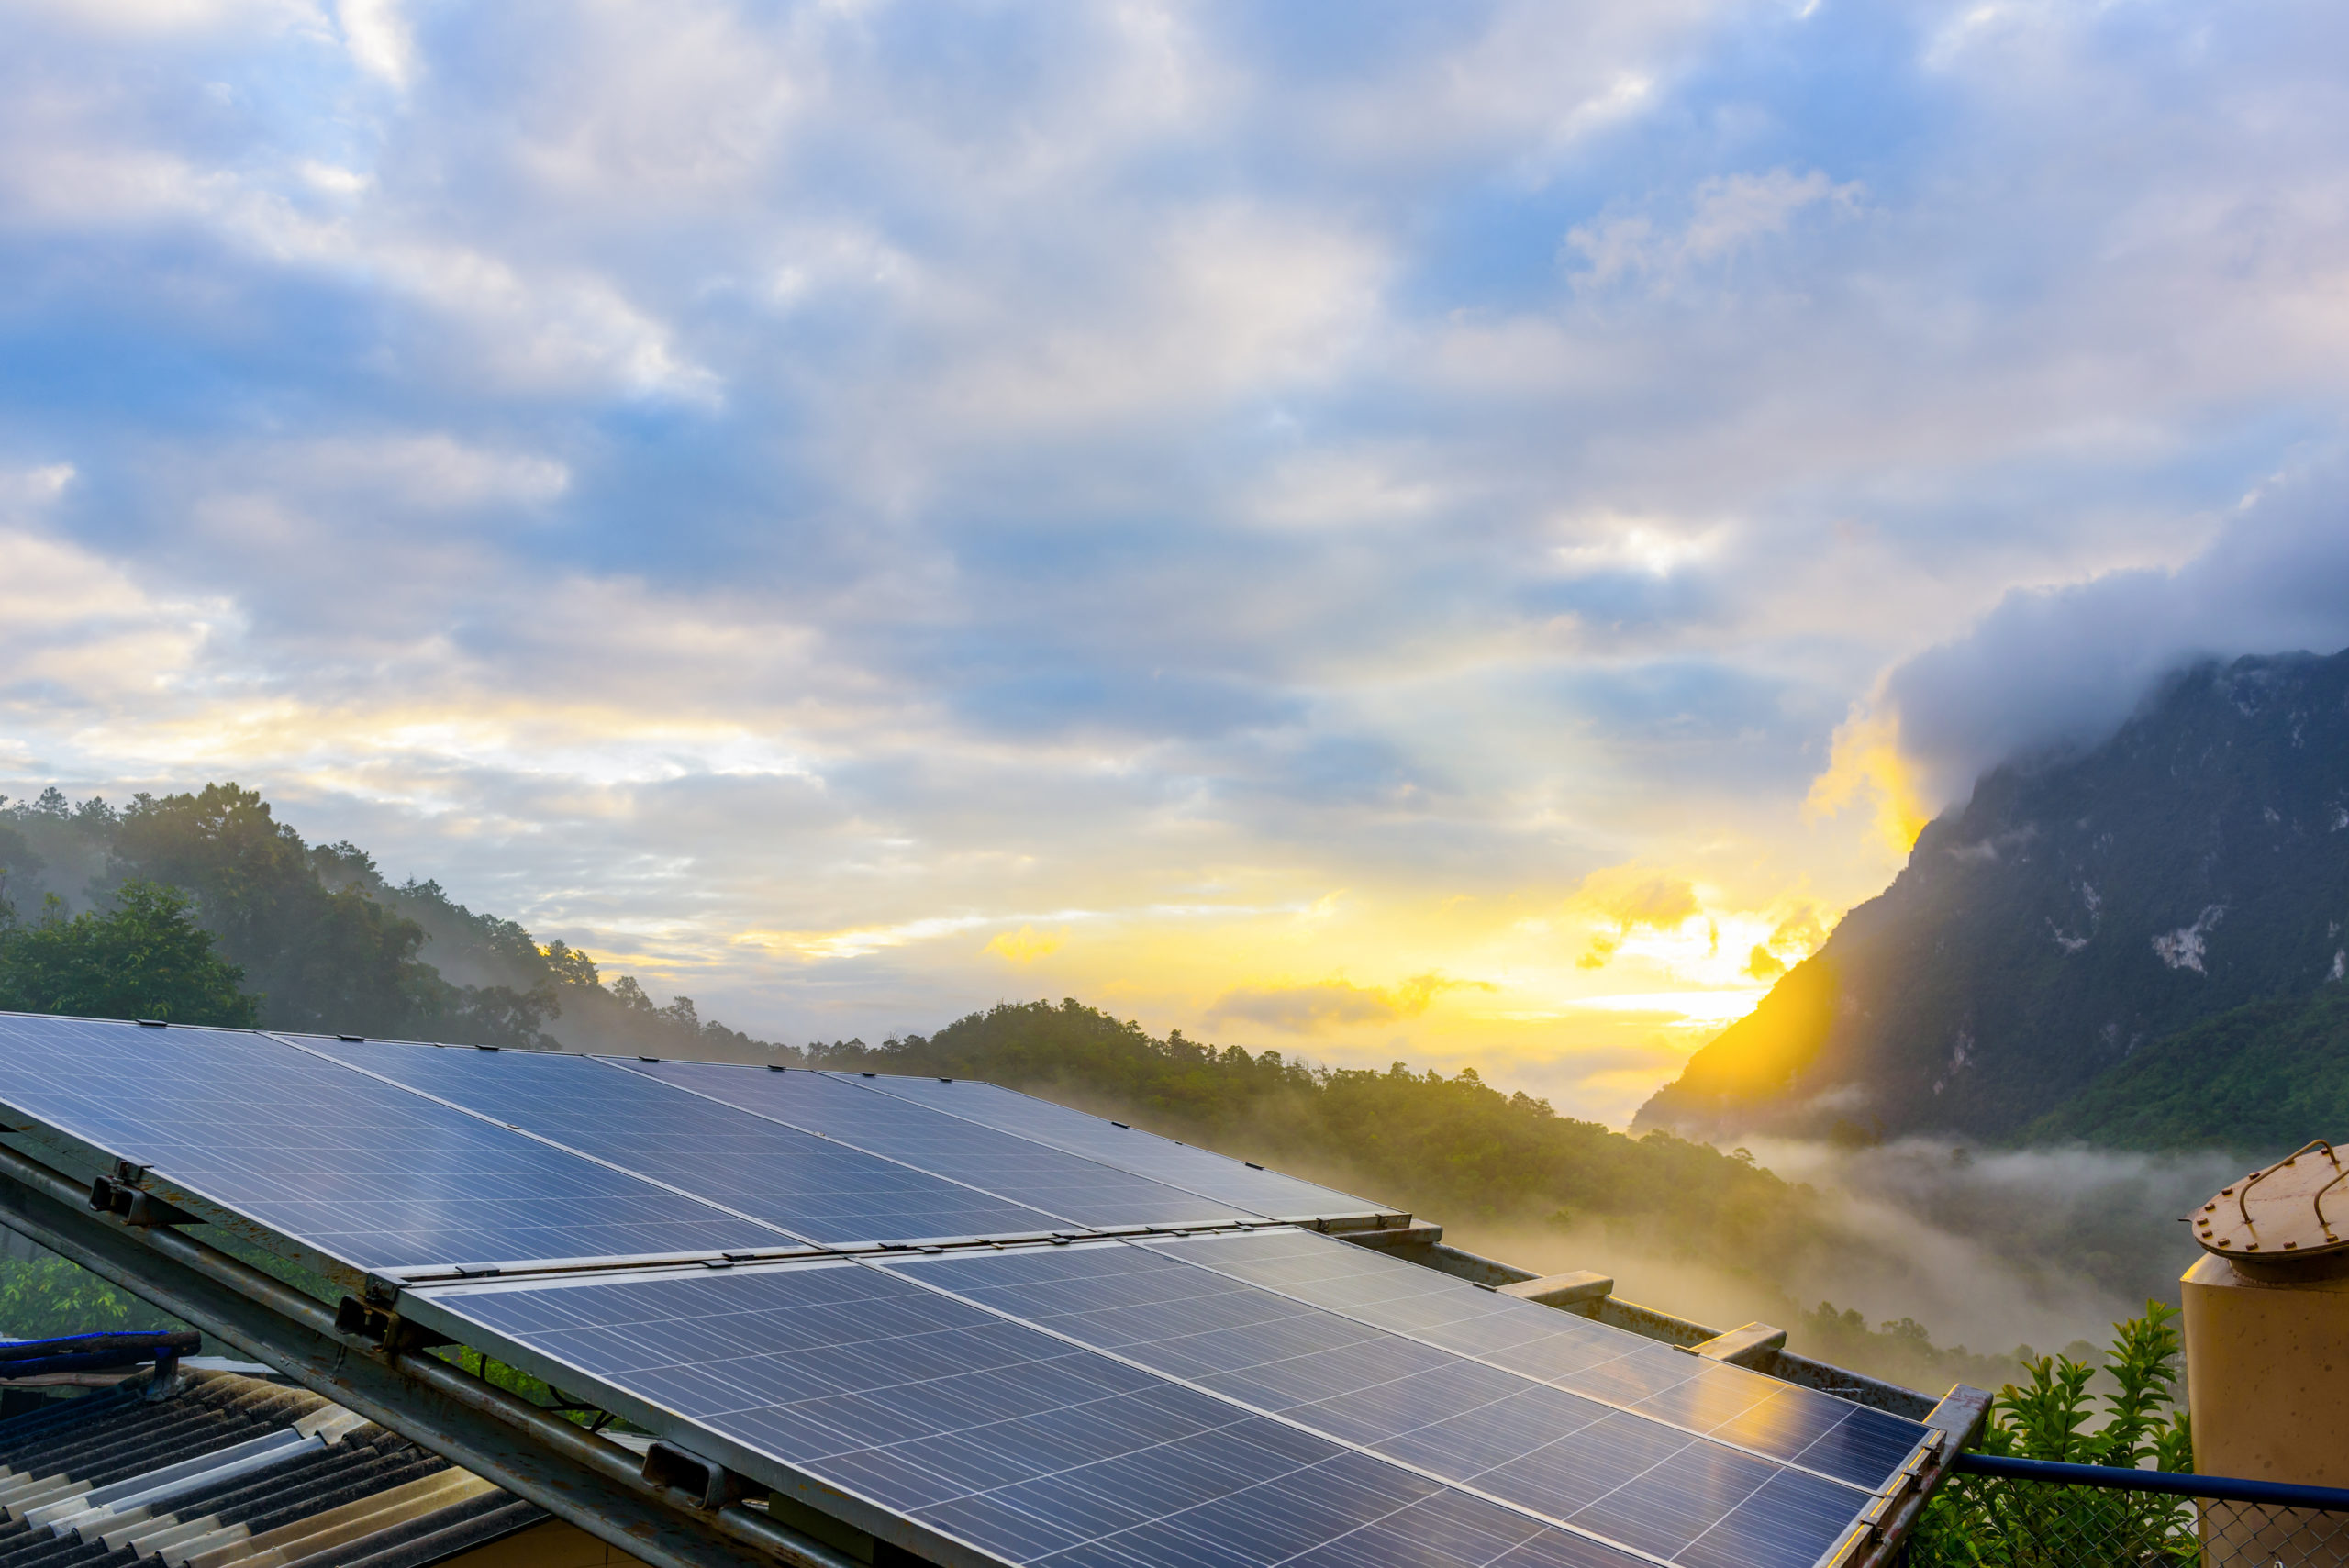
In a sun-drenched desert fringe, an average of 5.5 hours of equivalent sunlight can yield 5.5 kWh of electricity.
Conversely, in misty forest regions, this value might shrink to 2.8 hours, causing daily production to drop to 2.8 kWh. This 49% output gap is determined entirely by geographic coordinates.
Circuit Leakage: How Much is Lost?
From the DC power generated at the panel to the AC power entering a socket, the energy must be modulated by an inverter. The conversion loss rate during this process is typically between 15% and 22%.
High-efficiency pure sine wave inverters can maintain DC-to-AC efficiency above 96.5%. However, using cheap modified sine wave inverters can cause efficiency to plummet below 80%.
Cable resistance is also a major source of loss. When using $4mm^$2 dedicated DC cables, if the line length exceeds 15 meters, the voltage drop will result in a power loss of about 2%.
For 1000-watt systems with energy storage, the charge-discharge cycle efficiency of lithium iron phosphate (LiFePO4) batteries is approximately 92%, whereas older lead-acid batteries have a conversion efficiency of only about 75%.
Combining all factors, for every 1 kWh generated at the top of a 1000-watt panel, typically only 0.78 to 0.82 kWh is actually consumed by appliances.
Weather Impacts: How Much Does Production Drop?
The temperature coefficient for monocrystalline silicon panels is usually -0.35% per degree Celsius. When the panel temperature rises from a standard 25°C to 65°C on a summer roof, the 1000-watt rated power instantly shrinks by 140 watts.
Cloud cover has an immediate impact; even light clouds can reduce light intensity from $1,000W/m^$2 to $300W/m^$2, causing instantaneous output to drop to 30% of the rated value.
If dust or bird droppings accumulate to a thickness exceeding 0.5 mm, the "hot spot effect" caused by partial shading not only reduces overall yield by 8% to 12% but can also cause local cell temperatures to exceed 100°C, shortening the panel's 25-year lifespan.
Optimal Installation: How to Be Most Efficient?
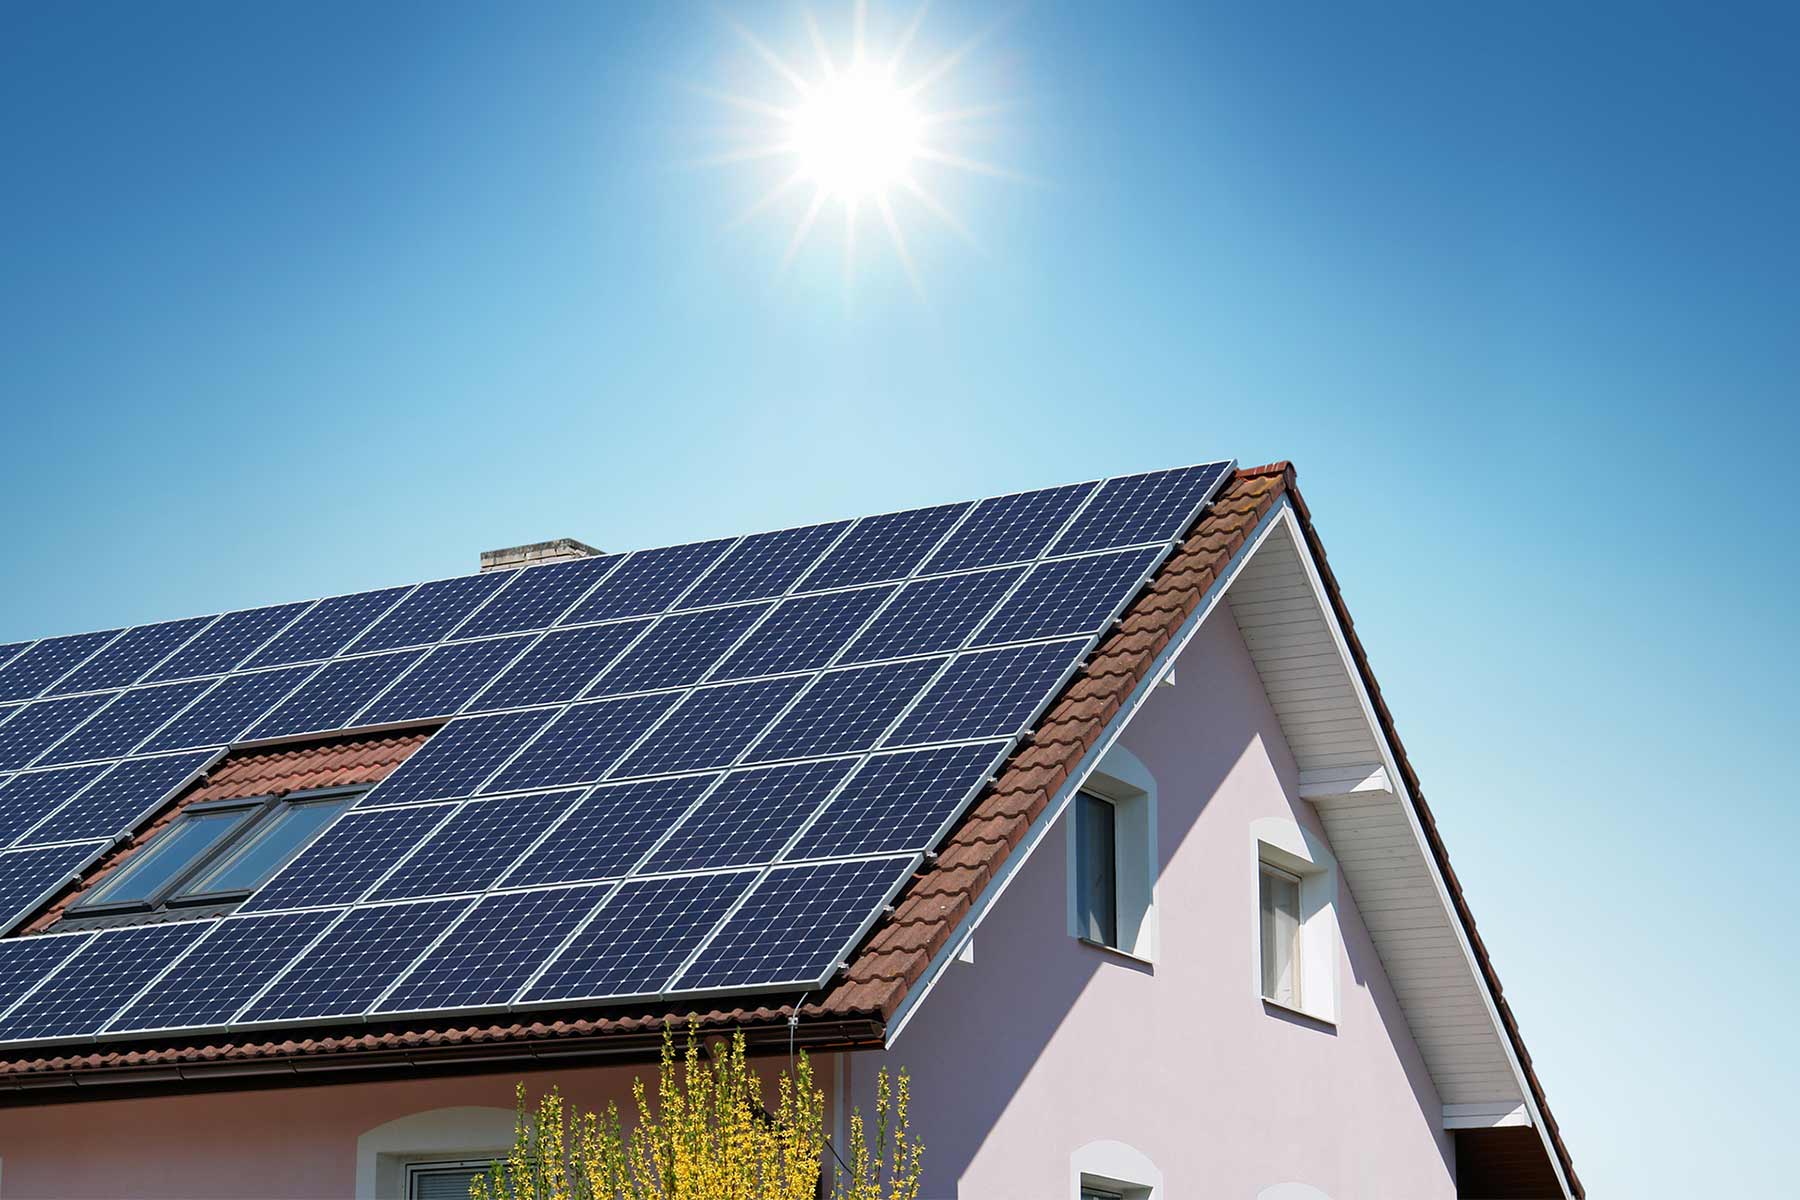
The installation angle directly determines the number of photons captured per square meter. Facing the sun directly can increase annual power generation by about 15%.
In the Northern Hemisphere, panels must face true south, and the tilt angle should be optimized for seasonal output by adding or subtracting 10 to 15 degrees from the local latitude.
For example, at 40°N latitude, setting a fixed bracket at a 35° tilt increases winter power generation efficiency by over 30% compared to horizontal placement.
Using a single-axis automatic tracking bracket may increase costs by $200, but it can boost solar utilization by 25% to 30%, jumping a 1000-watt panel's daily output from 4 kWh to 5.2 kWh.
Cleaning the surface every six months to remove accumulated pollutants can recover about 5% of power generation revenue—equivalent to getting 70 kWh of electricity for free every year.
What Can It Power?
The 4 kWh daily output from a 1000-watt system can satisfy the needs of multiple high-frequency appliances in a modern home.
It can run a 500-liter Grade-1 energy-efficient refrigerator for over 48 hours, or support a 1000-watt microwave for a cumulative total of 4 hours.
For remote workers, this amount of electricity can power two 27-inch monitors and one high-performance laptop for 12 consecutive hours, plus an inkjet printer for 3,000 pages.
In summer, 4 kWh can drive a 1.5 HP inverter air conditioner in energy-saving mode for about 5 hours.
At a market price of $0.15 per kWh, this 1000-watt system saves $0.60 per day, generating approximately $219 in value annually. Ignoring government subsidies, the hardware payback period is typically set between 4.5 and 5.5 years.
Key Factors Influencing Output
Solar intensity varies greatly across different latitudes globally. Near the equator, peak solar intensity remains above $1,000W/m^$2 year-round, while at 45°N, effective light in winter may shrink to less than 2.5 hours per day.
A 1000-watt array in the Arizona desert can produce about 1800 kWh per year, but in a cloudy city like London, annual production might be only 900 kWh—a twofold difference in output efficiency.
Watching the Weather
For every increase of $100W/m^$2 in solar radiation, the panel's current output increases by approximately 1.2 Amperes.
Atmospheric scattering and absorption lose about 30% of the initial energy, while cloud thickness can instantly wipe out over 80% of power generation efficiency.
Under perfectly clear skies, the four hours between 10 AM and 2 PM contribute about 70% of the total daily energy output.
Solar radiation reaches $1,000W/m^$2.
The panel is at full load output.
Cloud cover can turn 1,000W into 150W.
These violent fluctuations can last for hours.
If ambient humidity reaches above 80%, water vapor particles in the air change the spectral distribution, causing an energy loss of about 5% to 8% in the infrared band, to which monocrystalline silicon cells are most sensitive.
In high-altitude areas, although temperatures are lower, the thinner air results in UV intensity about 15% higher than at sea level, which allows a 1000-watt panel to produce about 3% more electricity in the same sunlight duration.
Temperature Troubles
Many people mistakenly believe that the hotter it is, the more power is generated, but the truth is the opposite.
The rated power of a monocrystalline panel is measured at 25°C. Once the surface temperature exceeds this baseline, power begins to shrink at a rate of 0.38% per degree.
In the height of summer, the black surface absorbs heat, causing panel temperatures to soar to 65°C or higher.
Panel temperature is 40°C above the baseline.
Total power loss is approximately 15.2%.
A 1,000W system yields only 848W in high heat.
Maintaining rear ventilation can recover 3% of that loss.
If panels are installed flush against a roof without a 5 cm air convection gap, the accumulated internal heat increases cell resistance, causing the 1000-watt system's output current to drop by about 1.5 Amperes from its rated value.
Using high-efficiency modules with lower temperature coefficients can mitigate this, though the purchase price per watt is typically about $0.10 higher.
Obstructions are Forbidden
Shading has a devastating effect on series circuits. Even if only 5% of one panel's area is shaded by a branch, the output of the entire 1000-watt system can plummet by 30% to 50%.
This is because bypass diodes force a cut in the current path of the shaded portion to protect the cells from being burned by the hot spot effect.
A single fallen leaf can ruin half a panel's output.
A month of dust accumulation drops power by 10%.
Bird droppings can cause permanent dead spots due to corrosion.
100% of the area must remain unshaded.
Without cleaning, if dust density reaches 10 grams per square meter, light transmittance drops by about 12%, resulting in a daily loss of 0.5 kWh.
In arid regions, a simple water rinse every two weeks can increase the 1000-watt system's annual ROI by about 6.5%, a very worthwhile maintenance investment for those seeking to shorten their payback period.
Posture Matters
An installation angle deviation of 15 degrees causes a fluctuation of about 5% in annual total power generation revenue.
In the Northern Hemisphere, facing true south is the "golden orientation." If forced to face southeast or southwest due to roof constraints, power generation will decrease by 8% to 12% due to the reduced solar cross-section.
A tilt angle equal to local latitude is the optimal solution.
A 20-degree deviation loses about 6% power.
Tracking brackets increase incoming electricity by 30%.
Fixed bracket costs are only a quarter of tracking ones.
For a small 1000-watt system, using adjustable brackets to switch between winter and summer tilts (a 20-degree difference) can increase light capture by about 15% in those respective seasons.
This physical optimization requires almost no additional power cost—only manual adjustment of bolts twice a year—increasing the annual total electricity output by approximately 150 kWh without adding more panels.
What Can 1,000 Watts Power in Your Life?
A 1000-watt solar system, generating 4.2 kWh daily, can fully support the basic daily consumption of a modern household's essential appliances.
For a 650-liter A++ energy-rated refrigerator, 24-hour operation typically consumes 1.1 to 1.4 kWh. After powering the fridge, the system still has a surplus of about 2.8 kWh.
If you have 12 LED lights (8W each) lit for 6 hours every night, the total consumption is only 0.57 kWh, accounting for about 13.5% of the system's total output.
For off-grid users, this 4.2 kWh ensures life quality doesn't degrade; the remaining power is enough to run a 55-inch 4K smart TV at 120W for 10 consecutive hours.
Specific Usage Breakdown
A workstation with two 24-inch monitors (30 W each) and a high-performance laptop (60 W) consumes about 1.2 kWh over 10 hours of work.
This uses only 28.5% of the power generated on a sunny day. The remaining 71.5% can power a 15W router. Even if the router is never turned off, it only consumes 0.36 kWh a day.
Paired with a 5 kWh lithium cell storage, this setup can ensure an uninterrupted power supply for office equipment even during two consecutive days of rain, maintaining system reliability above 98%.
In summer, a 1000-watt system can provide limited cooling support without large cell assistance.
In cooling mode, a 1 HP inverter AC requires 300 W to 500 W to maintain temperature, which matches the real-time output of 1000-watt panels around 2 PM.
Running the AC for the four hours of peak sun will consume about 1.6 to 2.2 kWh, roughly 52% of the day's generation.
To prevent voltage fluctuations from shutting down the AC, a 3,000W pure sine wave inverter is recommended to handle the surge current—often 3 times the rated power—when the compressor starts.
Kitchen Considerations
A 1,200W coffee machine takes about 3 minutes to make an espresso, consuming only 0.06 kWh—almost negligible relative to the 4 kWh daily reserve.
Heating lunch with an 800W microwave for 15 minutes consumes 0.2 kWh, about 5% of the daily total.
A 1500W electric kettle boiling 1.5 liters of water in 5 minutes uses about 0.12 kWh. Boiling water 10 times a day only uses 1.2 kWh, leaving 2.8 kWh for other household chores.
Appliance | Rated Power (W) | Daily Use (Hrs) | Daily Usage (kWh) | 1,000W System Support |
Energy-Efficient Fridge | 150 | 24 (Intermittent) | 1.2 | 100% |
Laptop | 65 | 10 | 0.65 | 100% |
LED Light Group | 50 | 6 | 0.3 | 100% |
Smartphone | 15 | 3 (Charging) | 0.045 | 100% |
Inverter AC | 800 | 3 | 2.4 | 100% (Afternoon only) |
Coffee Maker | 1200 | 0.5 (Cumulative) | 0.6 | 100% |
Washing Machine | 500 | 1 (Cold wash) | 0.5 | 100% |
Calculating the Economics
Economically, in a region with an average electricity price of $0.18/kWh, a 1000-watt system creates $0.75 of value daily, totaling approximately $275.90 per year.
Assuming a total investment of $1,200 for the 1000-watt modules and a 100Ah LiFePO4 cell, the static payback period is about 4.35 years (without considering a 30% tax credit).
With federal clean energy subsidies, the initial investment drops to $840, shortening the payback period to 3.04 years.
Over a 25-year lifespan, this system can generate about 36,500 kWh. Based on inflation-adjusted electricity prices, it could save over $7,500 in power costs, with an Internal Rate of Return (IRR) typically between 15% and 18.5%.
With an annual natural power degradation of 0.5%, the system will still maintain a 950W peak capacity by the 10th year.
Spending $20 annually on two professional cleanings can prevent a 6% to 10% loss due to dust, effectively recovering $15 worth of electricity value annually.
For an inverter with a lifespan of about 10 years, it is recommended to budget $200 for a replacement in the 11th year. This maintenance cost accounts for only 2.6% of the system's 25-year total revenue.
Living Off-Grid
A 120W deep well pump running for 2 hours can extract about 3,000 liters of drinking water, consuming only 0.24 kWh (5.7% of output).
To ensure night-time power, the system needs a 48V 100Ah cell bank, providing 4.8 kWh of storage—perfectly matching the 4.2 kWh generated by the panels on a sunny day.
This configuration ensures 24-hour operation for security cameras (5W load), satellite internet receivers (50W load), and basic kitchen lighting, achieving over 95% energy self-sufficiency.
If 5% of daily power is used to charge an electric bike (approx. 500Wh cell), the 1000-watt system can fully charge it in 1.5 hours, supporting a 30km round-trip commute.
For DIY enthusiasts, the 1,000W real-time output easily drives a 750W AC drill continuously without worrying about the cell voltage dropping below the 10.5V protection threshold.
In extreme winter conditions where light shrinks to 2.5 hours, the 2.5 kWh output can still prioritize survival-level needs like refrigeration and lighting.
Through proper load management, a 1000-watt system provides a 100% power baseline for off-grid living.