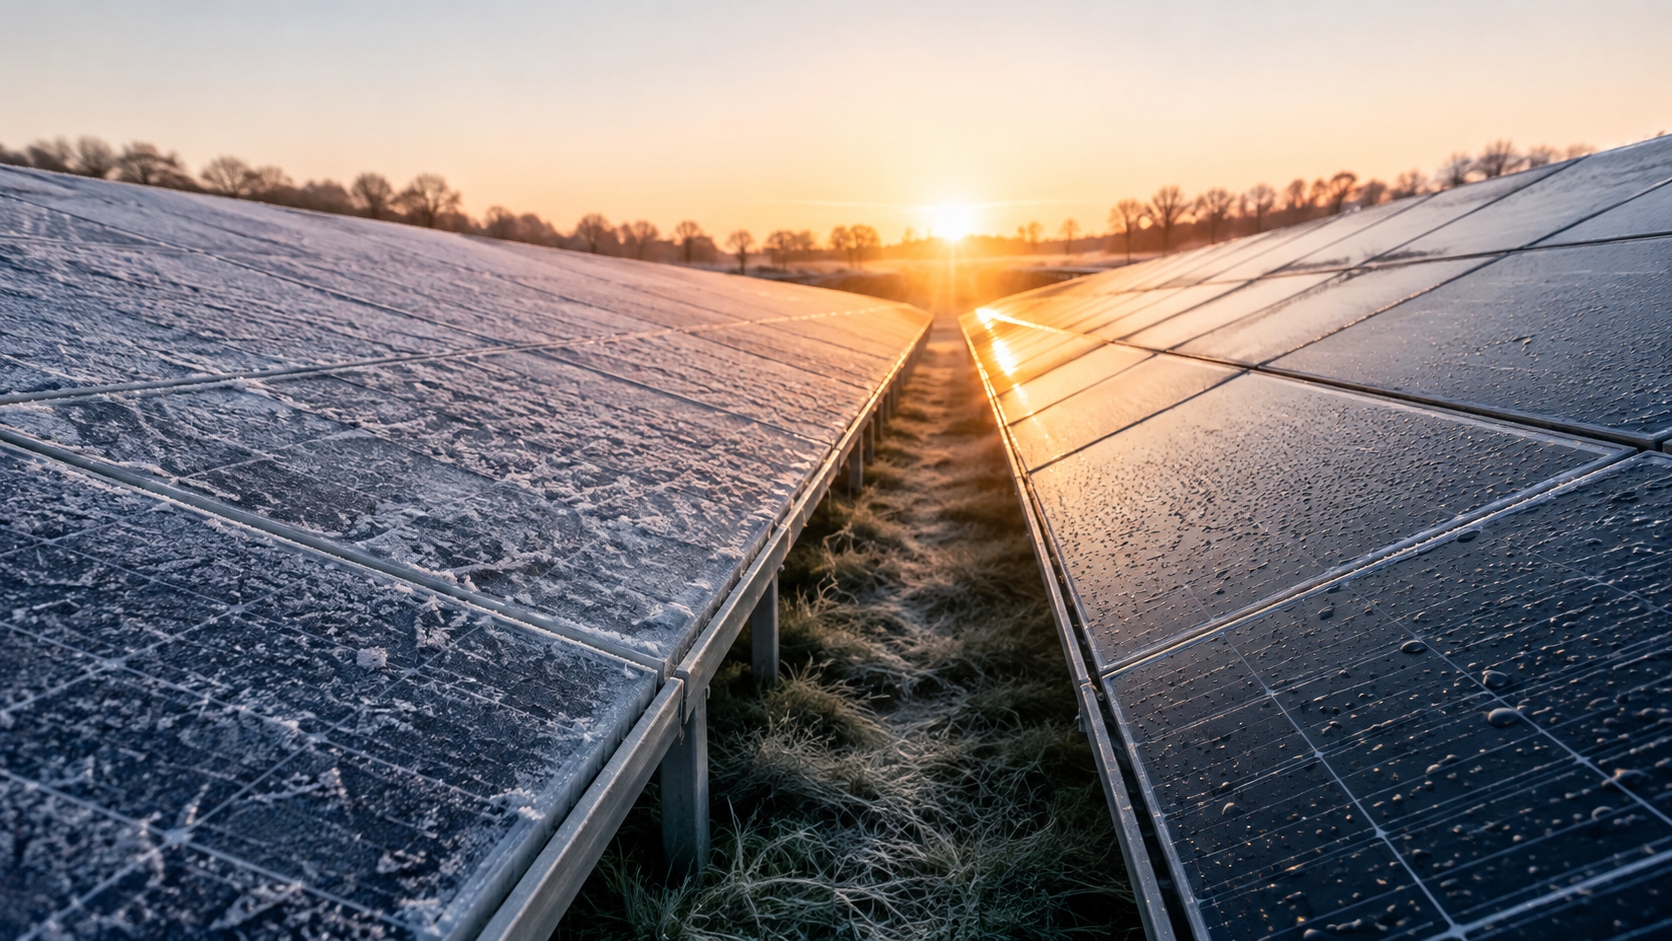
Different thaw times are usually normal. If one panel clears later than the others, start with the obvious site conditions: direct morning sun, frost amount, drainage, wind, mounting position, dirt, and module type. A slow-clearing panel is not automatically a bad panel. The more useful check is its power output once the frost has disappeared and the modules are receiving similar sunlight.
| What You See | Check First | What Matters |
|---|---|---|
| One panel clears 10–30 minutes later | Morning shade | When direct sun actually reaches the panel |
| Bottom edge stays icy | Drainage and refreezing | Water collecting near the lower frame |
| Outer panels behave differently | Wind exposure | More airflow around array edges |
| Same small patch remains every morning | Dirt or local shade | A repeatable surface or shading pattern |
| Panel stays weak after all frost is gone | Electrical performance | Whether the same difference appears under clear, frost-free conditions |
Check Direct Sun First
A weather app does not tell you the exact temperature of the module surface. Frost can still appear when the reported air temperature is above 0°C because the glass on the roof may be colder than the air around the weather station. The U.S. National Weather Service notes that exposed surfaces can become several degrees colder than standard air-temperature measurements during radiative cooling.[1]
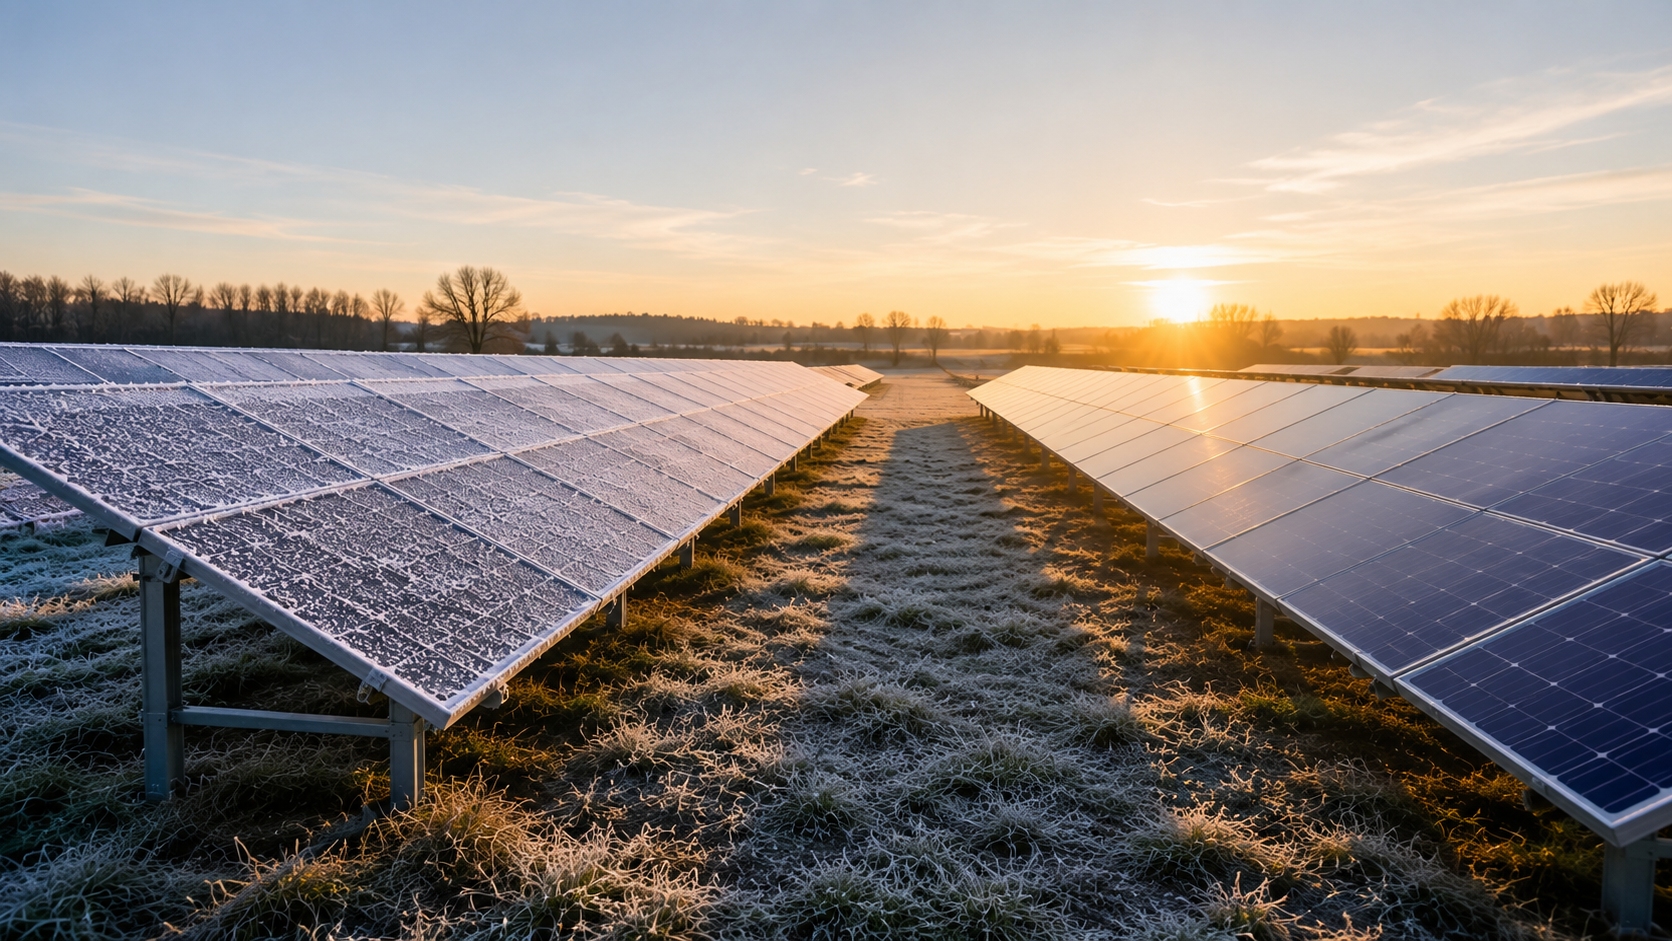
After sunrise, the number worth checking is not the official sunrise time. What matters is when direct sunlight actually reaches each module.
Take a simple example:
- Module A receives direct sun at 8:10 a.m.
- Module B remains behind a chimney shadow until 8:35 a.m.
- Module A receives 25 extra minutes of direct sunlight.
If Module A receives an average 300 W/m² during those 25 minutes, the incident solar energy is:
300 W/m² × 1,500 seconds = 450 kJ/m²
Not all of that 450 kJ/m² goes into melting frost. The module itself is warming at the same time, and heat is also being lost to the air. Even so, this amount of extra incoming energy is enough to show why a short shading delay can produce a large difference between neighboring panels.
On site, the usual sources are straightforward:
- chimneys;
- vent pipes;
- trees;
- roof ridges;
- parapets;
- nearby buildings;
- another row of modules.
These effects are easy to miss later in the day. Winter shadows are longer because the sun sits lower in the sky, so a vent that causes almost no shading at noon may still delay morning thaw across several cells.
The same applies to roof orientation. An east-facing roof may already be in direct sun while a west-facing roof is still receiving mostly diffuse light. Comparing their power at the same early-morning time does not tell you which module is healthier.
Compare the Amount of Ice
Two panels can look equally white and still hold different amounts of frozen water.
The surface may contain:
- light crystalline frost;
- frozen dew droplets;
- a thin clear ice film;
- refrozen meltwater near the lower edge.
Once ice is already at 0°C, it still needs about 334 kJ/kg of energy to melt.
The scale becomes easier to understand when the frost is expressed as water-equivalent thickness:
| Water-Equivalent Layer | Frozen Water per m² | Energy Needed to Melt It at 0°C |
|---|---|---|
| 0.05 mm | 0.05 kg | About 16.7 kJ |
| 0.10 mm | 0.10 kg | About 33.4 kJ |
| 0.20 mm | 0.20 kg | About 66.8 kJ |
These are calculation examples, not standard frost thicknesses. The practical takeaway is simple: if the amount of frozen water doubles, the energy needed to melt it roughly doubles as well.
That is why a panel with thicker frozen dew near the bottom edge can stay icy noticeably longer than the next panel, even when both looked similar at first glance.
Read the Frost Pattern
Where the frost remains is often more useful than how much of the panel is still white.
| Pattern | Most Useful Check |
|---|---|
| Whole roof face stays frosted | Orientation and morning sun |
| One complete row clears late | Row-to-row shading |
| Bottom 5–10 cm stays icy | Drainage and refreezing |
| Same corner remains every time | Local shadow or contamination |
| Array edges behave differently | Wind and airflow |
| Random pattern changes every morning | Weather and moisture differences |
A lower-edge ice strip is a common example. Frost melts, the water runs downward, and some of it can freeze again while the glass is still close to 0°C.
A patch that returns in exactly the same place is more useful for troubleshooting. In that case, look for a small shadow, bird residue, pollen, dirt, or another local difference on the surface.
Check Wind and Mounting Position
Modules at different positions in the same array can see different airflow.
Once sunlight has warmed a module above the surrounding air temperature, stronger airflow carries heat away faster. That is why edge modules can behave differently from modules in the middle of a row.
The gap behind the module is part of the same picture. An open-rack module can be cooled by air moving across both sides, while a close-roof installation usually has less airflow at the rear.
Sandia's module-temperature model uses solar irradiance, air temperature, wind speed, module materials, and mounting type. Its model parameters are different for open-rack and close-roof installations.[2]
For a panel that consistently clears later, check whether it is:
- at the outside edge of the array;
- higher or lower than neighboring modules;
- close to a roof obstruction;
- installed over a different roof section;
- part of an open-rack section while other modules have less rear airflow.
Check Tilt and Drainage
Tilt affects how sunlight reaches the module and where meltwater goes.
Water usually drains faster from a steeper module. On a low-slope module, partly melted frost can stay near the lower frame for longer. If the glass is still close to freezing, that water may freeze again.
If only the lower part stays frozen:
- check whether water is collecting at the lower frame;
- look for dirt or deposits in the same area;
- compare the module tilt with neighboring panels;
- check whether the lower edge receives a local shadow.
A lower frost band by itself does not mean the bottom cells are damaged. That conclusion only becomes reasonable if the electrical underperformance continues after the ice has disappeared.
Check Whether the Modules Are Actually the Same
Mixed arrays and replacement modules are easy to overlook. Two panels may look almost identical from the ground while having different glass, weight, cell layout, or rear construction.
Use the model numbers rather than appearance alone.
Tongwei's current module specifications show how large these construction differences can be. For example:
| Example Tongwei Module | Weight | Glass Construction | Cell Array |
|---|---|---|---|
| TNC-G12R 48 Bifacial | 22.4 kg | 1.6 mm front + 1.6 mm rear glass | 96 cells |
| TNC-G12R 66 Bifacial | 32.5 kg | 2.0 mm front + 2.0 mm rear glass | 132 cells |
A 22.4 kg module and a 32.5 kg module do not have the same amount of material to heat. That does not tell you which one will thaw first, because sunlight and airflow usually have a larger effect, but it does mean different module designs should not be expected to behave identically.
The manufacturer's technical documents can be used to confirm glass, module weight, cell layout, temperature coefficients, and other construction details.
Do Not Estimate Power Loss From Frost Area
10% visible frost does not mean 10% power loss.
The cells inside a module are connected in electrical groups. Frost that lands in the wrong place can limit one of those groups even if most of the glass is already clear.
In one NREL partial-shading test, 165 W crystalline-silicon modules contained three groups of 18 cells, each protected by a bypass diode. When more than about 40% of one cell was covered by an opaque shade in that specific test, the entire 18-cell group stopped contributing normally and its bypass diode conducted.[3]
Frost is not the same as opaque tape. Some frost still lets light through or scatters light onto the cells. The useful lesson from the test is that electrical loss does not always follow shaded area in a straight line when series-connected cells and bypass diodes are involved.
Compare these two frost patterns:
- 5% corner patch: concentrated in one small area.
- 5% horizontal strip: crosses many cells.
Both cover 5% of the module, but they do not have to produce the same power loss.
Check the Electrical Recovery
Once the glass is clear, the next check is electrical rather than visual.
The chain inside the system is straightforward:
- frost reduces light on some cells;
- those cells produce less current;
- the affected cell group becomes limited;
- a bypass diode may conduct if the mismatch becomes large enough;
- module voltage and power change;
- the inverter adjusts its operating point.
Current Tongwei G12R module data, for example, lists an IP68 junction box with three diodes on several module configurations. The exact cell grouping still depends on the individual design.
The inverter can make the recovery look more sudden than it really is. Modules may already be producing some DC voltage before the inverter reaches its normal operating range. Once voltage, available power, and MPPT conditions are suitable, the AC output shown in monitoring can rise quickly.
Systems with microinverters or module-level power electronics can make panel-to-panel differences easier to see than systems that report only total string power. NREL testing has specifically examined how module-level power electronics change system behavior under partial shading.[4]
Monitoring timestamps also warrant caution. Apps may average readings, store data, or upload it at intervals. The time shown in the portal is not necessarily the exact second when the physical frost disappeared.
Compare Output Under the Same Conditions
Power comparisons are useful only after the frost is gone and the sunlight is reasonably stable.
Use modules with the same or similar:
- model;
- rated power;
- orientation;
- tilt;
- shading;
- surface condition.
When the ratings differ, compare the percentage of rated power rather than the raw wattage.
| Module Rating | Measured Output | Output vs. Rated Power |
|---|---|---|
| 400 W | 200 W | 50% |
| 500 W | 250 W | 50% |
The second module is producing 50 W more, but both modules are operating at the same percentage of nameplate power.
Nameplate power is normally measured at Standard Test Conditions: 1,000 W/m² irradiance and 25°C cell temperature. A 450 W module is not expected to produce 450 W during weak morning sunlight just because its glass has cleared.
Cold itself is not necessarily a disadvantage. The U.S. Department of Energy notes that PV modules generally operate efficiently in cold conditions, while snow and ice reduce power mainly by blocking sunlight.[5]
Tongwei's current G12R specifications list a Pmax temperature coefficient of about -0.28%/°C. Under the same irradiance, a simplified 20°C temperature difference gives:
20 × 0.28% = 5.6%
This 5.6% figure describes the temperature effect only. Outdoor output also changes with irradiance, wind, spectrum, sun angle, and inverter operation.
A module that clears frost first is therefore not automatically the more efficient module. Thaw speed and electrical efficiency are two different measurements.
Use 3–5 Morning Records
One frosty morning is too little information to diagnose a panel. A more useful check is to record 3–5 comparable mornings.
Note:
- time;
- air temperature;
- time direct sun reaches the module;
- visible frost pattern;
- visible shadows;
- time the glass becomes clear;
- module output after clearing, if module-level monitoring is available.
Here is a normal example:
| Time | Module A | Module B | Module C |
|---|---|---|---|
| 08:10 | Frosted | Frosted | Frosted |
| 08:30 | Clear | 50% frost | 80% frost |
| 08:50 | Clear | Clear | 20% frost |
| 09:10 | 210 W | 207 W | 205 W |
Module C clears last, but after clearing it is only about 2.4% below Module A:
(210 - 205) ÷ 210 × 100 ≈ 2.4%
That result does not point strongly to a module fault.
Now compare it with this case:
| Time | Module A | Module B | Module C |
|---|---|---|---|
| 09:10 | Clear | Clear | Clear |
| 10:00 | 250 W | 246 W | 175 W |
| 11:00 | 280 W | 275 W | 190 W |
Compared with Module B, Module C is about 29% lower at 10:00 and 31% lower at 11:00:
(246 - 175) ÷ 246 × 100 ≈ 29%
(275 - 190) ÷ 275 × 100 ≈ 31%
29% or 31% is not a universal failure threshold. What matters is that a large gap remains at two separate times after all three modules are already clear.
Investigate Persistent Problems
Further inspection makes sense when the same module keeps showing the same problem after the weather-related differences are gone.
- output remains clearly lower after frost has disappeared;
- the same difference appears on frost-free sunny days;
- the problem is new after years of normal operation;
- the same module repeatedly appears as an outlier in module-level monitoring;
- glass is cracked;
- there is visible discoloration or delamination;
- the back of the module is damaged;
- the junction box, cable, or connector is visibly damaged;
- the inverter, optimizer, or microinverter repeatedly reports faults.
IEC 61215-1:2021 covers design qualification and type approval for terrestrial PV modules intended for long-term outdoor operation. The standard also states that qualification results are not a quantitative prediction of module service life.[6]
A frost pattern is not a recognized pass/fail test for module quality.
A qualified technician can check the problem with:
- historical monitoring data;
- visual inspection;
- thermal imaging under suitable irradiance;
- voltage and current measurements;
- I-V curve testing;
- string and insulation checks.
Avoid Unsafe Frost Removal
- Do not scrape the glass. Hard tools can scratch glass or damage surface coatings.
- Do not pour hot water on frozen modules. Runoff can freeze again on the roof, rails, gutters, or walkways.
- Do not apply general de-icing chemicals. Residue may be incompatible with module materials and can remain on the glass.
- Do not unplug PV connectors. Modules can produce DC voltage whenever enough light is present.
- Do not climb onto an icy roof to recover a small amount of morning energy.
For Tongwei modules, use the manufacturer's installation and maintenance documents for cleaning, handling, mounting, and electrical requirements.
IEC 61730-1:2023 covers construction requirements intended to reduce electrical shock, fire, and mechanical safety risks in PV modules.[7]
Heavy snow or ice is a different issue from light morning frost. Tongwei's current G12R module data lists 2,400 Pa wind load and 5,400 Pa snow load for several configurations. These are product specifications, not universal limits for every module or mounting system.
Finally
Use thaw time as a clue, not a failure test. Start with direct sun, then check ice amount, drainage, wind, mounting, dirt, and module model. Ice needs about 334 kJ/kg to melt at 0°C, while a 25-minute difference at 300 W/m² represents about 450 kJ/m² of extra incident sunlight. Record 3–5 comparable mornings and compare output only after the glass is clear. A module that clears late but then matches its neighbors is usually behaving normally. If the same module stays roughly 30% lower in repeated, matched, frost-free comparisons, electrical inspection is justified.