When flash-test repeatability gets worse after thermal cycling, the problem is usually either inside the module or in the test setup. If Isc and Voc stay almost unchanged but fill factor and Pmax move by several watts, check resistance, solder joints, ribbons and contacts. If Voc moves with temperature, let the module stabilize first. If a control module moves with the DUT, look at the tester. If the DUT is stable until it is lifted and reloaded, cracks, interconnects, connectors and positioning move higher on the suspect list.
IEC 60904-1 defines the measurement of PV current-voltage characteristics and includes guidance on data analysis, capacitive devices, dark I-V curves and the effect of uneven irradiance.[1]
Quantify the Repeatability Change
One before-and-after flash is not enough. Run several flashes under the same conditions and keep the full set of values:
- Pmax
- Voc
- Isc
- Vmp
- Imp
- Fill factor
- Module temperature
- Irradiance
- Full I-V curve
- Measurement time
For troubleshooting, the comparison that matters is:
Pre-TC DUT → Post-TC DUT → Stable control module
The following data are illustrative:
| Data Set | Mean Pmax | Sample SD | CV | Range |
|---|---|---|---|---|
| Pre-TC DUT | 450.12 W | 0.084 W | 0.019% | 0.20 W |
| Post-TC DUT | 445.02 W | 1.748 W | 0.393% | 3.90 W |
| Control | 451.96 W | 0.055 W | 0.012% | 0.10 W |
CV is standard deviation divided by the mean, expressed as a percentage.
Here, average Pmax drops by 1.13%. The bigger warning sign is repeatability: CV rises from 0.019% to 0.393%. That is about 21 times the pre-TC value, while the control remains tight.
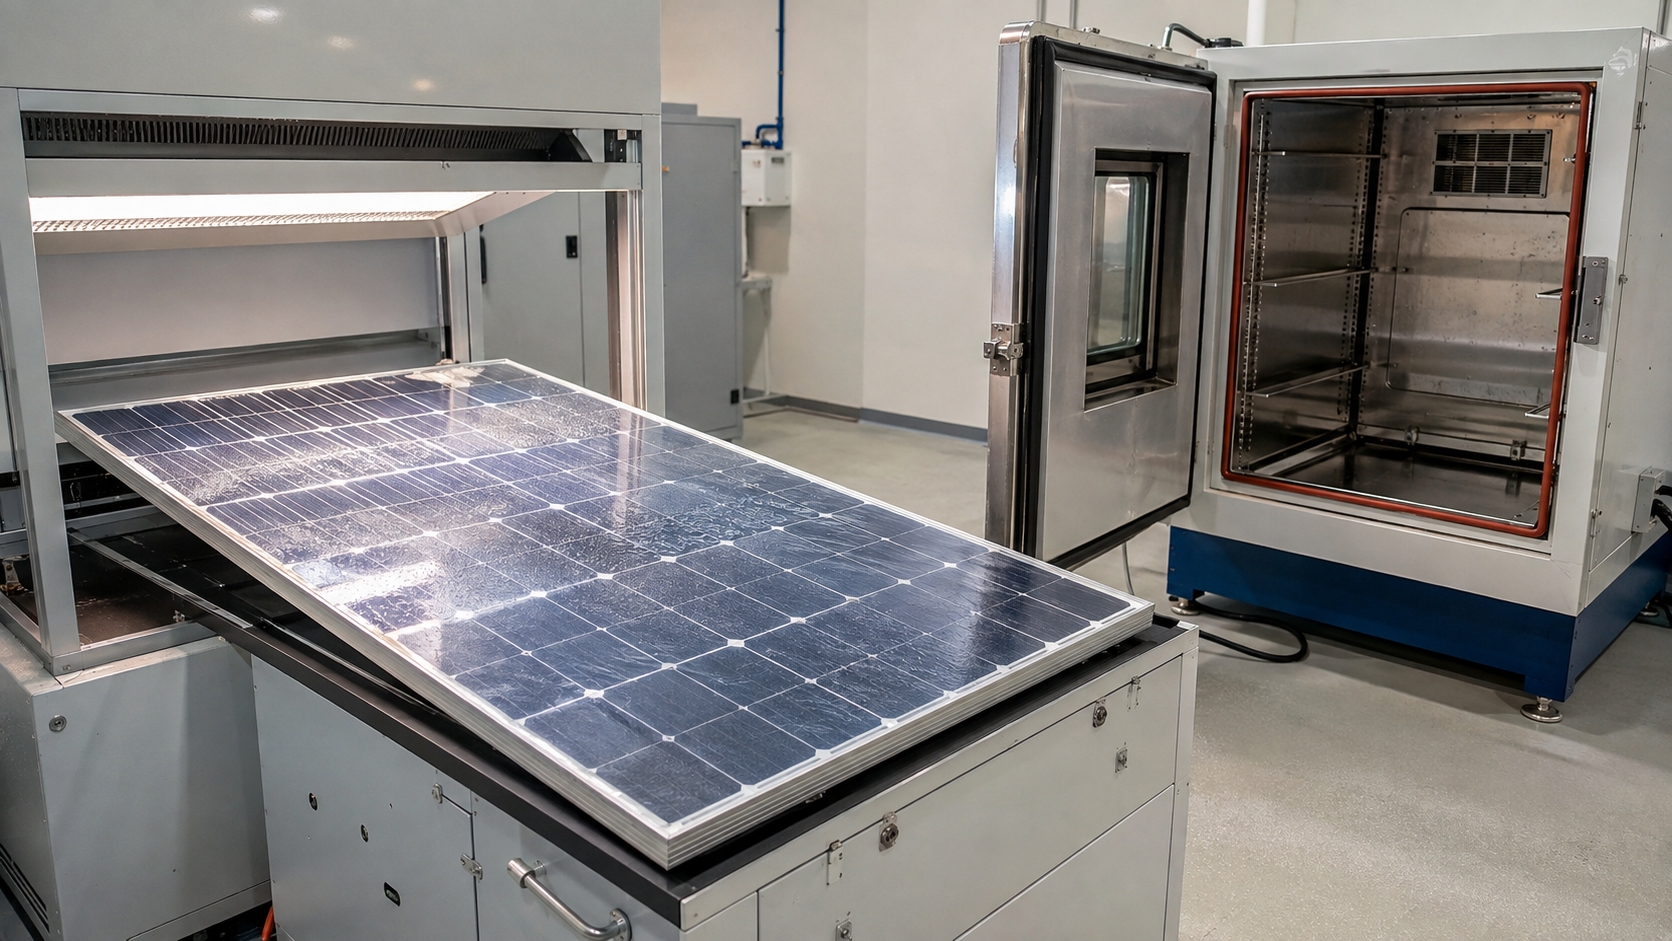
These example values are not universal pass/fail limits. A CV of 0.3%, 0.5% or any other number cannot be used as an automatic threshold for every module and every flash tester.
IEC 60904-9 evaluates solar simulators for spectral match, spatial irradiance non-uniformity and temporal instability, so tester performance has to be separated from DUT behavior.[2]
Classify Scatter, Drift or Jumps
| Pattern | Illustrative Pmax Data | Numerical Sign | Check First |
|---|---|---|---|
| Random scatter | 447.8, 444.9, 448.3, 445.1 W | 3.4 W range | Intermittent contact, crack, connector, tester variation |
| Steady drift | 445.2, 446.1, 446.8, 447.6 W | +2.4 W from first to last | Temperature, drying, stabilization |
| Sudden jump | 447.4, 447.5, 441.2, 441.4 W | 6.3 W one-step drop | Intermittent connection, fixture, crack, substring change |
Random scatter usually points to something that does not behave the same way twice. A weak contact or partly damaged current path can do exactly that.
Steady drift looks different. When each reading moves in the same direction toward a stable value, temperature or another stabilization effect is more likely.
A sudden jump deserves closer attention. A sharp move from one power level to another fits a contact, ribbon, crack or substring changing state better than it fits slow thermal stabilization.
Do not treat these three patterns as if they were the same. If a module switches between 441 W and 447 W, the average value of 444 W may not represent a real stable state at all.
Separate Stable Loss from Intermittent Loss
Take this set first:
445.1, 445.0, 445.2, 445.1 W
Range: 0.2 W
If the same module produced about 450 W before TC, power has dropped, but the new condition is stable.
Now compare it with:
448.0, 443.1, 447.2, 442.4 W
Range: 5.6 W
This second module is not sitting in one electrical state. Temperature, bending, contact pressure, cracked current paths and weak interconnects can all produce this kind of spread.
Stable degradation and poor repeatability are two different results and should be reported separately.
Check Solder Joints and Interconnects
IEC 61215 qualification includes 200 thermal cycles from approximately -40°C to +85°C to help expose degraded solder bonds and broken interconnects. NREL documents the same TC200 condition and its use for these failure modes.[3] IEC 61215-2 contains the module qualification test procedures.[4]
Tongwei also describes 400 rapid hot-cold cycles from 85°C to -40°C in its internal module reliability testing.
After repeated heating and cooling, the places worth checking are straightforward:
- solder bonds,
- cell-to-ribbon joints,
- interconnect ribbons,
- busbar connections,
- junction-box current paths.
A fully failed joint often gives a stable loss. A partly failed joint is harder to catch because its resistance can change with temperature or mechanical stress.
The following illustrative data show the kind of electrical pattern this can create:
| Parameter | State A | State B | Change |
|---|---|---|---|
| Isc | 13.45 A | 13.44 A | -0.01 A |
| Voc | 41.90 V | 41.88 V | -0.02 V |
| Fill factor | 79.4% | 78.7% | -0.7 percentage points |
| Pmax | 447.5 W | 443.0 W | -4.5 W |
Isc changes by only 0.07% and Voc by about 0.05%, yet Pmax falls by 4.5 W. Most of the movement is in fill factor. In practice, that pushes the investigation toward the current path rather than toward a large change in generated current.
Check Series Resistance
Internal module resistance can come from:
- cell metallization,
- solder joints,
- ribbons,
- busbars,
- internal conductors,
- junction-box connections.
When that resistance rises, the usual signs are:
- lower fill factor,
- lower Pmax,
- a rounder I-V knee,
- lower current in the high-voltage part of the curve.
IEC 60891 covers temperature and irradiance corrections and includes supplementary methods for series-resistance determination.[5]
Keep the module and the test chain separate in the diagnosis. Test leads, adapters, fixture contacts and tester relays can also add resistance, but that resistance is outside the module.
Lower FF is not enough to call a solder failure. Shunting, mismatch, temperature and sweep timing can move FF as well.
Check Cell Cracks
A visible crack does not automatically mean an immediate power loss. Fingers, busbars or other conductive paths may still carry current across the damaged area.
NREL reports that cracks can initially remain electrically bridged and that further thermal or mechanical cycling can damage those remaining contacts and make the performance loss more severe.[6]
For practical inspection, crack length alone is not very useful. Look at where the crack runs:
- Does it cross a busbar?
- How many fingers does it cut?
- Does it isolate a large cell area?
- Is another current path still available?
NREL field observations have also shown that modules can contain extensive visible cracks while measured power loss remains small, which is why an EL image alone should not be used to assign power loss.[6]
A crack-related fault becomes more convincing when several things line up:
- Isc remains nearly stable,
- FF or Imp changes,
- Pmax changes after handling,
- EL shows a crack crossing a useful current path.
Rule Out Temperature Error
For current TNC G12R modules, Tongwei lists a Pmax temperature coefficient of about -0.28%/°C and a Voc coefficient of about -0.24%/°C on its module application and specification page. For a real test, use the DUT's own datasheet; Tongwei's current files are available through its technical download center.
Using -0.28%/°C as a product example:
| Temperature Difference | Raw Pmax Change | Approx. Change on 450 W |
|---|---|---|
| 1°C | 0.28% | 1.26 W |
| 2°C | 0.56% | 2.52 W |
| 5°C | 1.40% | 6.30 W |
These values show the raw size of the temperature effect. They are not estimates of final corrected measurement error.
A temperature-driven run can look like this:
| Flash | Temperature | Voc | Pmax |
|---|---|---|---|
| 1 | 27.2°C | 49.51 V | 447.0 W |
| 2 | 26.5°C | 49.63 V | 447.8 W |
| 3 | 25.8°C | 49.73 V | 448.4 W |
| 4 | 25.3°C | 49.80 V | 448.7 W |
| 5 | 25.1°C | 49.82 V | 448.8 W |
Temperature drops 2.1°C, Voc rises 0.31 V, and Pmax rises smoothly 1.8 W. That is the sort of pattern you would expect from stabilization, not from a contact randomly opening and closing.
NREL identifies temperature uncertainty and source spatial non-uniformity as major contributors to module power-calibration uncertainty.[7]
Before trusting corrected data, check the temperature measurement itself:
- same position before and after TC,
- good contact with the module rear surface,
- no loose sensor or thick insulating tape,
- valid calibration,
- stable reading over consecutive flashes.
Software can correct a measured temperature difference. It cannot correct a cell temperature that was never measured correctly.
Rule Out Condensation
Condensation only deserves much attention when the module has just come out of a cold chamber.
Look for:
- visible or thin moisture film on the glass,
- high room humidity,
- Isc changing as the surface dries,
- readings becoming stable after waiting.
If the module has already been dry and thermally stable for hours and the scatter remains, condensation is unlikely to be the main cause.
Rule Out Tester and Contact Error
Use a stable control between DUT flashes:
Control → DUT → Control → DUT → Control → DUT
Illustrative result:
| Sequence | Control | DUT |
|---|---|---|
| 1 | 452.0 W | 446.8 W |
| 2 | 451.9 W | 443.4 W |
| 3 | 452.0 W | 445.9 W |
The control range is 0.1 W. The DUT range is 3.4 W.
With that result, broad flash-source drift becomes less likely, although it still does not prove that the fault is inside the DUT.
If both modules move together, check:
- flash irradiance,
- reference device,
- tester timing,
- measurement electronics,
- temperature.
IEC 60904-9 specifically treats temporal instability and spatial irradiance non-uniformity as solar-simulator performance characteristics.[2]
The external connection path is also worth checking before moving to advanced failure analysis:
- module connectors,
- adapters,
- test cables,
- fixture contacts,
- measurement relays.
Reconnect the DUT and repeat the measurement before assigning a resistance increase to an internal solder joint.
Test What Happens When the Module Is Moved
Run one set without touching the DUT, then another after unloading and reloading it.
Illustrative data:
| Condition | Pmax Readings | Range |
|---|---|---|
| Module not moved | 446.8, 446.9, 446.7, 446.8, 446.9 W | 0.2 W |
| Reloaded before every flash | 446.7, 444.1, 447.0, 443.9, 446.5 W | 3.1 W |
The range grows from 0.2 W to 3.1 W after reloading. Something changed by handling is now affecting the result.
Check:
- cell cracks,
- ribbon and solder joints,
- connector pressure,
- fixture contacts,
- module position in the light field.
Reloading does not prove a crack because several conditions change at once. Use it to decide what to test next.
Check Light-Field Sensitivity
A stressed module may react more strongly to local light differences if it has:
- cell mismatch,
- a partly isolated cell region,
- a weak current path.
IEC 60904-9 defines how simulator spatial non-uniformity is evaluated.[2]
If healthy control modules also shift after repositioning, the tester or positioning method deserves attention. If only the TC-stressed DUT reacts strongly, the better working assumption is that the DUT has become more sensitive to local illumination.
Check Sweep Direction and Flash Time
If the tester supports controlled changes, compare:
- Forward vs. reverse sweep
- Fast vs. slower sweep
- Different allowed flash durations
IEC 60904-1 includes specific measurement guidance for PV devices with significant capacitance.[1]
When the same DUT repeatedly gives different results under different sweep directions, measurement dynamics are part of what you are seeing.
If the sweep method did not change and repeatability was good before TC, do not blame the sweep method by itself. A more useful question is whether TC changed the module enough to make that same method more sensitive.
Module architecture matters too. Current module designs use different cell formats, busbar counts, interconnection methods and glass structures. IEA PVPS also reports that newer TOPCon, SHJ, multi-wire and glass/glass designs can introduce different reliability behavior and failure modes.[8]
Use the I-V Curve to Choose the Next Test
| Observed Change | First Checks |
|---|---|
| Isc moves strongly | Irradiance, optical condition, reference device, mismatch |
| Voc tracks temperature | Thermal stabilization and sensor accuracy |
| FF moves while Isc and Voc stay tight | Resistance, solder joints, ribbons, contacts |
| Imp changes after handling | Cracks, interconnects, contact pressure |
| New step or kink | Cell mismatch, partial isolation, substring or bypass behavior |
| Control and DUT move together | Tester, temperature, irradiance, reference system |
In the earlier 447.5 W versus 443.0 W example, Isc moves only 0.01 A and Voc only 0.02 V, while FF drops 0.7 percentage points. That is enough to shift the investigation toward the current path rather than toward a large irradiance change.
Use EL to Check the Suspected Area
IEC TS 60904-13 covers capture, processing and interpretation of PV module electroluminescence images.[9]
For a fair before-and-after comparison, keep these conditions similar:
- injection current,
- camera settings,
- exposure,
- module temperature,
- image scaling.
Look for:
- new dark areas,
- cracks crossing busbars,
- loss of finger connectivity,
- dark regions close to ribbons,
- areas that change after reloading.
Tongwei's EL testing article also covers microcracks, soldering defects and electrically inactive regions.
Do not convert EL dark area directly into the same percentage of Pmax loss. A dark or cracked region may still have another current path.
Use Dark I-V and Thermography to Confirm Resistance Damage
Dark I-V can help separate electrical problems from some flash-source and optical effects. NREL-supported research on stressed crystalline-silicon modules identifies increased series resistance, shunting, recombination and current mismatch from fractured cell areas as separate power-loss mechanisms that can be studied with dark I-V data.[10]
If the same abnormal resistance behavior also appears in dark I-V, an electrical-path problem becomes more likely.
A normal dark I-V result does not rule out every module fault. Some intermittent failures only appear at certain current, light, temperature or mechanical conditions.
Thermography gives another check. A weak solder joint or damaged connection may force current through a smaller conductive area and create local heating.
Peer-reviewed NREL-linked work connected solder-bond failures with increased module series resistance and characteristic local heating patterns.[11]
A hot area that lines up with the same ribbon or solder region seen in EL and I-V data carries much more weight than any one test on its own.
Check Bypass and Junction-Box Faults When Voltage Steps Appear
A new voltage step or a switch between two clear voltage states is a good reason to inspect:
- bypass diodes,
- junction-box solder or welded joints,
- substring connections,
- severe cell mismatch.
A permanently shorted bypass diode normally gives a more stable missing-voltage signature. A result that moves back and forth between states fits an intermittent connection or changing substring condition better.
Use This Test Order
- Stabilize temperature. Record temperature until it stops moving enough to explain the electrical drift.
- Check the glass and connectors. Remove condensation and rule out obvious external contact problems.
- Flash the DUT without moving it. Save every I-V curve.
- Interleave a stable control. Separate DUT scatter from tester drift.
- Reload the DUT. Check whether handling increases the range.
- Compare I-V parameters. Decide whether Isc, Voc or FF drives the change.
- Change sweep settings only if relevant. Look for a repeatable forward/reverse or timing effect.
- Run EL. Find a physical area that matches the electrical symptom.
- Use dark I-V or resistance measurements. Check whether the same electrical problem remains.
- Use thermography. Look for heating at the suspected current path.
- Use a second qualified tester for high-value disputes. Reproduce the result independently when certification, warranty or supplier decisions depend on it.
Read a Complete Example
Illustrative pre-TC Pmax:
450.2, 450.0, 450.1, 450.2, 450.1 W
- Mean: 450.12 W
- CV: 0.019%
- Range: 0.20 W
Illustrative post-TC Pmax after temperature stabilization:
446.8, 442.9, 446.1, 443.4, 445.9 W
- Mean: 445.02 W
- CV: 0.393%
- Range: 3.90 W
- Mean loss vs. pre-TC: 1.13%
Additional observations:
- Control-module range: 0.10 W
- DUT range during the control sequence: 3.40 W
- Stationary DUT range: 0.20 W
- Reloaded DUT range: 3.10 W
- Isc difference between two electrical states: 0.01 A
- Voc difference: 0.02 V
- Fill-factor difference: 0.7 percentage points
- Pmax difference: 4.5 W
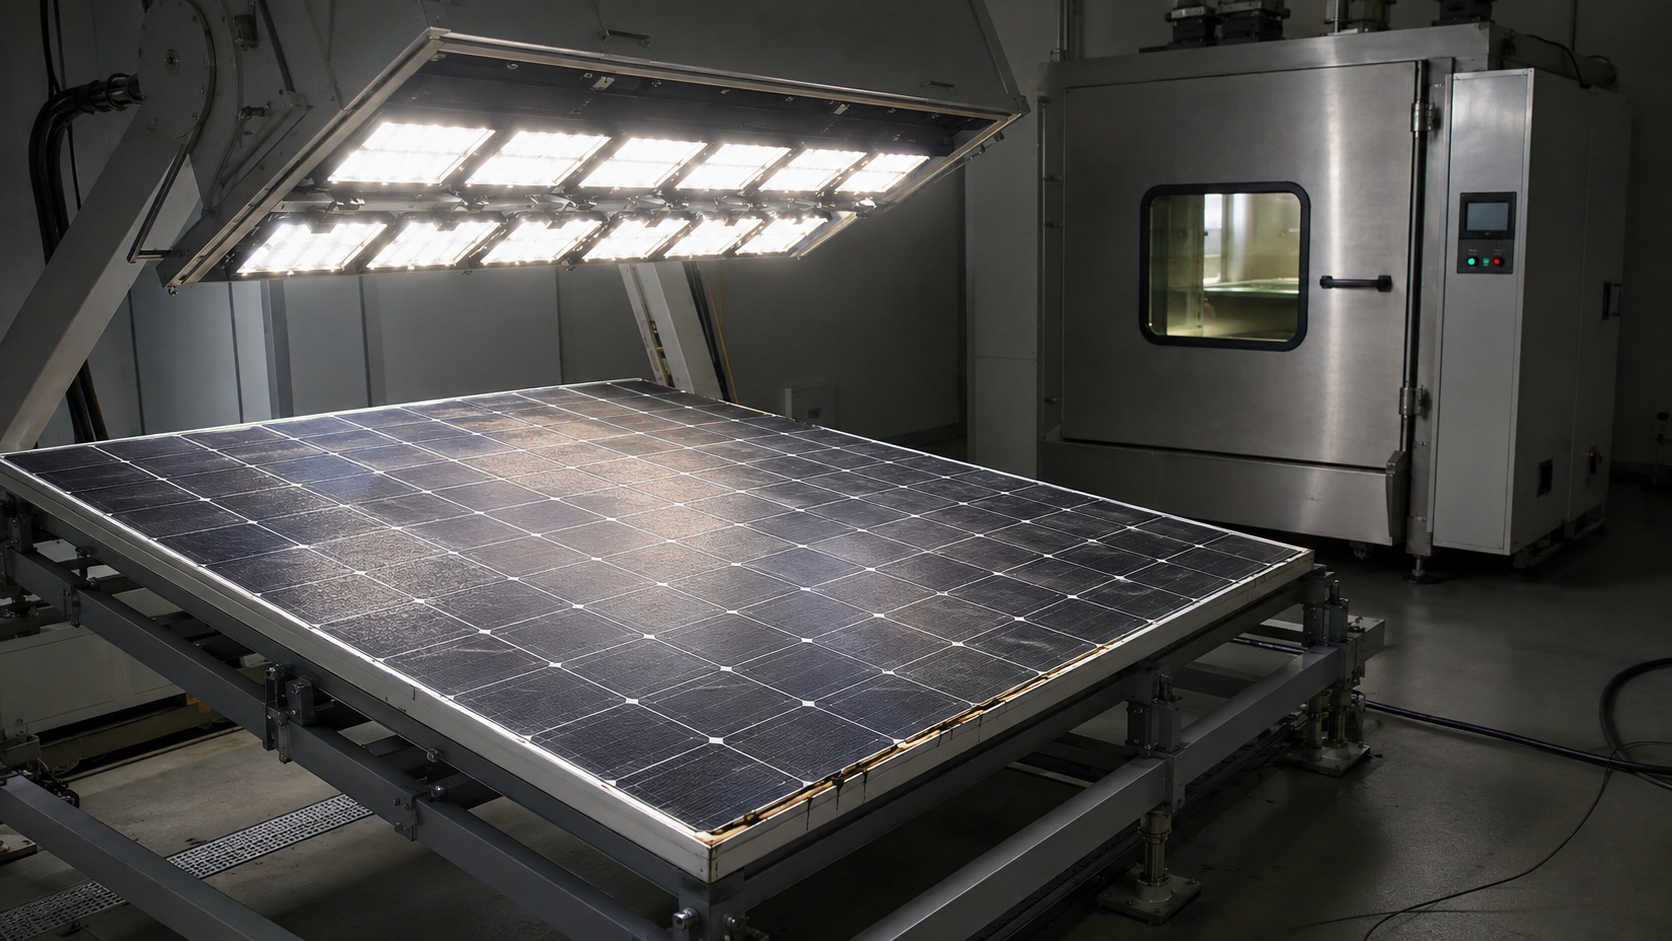
Put those numbers together and the picture is fairly clear. Simple temperature drift or broad tester drift is a weaker fit. A resistance problem that reacts to handling is a stronger fit. If EL then shows a crack or damaged interconnect in the same current path, and dark I-V or thermography points to the same area, an internal electrical defect becomes the stronger explanation.
Avoid These Wrong Conclusions
| Do Not Assume | Use This Check Instead |
|---|---|
| Pmax fell, so TC caused permanent damage. | Compare repeatability, control data and temperature first. |
| An EL crack caused the power loss. | Match the crack location with the I-V symptom and another test. |
| Temperature correction removes all temperature problems. | Verify that the sensor represents the module temperature. |
| A calibrated tester cannot scatter. | Use an interleaved stable control. |
| Lower FF proves solder failure. | Rule out connectors, mismatch, shunting and sweep effects. |
| Averaging unstable readings solves the problem. | Check whether the DUT is switching between different states. |
| More than 0.5% variation automatically means failure. | Use the laboratory's own uncertainty, baseline and acceptance criteria. |
Stop Testing if the Module Is Unsafe
Stop ordinary flash-repeatability testing and follow the laboratory's damaged-module procedure if the DUT has:
- broken glass,
- exposed conductors,
- burnt or melted connectors,
- damaged junction-box parts,
- severe local heating,
- suspected insulation failure.
Finally
Use the numbers to decide where to look. A module that falls from 450.12 W to 445.02 W but still repeats within 0.2 W is not behaving like one that spreads over 3–5 W after TC. If the control stays within 0.1 W, temperature is stable, Isc and Voc barely move, FF changes, and reloading expands the DUT range from 0.2 W to 3.1 W, the current path should be checked first. That puts solder joints, ribbons, cell cracks and connectors at the top of the list. EL, dark I-V or thermography should then be used to confirm the same location before the root cause is assigned.