What Are the Main Modules of Solar Cell
The core consists of silicon wafers (P-N junctions), with an efficiency of approximately 22%.
It is laminated and encapsulated with tempered glass, EVA, and a backsheet, utilizing silver grid lines for conduction, with a lifespan exceeding 25 years.
Multiple layers of precision structures collectively ensure high-efficiency photoelectric conversion and long-term durability.
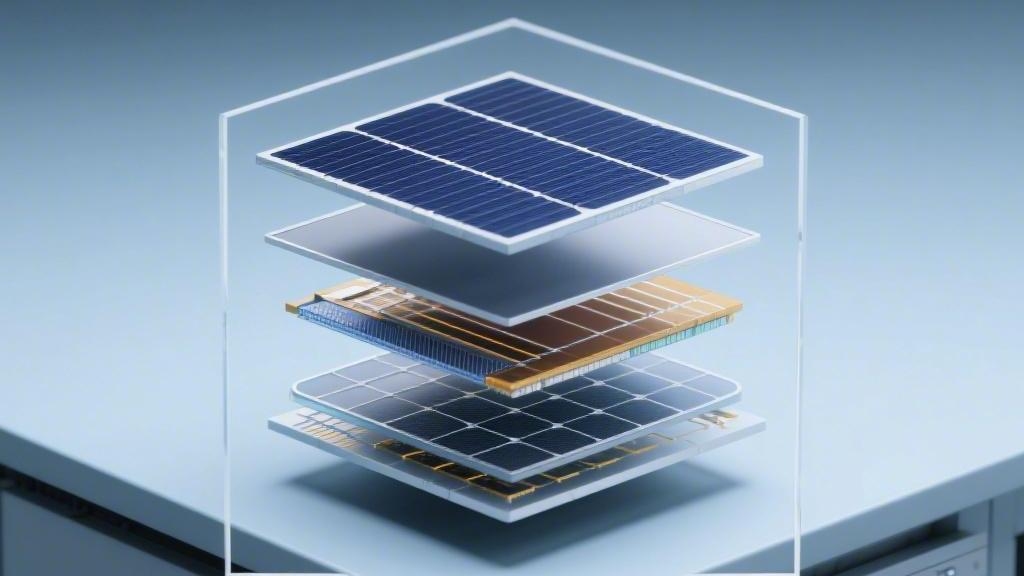
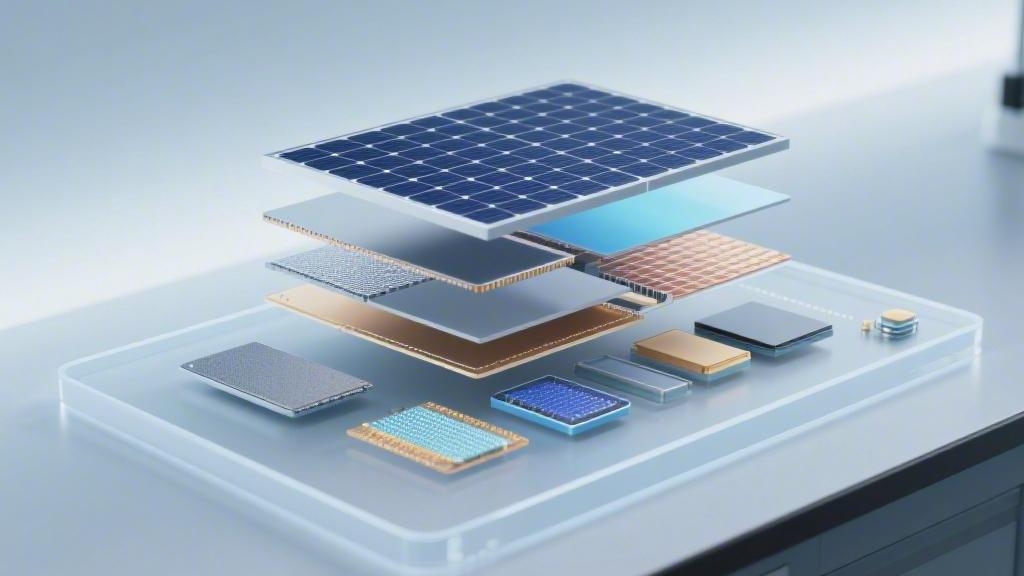
Main Modules
Silicon Wafer Cells
Monocrystalline silicon wafers in 182 mm and 210 mm specifications account for over 95% of the market share in 2024.
These thin wafers, with a thickness of only 130 to 150 microns, form P-N junctions through doping with elements such as phosphorus and boron.
Current N-type TOPCon cells have surpassed 26% conversion efficiency in laboratories, with average mass production efficiency stabilizing between 24.5% and 25.5%.
Parameter Name | Specification Data | Performance Impact |
Wafer Thickness | 130 to 150 microns | Reduces material costs by approximately 5% |
Number of Grid Lines | 16 to 18 lines | Reduces series resistance loss by about 0.2% |
Single Cell Power | 7.5 W to 10.5 W | Determines total module power from 400 W to 700 W |
The silver paste lines on the cell surface utilize an 18-busbar design to shorten the current conduction path, reducing internal resistance losses by approximately 15%.
Under standard illumination of 1,000 W/m², each cell can generate an open-circuit voltage of approximately 0.68 V.
This precise semiconductor structure is very fragile; pressure exceeding 200 MPa can cause micro-cracks invisible to the naked eye, necessitating strong external cladding.
Protective Armor Glass
Low-iron tempered glass with a thickness of 3.2 mm serves as the first line of defense for the cells, with iron content strictly controlled below 0.015%.
The light transmittance of this material is typically between 91.5% and 94%, with the surface undergoing nano-scale texturing to reduce light reflection.
Experimental data indicates that glass with an anti-reflective (AR) coating can provide an additional power output increase of approximately 2.5% for the module.
Test Item | Experimental Standard | Data Performance |
Impact Resistance | 25 mm Hailstone Test | No damage at 23 m/s impact |
Static Load Pressure | IEC 61215 Standard | Withstands 5400 Pa frontal pressure |
Transmittance Degradation | 25-year Aging Test | Degradation less than 0.8% |
After 25 years of outdoor wind and sand erosion, the surface hardness of qualified tempered glass remains above Mohs level 6.
It must not only withstand wind impacts of 80 km/h but also filter out most ultraviolet wavelengths harmful to the cells.
To tightly bond this hard glass with the fragile silicon wafers, a thermoplastic cushioning substance must be filled in between.
Encapsulation Film
In a vacuum lamination furnace at 145 degrees Celsius, the 450-micron thick EVA film undergoes a cross-linking reaction to secure the glass and cells together.
High-performance modules currently favor EPE (EVA and POE composite) structures, reducing the water vapor transmission rate to 0.5 g/m² per day.
This film typically maintains a Yellowness Index (YI) within 3 units after 2000 hours of UV aging experiments.
Material Type | Blocking Efficiency | Cost Percentage |
EVA Film | 75% Cross-linking degree | Approx. 5% of total module cost |
POE Film | 0.2 g Water vapor transmission | Improves long-term reliability by 3% |
Lamination Time | 15 to 18 minutes | Determines 100% encapsulation airtightness |
The light transmittance of the film must be maintained above 90% to ensure light energy reaches the silicon surface for conversion efficiently.
Good encapsulation allows the module to keep power loss below the 3% standard value in Potential Induced Degradation (PID) tests.
Once the front encapsulation process is complete, the back of the module requires a material with a high insulation rating to prevent leakage.
Backsheet Protection
The 0.3 mm thick TPT composite backsheet provides DC insulation capability of up to 1500 V, ensuring system operational safety.
The backsheet is composed of three laminated layers: fluorine film, polyester film, and fluorine film, performing excellently in "Double 85" experiments (85°C, 85% humidity).
After 3000 hours of damp-heat aging, the peel strength of the backsheet is required to remain greater than 4 N/cm to prevent the laminated modules from detaching.
Insulation Parameter | Performance Indicator | Protection Cycle |
Breakdown Voltage | Greater than 20 kV | Covers 25-year lifecycle |
Thermal Shrinkage | Less than 1.5% | Prevents deformation at 150°C |
Flame Retardancy | UL 94-V0 Level | Self-extinguishes within 10 seconds |
If the infrared reflectance of the backsheet reaches over 80%, it can reduce the operating temperature of the cells by 1 to 2 degrees Celsius.
For every 1-degree reduction in temperature, the power generation of monocrystalline modules increases by about 0.35%, which is crucial for improving annual yield.
While these multi-layer composite materials offer excellent performance, they are prone to physical twisting during installation without a rigid external frame for support.
Metal Frame
The 6063-T5 grade aluminum alloy frame provides flexural rigidity for the module, with an anodic oxide film thickness reaching over 15 microns.
Frame height is typically between 30 mm and 35 mm, capable of withstanding a rear wind pressure load of 2400 Pa per square meter.
In salt spray tests, this anodized aluminum can resist corrosive environments of Level 10 and above, with a protective lifespan exceeding 30 years.
Mechanical Parameter | Specification Value | Structural Gain |
Tensile Strength | Greater than 160 MPa | Supports module weights over 30 kg |
Oxide Layer | 15 to 20 microns | Improves weather resistance by 20% |
Bolt Hole Diameter | 9 mm x 14 mm | Compatible with 98% of PV mounting systems |
The interior of the frame is usually filled with a specialized silicone sealant with an elongation at break exceeding 200%, absorbing thermal expansion and contraction caused by temperature differences.
It firmly locks the glass, film, and backsheet within the metal grooves, giving the module the ability to resist Category 12 typhoons.
Once the overall mechanical structure is stabilized, the final step is to install the hub device for current output to connect to the external grid.
Junction Box
An IP68-rated junction box is installed on the back of the module, featuring 3 built-in bypass diodes with a rated current of up to 30 A.
Its role is to automatically conduct current when a specific group of cells is shaded, preventing local hot spots from reaching temperatures of 150 degrees Celsius.
The box body is made of modified PPO material, capable of withstanding severe environmental fluctuations from -40°C to +85°C without cracking.
Electrical Parameter | Data Standard | Safety Redundancy |
Rated Current | 25 A to 30 A | More than 2x the cell current |
Cable Cross-section | 4 mm² | Voltage drop loss controlled within 1% |
Connection Life | 1000 Plugs/Unplugs | Maintains contact resistance below 0.5 mΩ |
The matching MC4 connectors offer high waterproof performance, allowing for continuous immersion at a depth of 1 meter for 30 minutes without leakage.
The 1.2-meter specialized PV cables use double-layer cross-linked polyethylene insulation, with ozone resistance that supports 25 years of outdoor exposure.
Through the collaboration of these precision modules, solar cells can generate electricity stably across various climates with an annual power degradation rate of less than 0.5%.
Efficiency
Where the Money is Spent
The cost structure of PV modules has undergone significant changes over the past five cycles, with raw material procurement accounting for approximately 75% to 82% of total expenditures.
As the most fundamental power generation carrier, the cost weight of the silicon wafer within the entire panel has dropped from around 55% in the early stages to between 32% and 38% currently.
Non-silicon materials such as aluminum frames, reinforced glass, and encapsulation films constitute the remaining 45% of the budget.
Fluctuations in the prices of these auxiliary materials directly affect the final selling price of the module.
· Silicon Wafer Cost: Approx. 35% of total expenditure
· Auxiliary Material Costs: Glass and frame combined account for approx. 25% to 30%
· Labor and Depreciation: Manufacturing and processing fees for automated lines account for approx. 15%
This cost allocation ratio is not fixed; it fluctuates significantly with the release of processing capacity for upstream silicon ore.
Polysilicon Evolution
Looking back at the market in 2022, the global unit price of polysilicon once soared to over $40 per kg, extending the investment payback period for terminal power stations by about two years.
However, by 2024, as capacity utilization increased by over 40%, the unit price of silicon material had fallen back to the $7 to $9 per kg range.
This nearly 80% drop has directly driven a plunge in the price per watt of modules. Currently, mainstream transaction prices in the international market have stabilized below $0.1 per watt.
· Price Peak: Approx. $45 per kg in 2022
· Current Level: Approx. $8 per kg in 2024
· Reduction Ratio: Upstream costs have shrunk by over 75%
Although raw material prices have bottomed out, reducing the usage of expensive metals during the manufacturing process remains the technical key to maintaining long-term competitiveness.
Secrets to Cost Reduction
The conductive silver paste used on the front of the cell to collect current is the most expensive non-silicon material in the module, with prices usually fluctuating between $800,000 and $1,000,000 per ton.
By introducing Multi-Busbar (MBB) technology with 16 to 18 lines, the silver paste consumption per cell has been reduced from 110 mg in 2020 to about 65 mg today.
This refined material management saves about 3% to 5% in manufacturing costs for a single module while indirectly improving photoelectric conversion performance by 0.2%.
· Silver Paste Reduction: Consumption per cell has dropped by about 40% over the last four years
· Cost Contribution: Saves approximately $0.005 per watt in material costs
· Technical Gain: Thinner busbars reduce the shaded area by 1.5%
This extreme compression of microscopic materials, combined with larger silicon wafer cutting processes, has allowed the annual capacity of individual factories to generally cross the 10 GW threshold.
Economies of Scale
Most current module production bases utilize the 210 mm large-size specification, which offers about 50% more light-receiving area per wafer compared to the traditional 156 mm specification.
The expansion of individual production capacity has led to a reduction of approximately 60% in equipment amortization costs per megawatt compared to 2019, greatly easing financial interest pressures for companies.
Mass production also brings bargaining advantages in procurement; bulk purchasing of over 1 million square meters of encapsulation film can yield price discounts of about 8%.
· Specification Upgrade: Full transition from 166 mm to 182 mm and 210 mm
· Fixed Amortization: Equipment depreciation now accounts for less than 10% of total costs
· Procurement Benefits: Long-term orders for bulk materials can save over 5% of the budget
Once the factory price of the panels themselves is reduced, the costs of mounting brackets, cables, and labor involved in installation become the key determinants of the total budget.
Other Costs
Beyond the panels themselves, Balance of System (BOS) expenditures typically account for 45% to 55% of the total investment in a PV power plant.
Among these, the cost of stainless steel or aluminum alloy mounting brackets is approximately $0.03 per watt, while inverters and AC combiner boxes account for another 12% of the budget.
In a typical 100 MW project sample from 2023, land rent and construction/installation fees together accounted for about 20% of the initial investment.
· Bracket Costs: Approx. 8% to 10% of the total system price
· Electrical Systems: Cables and inverters account for approx. 15%
· Installation Labor: Fluctuates between 10% and 20% depending on the region
While these initial investments may seem large, the Levelized Cost of Energy (LCOE) over a 25-year operating cycle is actually highly advantageous.
Payback Period
In most regions globally with sufficient sunshine, the LCOE of PV power has dropped to between $0.02 and $0.04 per kWh.
Compared to the generation cost of fossil fuels ($0.06 per kWh), PV systems can recover all initial investments within 5 to 7 years of operation.
According to data tracking of 500 commercial rooftop power stations, the total return over a 25-year lifespan is typically 3 to 5 times the initial investment amount.
· LCOE Index: The global average in 2024 is approximately $0.033 per kWh
· Payback Cycle: Approx. 6 years for residential systems; 4 to 5 years for industrial systems
· Investment Return: Annualized returns are generally between 12% and 18%
The foundation of this high return rate lies in the extremely low post-maintenance costs of the modules, with annual cleaning and inspection fees usually being less than 0.5% of the initial investment.
Future Savings
With the maturation of new technologies such as tandem cells, the conversion efficiency of modules is expected to surpass 30% by 2030, further thinning the cost per watt.
By then, because the electricity output per unit area will have increased by more than 20%, the required mounting brackets, cables, and land area for the same power capacity will decrease by about 15%.
This systemic cost-reduction trend will push PV energy into an era of $0.01 per kWh, fundamentally changing the global energy consumption landscape.
· Efficiency Target: Mass production goals for 2030 point toward 28% and above
· System Reduction: BOS costs are expected to drop another 10% to 15%
· Electricity Unit Price: LCOE is expected to fall toward the $0.015 level
Through continuous technological innovation and material substitution, solar energy has evolved from an expensive technological experiment into the most cost-effective method of electricity production currently available.
Durability
Sunlight Resistance
Modules need to withstand a cumulative total of over 300,000 Wh of ultraviolet (UV) radiation impact over a 25-year lifecycle.
To simulate this long-term exposure, laboratories typically conduct UV-intensified aging tests of 15 kWh/m².
These tests filter out high-quality encapsulation materials that are less prone to molecular chain breakage under light, ensuring annual power degradation remains below 0.45%.
· Aging Test Duration: Cumulative exposure reaches 15 kWh/sqm
· Power Degradation Index: First-year drop controlled between 1% and 1.5%
· Long-term Stability: Annual drop of less than 0.4% between years 2 and 25
After addressing polymer material degradation caused by sunlight, modules must also face the omnipresent penetration of water vapor.
Rain and Moisture Resistance
Water vapor transmission rate (WVTR) is a hard metric for measuring the reliability of backsheets and films. Qualified POE films have a WVTR of only 0.2 g/m² per day.
In the classic DH85 experiment, modules are placed in a chamber at 85 degrees Celsius and 85% relative humidity for 1,000 to 3,000 hours of continuous operation.
According to the latest 2024 industry reliability samples, top-tier brands still maintain power losses of less than 3% after 3000 hours of damp-heat testing.
· Environmental Metrics: 85°C high temperature with 85% high humidity
· Experimental Span: Extended from the standard 1,000 hours to 3000 hours
· Bonding Strength: Peel force must be maintained at a level above 4 N/cm
This moisture-blocking capability not only protects internal precision circuits but also lays the foundation for modules to handle extreme alternating hot and cold conditions.
Thermal Cycling Resistance
Photovoltaic panels outdoors experience drastic temperature swings from -30°C in the early morning to 75°C at noon.
Laboratories use TC200 or TC400 thermal cycling tests to check the fatigue strength of solder points, cycling between -40°C and +85°C for 200 to 400 repetitions.
Physical expansion and contraction test the bonding firmness between the 18 busbars and the cell surface; any failure here can result in a significant decrease in power output.
· Cycle Temperature Difference: A single cycle span of up to 125 degrees Celsius
· Test Frequency: High-standard modules generally require passing 400 cycle tests
· Resistance Change: The increase in series resistance after testing must be limited to 5%
While physical deformation from temperature differences is daunting, physical impacts from nature demand even higher strength from the glass and silicon wafers.
Mechanical Load Strength
In static load experiments simulating strong winds and accumulated snow, the front of the module must withstand a massive pressure of 5400 Pa per square meter.
This pressure is equivalent to stacking over one ton of objects on a standard 2-square-meter panel.
Experimental data shows that modules with high-rigidity 6063 aluminum alloy frames have a deformation displacement of no more than 15 mm under 2400 Pa rear wind pressure tests.
· Frontal Load: 5400 Pa (Simulating heavy snow environments)
· Rear Wind Pressure: 2400 Pa (Simulating wind impacts over Category 12)
· Impact Force: Withstands a 25 mm diameter hailstone hitting at a speed of 23 m/s
Since mechanical loads can cause invisible micro-cracks in cells, electrical hazard screening is also indispensable.
No Leakage Risk
Potential Induced Degradation (PID) is a common power loss phenomenon in modules under high-voltage environments, usually caused by leakage current.
Under conditions of 85°C and 85% humidity, applying a 1500 V reverse bias, qualified products should have a power loss of less than 2% after 96 hours.
This requires encapsulation materials to have extremely high insulation resistance; at 1000 V DC, the insulation resistance of the entire module must be greater than 40 MΩ.
· Test Voltage: 1000 V or 1500 V DC system voltage
· Experimental Duration: Continuous 96-hour to 192-hour limit tests
· Pass Threshold: Absolute value of power degradation must not exceed 5% of original power
Stable electrical performance ensures long-term safe operation for the power plant, which directly determines how long a manufacturer dares to offer warranty services.
Longevity
Current monocrystalline modules generally carry a 12-year workmanship and materials warranty, along with a 25- to 30-year linear power output guarantee.
After 25 years of operation, the equipment is still able to maintain approximately 84.8% of its initial rated power.
Tracking data from over 500 operating power stations worldwide reveals that, due to technological iterations, the failure rate for modules commissioned after 2020 has dropped below 0.05%.
· Power Guarantee: Output power after 25 years is not less than 84.8% of the initial value
· Failure Probability: Annual failure rate has dropped from 0.2% in early stages to 0.05%
· Decommissioning Cycle: Design service life is moving toward 30 years or even longer
This ultra-long service life gives PV systems extremely high investment value and makes them the most reliable choice for meeting long-term energy needs.