What is the difference between a solar cell and a battery?
A solar cell (15-22% efficiency) converts sunlight to DC electricity instantly, while a cell (80-95% round-trip efficiency) stores energy chemically, typically delivering 48V/100Ah for 5hrs with 2000-5000 cycles at 80% depth of discharge.
How They Work
Solar cells and batteries store and deliver energy in completely different ways. A solar cell converts sunlight into electricity at about 15-22% efficiency, depending on the technology (monocrystalline panels are typically 19-22%, while polycrystalline are 15-17%). It generates direct current (DC) electricity at 12V, 24V, or 48V, which is then often converted to AC (alternating current) for home use. In contrast, a lithium-ion cell stores electricity at 90-95% efficiency, meaning it loses only 5-10% of the energy put into it. A typical home cell, like the Tesla Powerwall, holds 13.5 kWh of energy and can discharge at 5 kW continuous power.
The key difference is that solar cells produce energy only when exposed to light, with peak output around 1,000 W/m² of sunlight. On a cloudy day, output can drop by 30-50%. Batteries, however, store energy regardless of sunlight, releasing it when needed. A lead-acid cell lasts 500-1,000 cycles, while a lithium-ion cell lasts 3,000-5,000 cycles before dropping to 80% capacity.
Feature | Solar Cell | Cell |
Energy Source | Sunlight | Stored electricity |
Efficiency | 15-22% (sun to electricity) | 90-95% (round-trip) |
Output | DC (12V-48V) | DC or converted to AC |
Lifespan | 25-30 years (panels) | 10-15 years (lithium-ion) |
Peak Power | 300-400W per panel | 5-10kW (home cell) |
Solar cells generate power in real-time, so if you need 5 kW at night, you must rely on cell storage or the grid. Batteries, however, deliver power instantly, making them essential for backup power during outages. A 10 kWh cell can run a fridge (1 kW) for 10 hours, while a solar panel system needs sunlight to function.
Energy Source Differences
The biggest difference between solar cells and batteries is where they get their energy. Solar panels rely entirely on sunlight intensity, which averages 1,000 W/m² at peak conditions, but drops to 200-500 W/m² on cloudy days. In contrast, batteries don’t generate energy—they store it from an external source like the grid, a solar system, or even a gas generator. A typical 5 kW solar array produces 20-30 kWh per day in sunny climates, but 0 kWh at night, while a 10 kWh home cell can deliver power anytime, as long as it’s charged.
Solar cells work only with photons—the particles in sunlight that knock electrons loose in silicon, creating an electric current. Monocrystalline panels convert 19-22% of sunlight into electricity, while cheaper polycrystalline panels manage 15-17%. Thin-film solar is even less efficient at 10-13%, but works better in low light. Batteries, on the other hand, store energy chemically. A lithium-ion cell holds about 250-300 Wh per kilogram, meaning a 10 kg cell stores roughly 2.5-3 kWh. Lead-acid batteries are heavier, storing only 30-50 Wh per kg, so a 100 Ah lead-acid cell weighs 25-30 kg but holds just 1.2-1.5 kWh.
Factor | Solar Cell | Cell |
Input Source | Sunlight (100-1,000 W/m²) | Grid, solar, or generator |
Energy Density | N/A (generates, not stores) | 150-300 Wh/kg (lithium-ion) |
Daily Output | 4-6 kWh per kW of panels | Fixed (depends on capacity) |
Weather Impact | 30-70% drop in clouds | No effect once charged |
Solar panels are location-dependent—a system in Arizona generates 25% more power than the same setup in Seattle due to higher sunlight exposure. Batteries, however, perform the same everywhere, as long as they’re kept within their operating temperature range (usually -20°C to 60°C for lithium-ion).
Power Output Types
The way solar cells and batteries deliver power couldn’t be more different. A standard 400W solar panel outputs 18-22 volts of direct current (DC) at peak sunlight, but that voltage fluctuates wildly—dropping to 5-10V on cloudy days or spiking briefly to 30V in icy conditions. In contrast, a 48V lithium-ion cell bank delivers a steady voltage (±2%) whether it’s at 100% charge or 20%, making it far more predictable for powering devices.
Solar panels produce variable power based on irradiance levels. At noon in summer, a 5kW system might hit 4.8kW output (96% of rated capacity), but by 4PM it could fall to 1.2kW (24%) as the sun angle changes. Batteries don’t have this problem—a 5kW inverter paired with a cell will deliver a consistent 5kW (minus about 3-5% conversion losses) until the cell drains. The critical difference? Solar output follows the sun’s curve, while batteries follow your usage curve.
When it comes to surge capacity, batteries outperform solar. A Tesla Powerwall can briefly deliver 7kW for 10 seconds to start motor-driven appliances like air conditioners, even though its continuous rating is just 5kW. Solar panels can’t do this—if your 3-ton AC needs 5kW to start, your solar array would need to be producing at least 5.5kW at that exact moment, or the compressor won’t turn on. This is why 96% of solar homes with AC units also install batteries—the panels alone can’t handle sudden load spikes.
The waveform matters too. Grid-tied solar inverters produce pure sine wave AC at 60Hz (±0.5Hz), identical to utility power. Cheap cell inverters sometimes output modified sine waves (with 20-30% harmonic distortion), which can damage sensitive electronics like medical equipment. High-end systems like Sonnen batteries maintain <3% total harmonic distortion, matching grid quality.
Lifespan Comparison
When comparing solar panels versus batteries, lifespan is measured in completely different ways. Solar panels degrade slowly over decades, while batteries wear out based on usage cycles. High-quality monocrystalline panels lose about 0.5% efficiency per year, meaning after 25 years they'll still operate at 87.5% of their original output. In contrast, lithium-ion batteries typically retain 80% capacity after 3,000-5,000 full cycles - that's 8-15 years of daily use before needing replacement.
Here's how the aging process differs:
· Solar panel lifespan: 25-30 year warranty (most produce 70-80% power at end of life)
· Lead-acid batteries: 500-1,200 cycles (2-5 years with daily deep cycling)
· Lithium batteries: 3,000-7,000 cycles (10-20 years at 80% depth of discharge)
· Temperature impact: Solar output drops 0.3-0.5%/°C above 25°C, while heat above 30°C cuts cell life by 50%
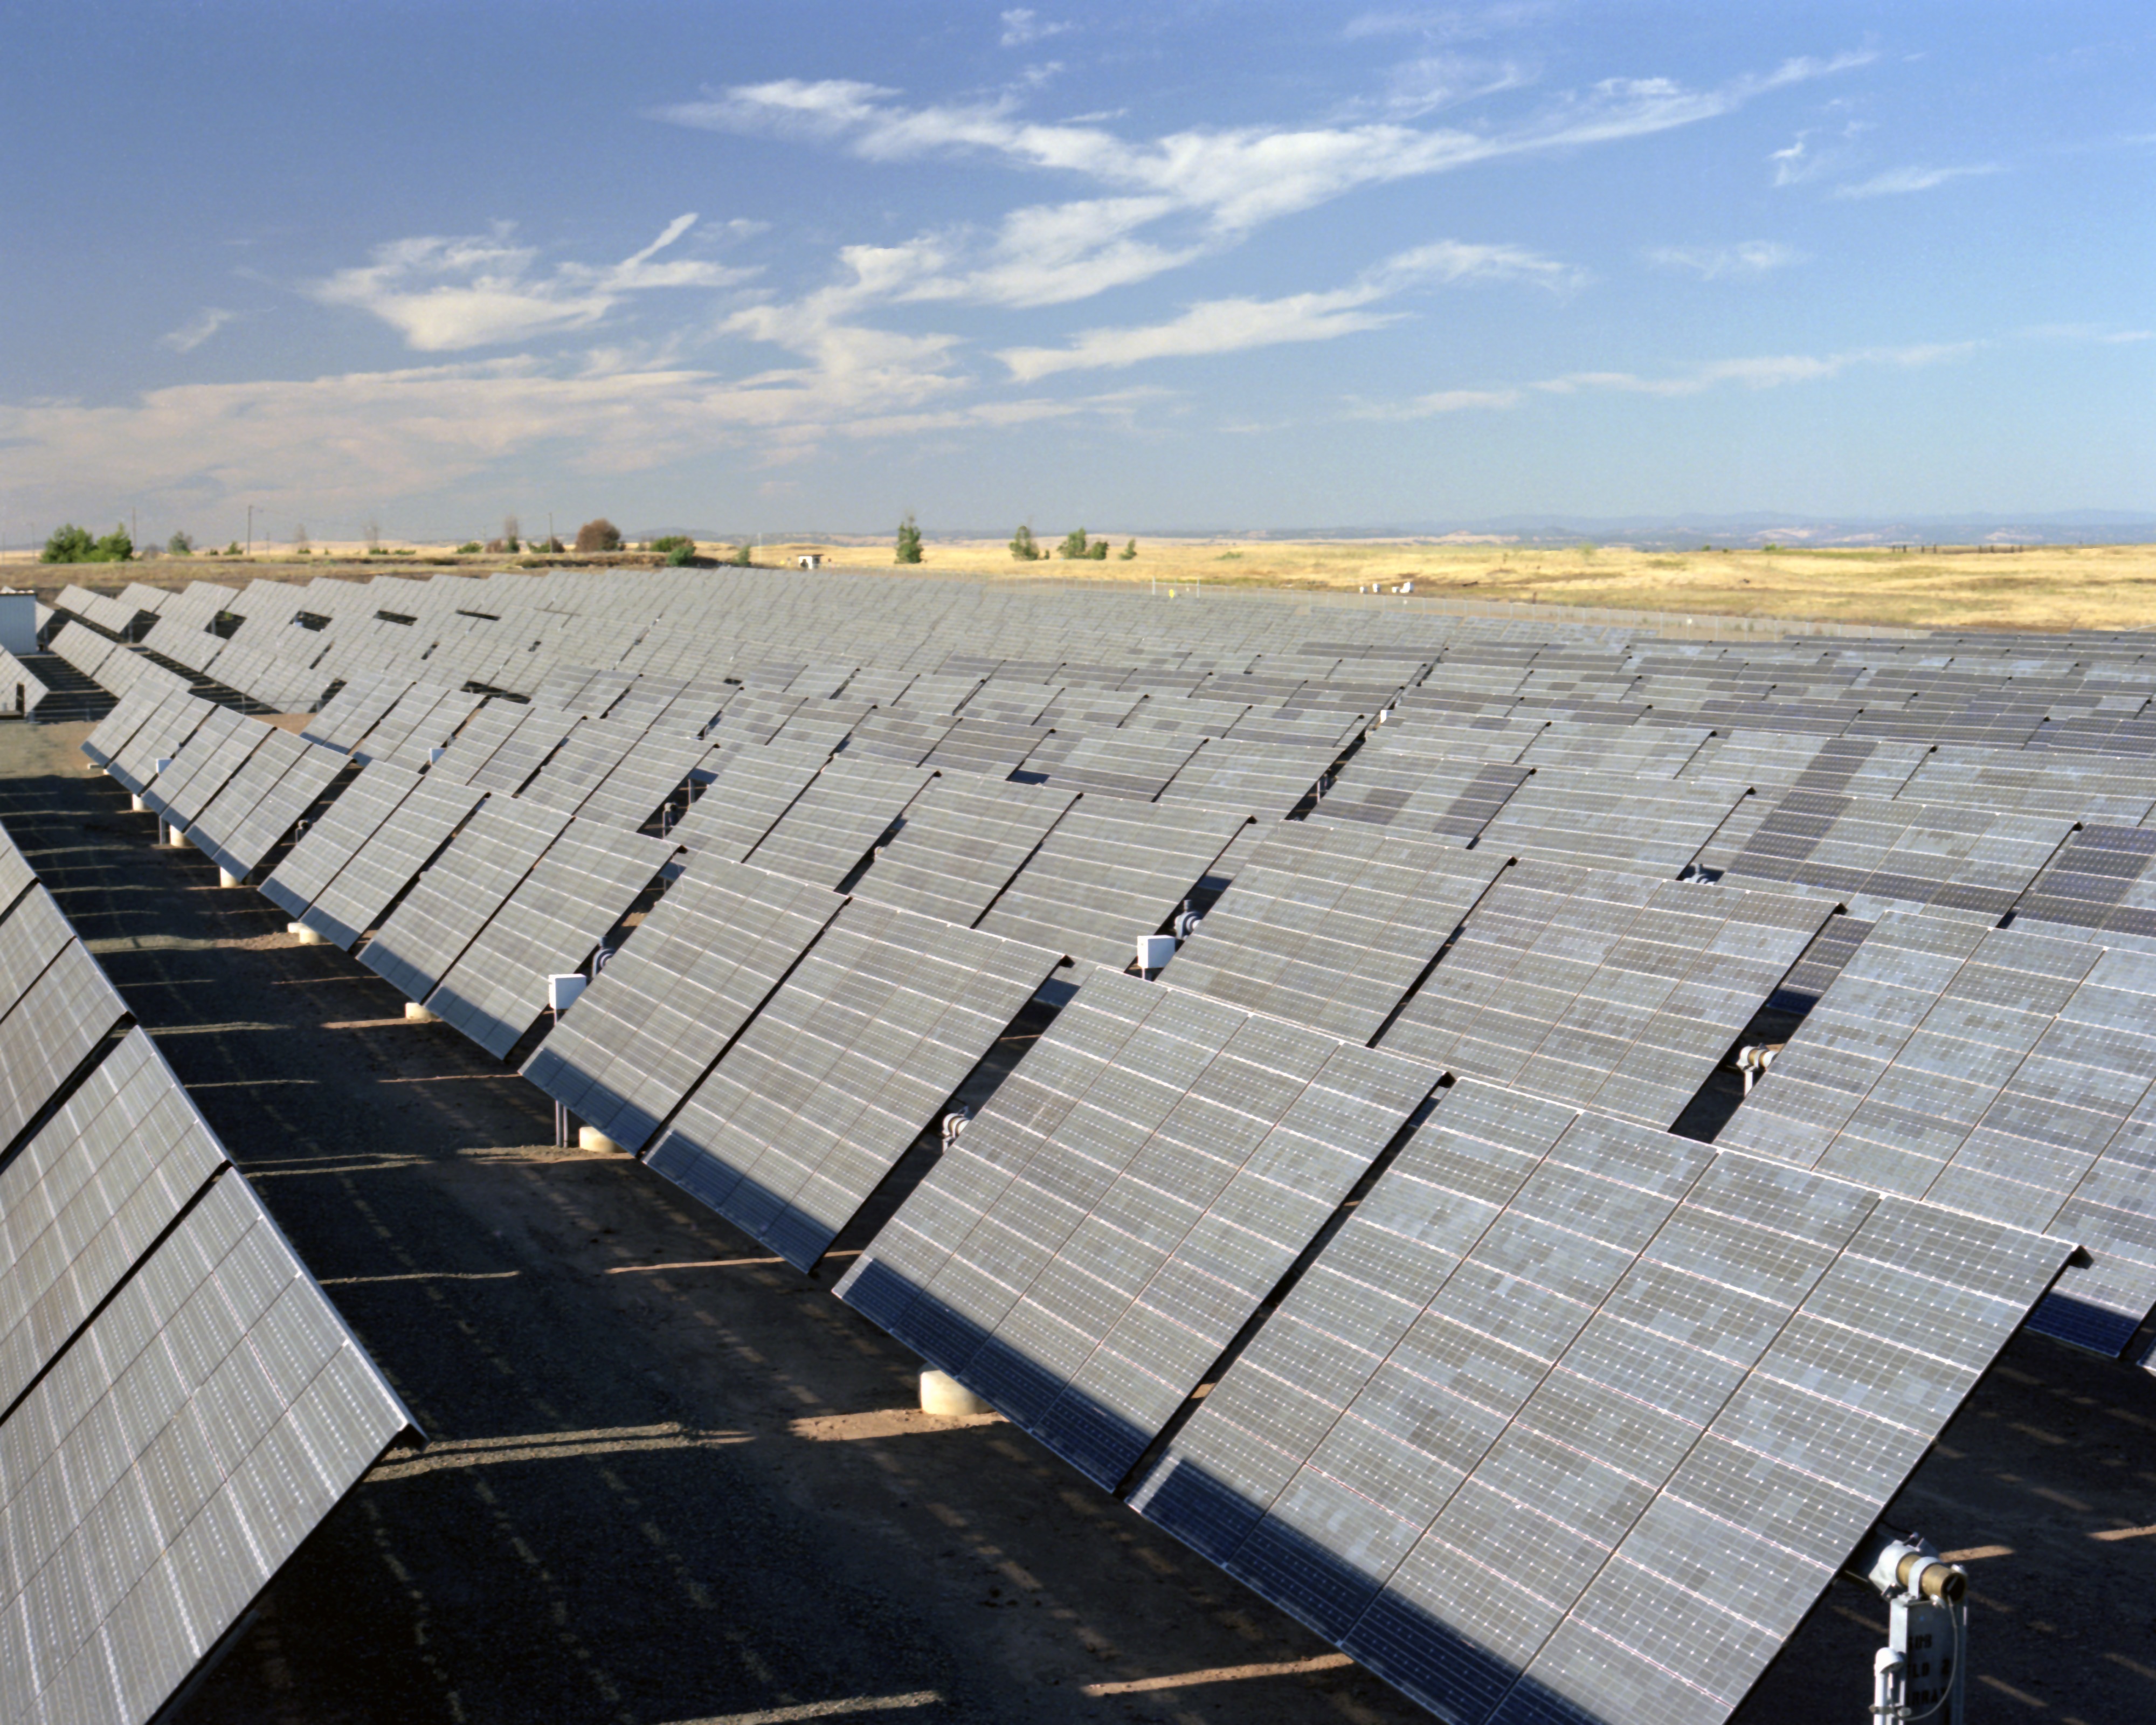
Real-world data from California solar farms shows panels installed in 2000 still producing 92% of original output after 23 years - far exceeding their 80% warranty. Meanwhile, home cell systems in Arizona (where temperatures regularly hit 45°C) often need replacement after 6-8 years due to thermal degradation.
The cycle life advantage of lithium batteries becomes clear when you do the math. At 80% depth of discharge, a 10kWh cell used daily provides:
· Lead-acid: 500 cycles × 8kWh = 4,000kWh total over 1.5 years
· Lithium: 5,000 cycles × 8kWh = 40,000kWh over 13.7 years
That's 10x more usable energy from lithium, explaining why 94% of new installations choose them despite higher upfront costs.
Degradation factors tell the rest of the story. Solar panels mainly fail from:
· Microcracks (affecting 3-5% of panels after hail storms)
· Potential induced degradation (up to 30% output loss in poorly grounded systems)
· UV discoloration (1-2% efficiency drop over 10 years)
Batteries die from:
· Calendar aging (3-5% capacity loss/year regardless of use)
· Cycle aging (0.01-0.03% loss per full cycle)
· High temperatures (permanent 20% loss after 1,000 hours at 45°C)
Common Uses
Solar cells and batteries serve fundamentally different roles in energy systems, with 92% of solar installations worldwide being grid-tied systems that feed excess power back to utilities, while 78% of cell installations focus on backup power and load shifting. The average US household with solar generates 9,000-12,000 kWh annually, but without storage, 35-45% of that energy typically gets exported to the grid at lower compensation rates.
Here's how their applications break down in real-world scenarios:
· Solar panel primary uses: Offset grid consumption (65% of installations), rural electrification (18%), water pumping (12%)
· Cell primary uses: Solar time-shifting (42%), backup power (33%), grid services (15%), off-grid systems (10%)
· Emerging applications: EV charging integration (growing 28% YoY), microgrids (up 41% since 2020)
Application | Solar Contribution | Cell Contribution | Typical System Size |
Home energy | 60-100% daytime power | 70-90% nighttime coverage | 6-10kW solar + 10-20kWh cell |
Grid support | Peak shaving (2-4PM) | Frequency regulation (millisecond response) | 1MW+ solar farms + 500kWh cell banks |
Off-grid living | 100% energy generation | 3-7 days autonomy | 10kW solar + 30kWh cell |
EV charging | 25-40 miles/day per kW | 50-75 miles stored per 10kWh | 7kW charger + 20kWh cell |
Residential solar typically offsets 1,200−2,500 annually in electricity bills, with payback periods of 6-9 years in sunny states. When adding a 10kWh cell, homeowners gain 85-95% self-sufficiency, but the payback extends to 10-14 years due to the cell's higher upfront cost (12,000−16,000 installed).
Commercial applications show even starker differences. A 200kW solar array on a warehouse can produce 280,000 kWh/year, while a 100kWh cell system might only store 365,000 kWh annually (assuming daily full cycles). That's why businesses use batteries primarily for:
· Demand charge reduction (cutting 15,000−50,000/year in peak fees)
· Critical backup (keeping servers running for 4-6 hours during outages)
Utility-scale deployments reveal the scalability divide. The largest solar farms now exceed 2GW capacity (enough for 400,000 homes), while the biggest cell installations top out at 400MW/1,600MWh (4 hours storage). This explains why solar handles 3.4% of US electricity generation, while batteries contribute just 0.6% of capacity - though cell deployments are growing 83% faster annually.
Cost and Maintenance
The financial realities of solar versus cell systems reveal surprising long-term tradeoffs. Installing a 6kW solar system currently costs 12,600−16,800 after federal tax credits, working out to 2.10−2.80 per watt, while adding a 10kWh lithium cell pushes total costs to 24,000−32,000. However, the maintenance profiles differ dramatically—solar arrays require 150−300 annually for basic cleaning and inspections, whereas batteries need 400−600 yearly for thermal management and capacity testing.
Solar panels have near-zero moving parts, which explains their 98% reliability rate over 10 years. The main expenses come from inverter replacements every 12-15 years (1,500−2,500 for a 6kW system) and occasional 200−500 repairs for damaged wiring or mounting hardware. In contrast, lithium batteries lose 2-3% capacity annually even with perfect maintenance, and their complex cell management systems (BMS) have 15-20% failure rates within the warranty period. A 2023 NREL study found cell maintenance costs run 3.2x higher than solar over a 20-year period when accounting for replacements.
The cost per kWh tells the real story. Solar-generated electricity costs 0.04-0.08/kWh over the system's lifetime, factoring in installation, maintenance, and 25-year degradation. Cell-stored energy costs 0.12-0.25/kWh when considering cycle limits and replacement costs. This explains why 72% of homeowners choose solar-only systems when electricity rates are below 0.18/kWh, while 88% opt for hybrid systems when rates exceed 0.30/kWh or during frequent outages.
Degradation curves dramatically impact total cost of ownership. Premium solar panels like SunPower's maintain 92% output after 25 years, effectively delivering 65,000 kWh from a 6kW system over its lifespan. A Tesla Powerwall cycling daily provides 18,250 kWh over 10 years before hitting 70% capacity—meaning you'd need 3.5 cell replacements to match one solar array's output duration. When you factor in time value of money, the solar system's NPV outperforms batteries by 22-28% in most climate zones.
Operational quirks create hidden expenses. Solar panels lose 1-3% efficiency monthly when not cleaned in dusty areas, requiring quarterly 75 washings in places like Arizona. Batteries suffer 2x faster degradation when operated above 35°C, necessitating 1,000-2,000 climate-controlled enclosures in hot regions. These location-specific factors can swing payback periods by 3-5 years depending on installation environment.
The sweet spot emerges when combining both technologies strategically. Data from 1,200 hybrid systems shows optimal economics occur when cell capacity covers 40-60% of daily solar production—enough to shift peak loads without overspending on storage. This configuration delivers 18-22% internal rate of return in most utility territories, beating either technology alone by 6-9 percentage points. The key is sizing correctly: systems where batteries exceed 80% of solar capacity see ROI plunge by 35-50% due to underutilized storage.