When bifacial output drops after a backtracking change, start with four signals: tracker angle, front irradiance, rear irradiance, and DC power.
Put them on the same timeline. If the tracker angle changes first and power falls right after, the problem is usually tied to one of a few things: the tracker is flattening too much, some row shade is still there, less useful reflected light is reaching the rear, structural shadows have moved, or rear-side light has become less even. Conventional backtracking is mainly used to reduce row-to-row shading.
It does not automatically choose the angle that gives the highest bifacial output.[1]
| What Changes | Check First |
|---|---|
| Front irradiance and DC power fall | Tracker is flattening too much, GCR is wrong, or timing is wrong |
| Rear irradiance and DC power fall | Ground shadows, rear view, torque-tube shade |
| Rear average stays similar but DC falls | Uneven rear light and electrical mismatch |
| DC stays normal but AC falls | Curtailment, inverter availability, grid or AC-side issue |
Confirm Exactly What Changed
Before looking at energy data, pin down what was actually changed in the controller. Do not stop at “backtracking was updated.” Record:
- old and new GCR;
- old and new backtracking algorithm;
- firmware version;
- tracker zero offset;
- maximum rotation or backtracking correction;
- terrain compensation;
- diffuse-light mode;
- latitude, longitude, time zone, and controller time;
- backtracking start and end conditions.
If GCR was the only setting changed, the quickest checks are tracker angle and row shade. A firmware update needs a wider review because it may also affect terrain logic, diffuse tracking, weather protection, or position feedback. IEA PVPS identifies complex-terrain backtracking, diffuse-light strategies, weather response, and module-specific tracking as separate control functions used in modern tracker systems.[2]
Recalculate GCR From the As-Built Site
The GCR in the design file is not always the GCR on the ground. Measure the actual collector width and row pitch, then calculate it again.
GCR = collector width ÷ row pitch
For a 4 m collector:
| Row Pitch | Calculated GCR |
|---|---|
| 7.0 m | 0.57 |
| 7.5 m | 0.53 |
| 8.0 m | 0.50 |
| 8.5 m | 0.47 |
| 10.0 m | 0.40 |
A block built at 7.0 m pitch has a GCR of about 0.57. The same tracker at 8.5 m pitch is about 0.47. If both blocks use one controller value, the tracker software is treating two different shading geometries as though they were the same. Because conventional backtracking uses GCR as a key input, the wrong value can make the tracker flatten too early, too late, too much, or too little.[3]
Pay particular attention to areas near roads, drainage channels, irregular site boundaries, shortened tracker rows, and blocks where construction differs from the original drawings. These are common places for local row pitch to differ from the project average.
Measure Whether Backtracking Is Too Aggressive
Backtracking only makes sense if the shade it removes is worth more than the sunlight lost by moving away from the better sun-facing angle.
Illustrative example:
| True-Tracking Position | Backtracked Position | |
|---|---|---|
| Tracker angle | 55° | 35° |
| Front irradiance before row shade | 720 W/m² | 690 W/m² |
| Illustrative row-shading loss | 6% | 1% |
| After simplified shade adjustment | 676.8 W/m² | 683.1 W/m² |
Here, moving from 55° to 35° lowers the unshaded front irradiance by 30 W/m². But the assumed row-shading loss also drops from 6% to 1%, so the backtracked position still finishes about 6.3 W/m² ahead.
The field decision is straightforward. If the new setting makes the tracker much flatter, front irradiance drops, and the old position already had little or no row shade, the correction is probably too aggressive. If shade is still touching the module edge, the correction may be too weak.
Check the Ground Area That Actually Feeds the Rear
Albedo alone is not enough. The ground has to be both lit by the sun and visible from the rear of the module.
For a simple example, assume 500 W/m² reaches an unshaded ground surface:
| Albedo | Light Reflected by the Ground |
|---|---|
| 0.20 | 100 W/m² |
| 0.60 | 300 W/m² |
The module rear does not receive all 100 or 300 W/m². Much of that reflected light travels elsewhere. Tracker height, tracker angle, row spacing, shadows, and rear visibility decide how much of it actually reaches the cells.
After a backtracking change, inspect the site at the same solar position and record:
- width of the ground-shadow band;
- location of bright ground relative to the module rear;
- whether previously illuminated ground is now shaded;
- whether the neighboring row is still touching the front of the module with shade.
Sandia's rear-irradiance models handle ground reflection together with ground shadows, sky diffuse light, direct rear light, and array geometry. Albedo is only one part of the calculation.[4]
Tongwei's utility-scale N-type bifacial performance analysis also treats measured ground conditions and bifacial gain as separate items rather than assuming that one albedo number determines rear output.
Check Rear-Side Uniformity, Not Only the Average
A rear sensor can report almost the same average even when the light pattern across the module has become much worse.
Illustrative example:
| Rear Area | Before Change | After Change |
|---|---|---|
| Upper area | 130 W/m² | 150 W/m² |
| Middle area | 115 W/m² | 65 W/m² |
| Lower area | 120 W/m² | 150 W/m² |
Both columns average about 121.7 W/m². If you only look at the average, nothing appears to have changed. In the second case, however, the middle section receives 85 W/m² less light than the two outer areas.
That difference matters electrically. Sandia measured rear irradiance differences of up to about 50 W/m² across a 1 m × 2 m module-sized area under the reported sunny test conditions and found that rear-side nonuniformity can create electrical mismatch and reduce string fill factor.[5]
If rear irradiance looks normal but DC power falls after the tracker change, compare several rear positions or look at string current. One rear sensor is not enough to rule out a nonuniformity problem.
Check Where Torque-Tube Shadows Move
Take rear-side photos at the old and new tracker angles. Mark the shadows from:
- torque tubes;
- purlins;
- bearings;
- motors and dampers;
- junction boxes;
- cables and cable trays.
NREL researchers found rear-irradiance shading factors of about 2% to 8% in the studied 2-UP tracker configurations without a gap between modules, depending on torque-tube geometry. The associated DC power loss averaged about 1% across the configurations studied.[6]
Those percentages are not a fixed loss factor for every project. Their practical value is that they show structural shade can be large enough to matter, and a new tracker angle can move that shade to a different part of the rear surface.
Use the Actual Module Circuit
A 5 cm shadow does not have one fixed power-loss percentage. Where that shadow lands on the module circuit matters just as much as its size.
Check:
- full-cell or half-cell layout;
- bypass-diode sections;
- portrait or landscape mounting;
- direction of the shadow;
- which cell strings receive the weakest rear light.
Rear irradiance also cannot be treated as the same amount of front irradiance. Bifacial devices have a measured rear/front electrical response. IEC TS 60904-1-2 defines how bifacial I-V characteristics and rear-side response are measured.[7]
Using the same simple example:
- front irradiance = 800 W/m²;
- rear irradiance = 100 W/m²;
- assumed rear/front electrical response = 80%.
At a first-pass level, 100 W/m² on the rear behaves more like an 80 W/m² front-equivalent contribution before temperature, spectrum, shading, and mismatch are taken into account.
For project work, use the data for the actual installed product. Tongwei's TNC-G12 bifacial cell data lists front and rear electrical performance separately, while the module range includes different module configurations that should not be treated as electrically identical.
Split Sloped Blocks From Flat Blocks
Plant-wide averages can hide a terrain problem. Break the data out by block before deciding whether the new setting works.
Illustrative example:
| Block Type | Normalized Energy Change |
|---|---|
| Flat block | +1.5% |
| Mild slope | 0.0% |
| Steeper cross-slope | -4.0% |
In this example, a plant-level average could easily hide the fact that the loss is concentrated in the steeper rows.
Sandia research on rolling terrain shows that row shading and the required backtracking angle change with cross-axis slope, tracker rotation, and local tracker geometry.[8]
Compare affected rows by:
- cross-axis slope;
- tracker-axis elevation;
- local row pitch;
- actual tracker angle;
- inverter or tracker block.
This is relevant across real utility-scale PV layouts, where terrain, spacing, capacity, and row arrangement can vary from one project to another and even between blocks at the same site.
Check Which Controller Mode Was Active
If the measured angle does not match the backtracking curve you expected, check the controller event log before changing GCR again.
Look for:
- wind stow;
- hail position;
- snow mode;
- diffuse-light mode;
- maintenance position;
- mechanical rotation limit;
- emergency command.
IEA PVPS reports that current tracker systems may use separate control responses for wind, hail, snow, flooding, diffuse conditions, and specialized backtracking.[9]
If the loss appears only on cloudy days after a firmware update, compare the old and new diffuse-light control first. The basic backtracking calculation may not be the problem.
Reject Bad Sensor Comparisons
Before touching tracker settings again, rule out three common measurement problems.
| Check | What Can Go Wrong |
|---|---|
| Sensor location | One sensor sits near a torque tube, row edge, bright ground, or local shade |
| Calibration | Sensor is dirty, misaligned, damaged, or drifting |
| Timestamp | Tracker angle and irradiance data are not recorded at the same real time |
A five-minute timestamp difference is enough to create a bad comparison when the sun is low. Tracker angle and row shadows can move noticeably in that time, so two records with the same displayed timestamp may describe different physical conditions.
IEC 61724-1 includes specific monitoring provisions for bifacial PV systems and irradiance measurement.[10]
Row position matters too. Do not use a row-end sensor as the only reference for interior rows. Sandia/NREL work has shown that rear irradiance near row ends can differ from the middle of the row.[11]
Separate DC Loss From AC Limits
For tracker-related problems, DC data usually tells the story earlier than the AC meter does.
Illustrative clipping example:
| DC Power | AC Limit | AC Output | |
|---|---|---|---|
| Old strategy | 100 MW | 95 MW | 95 MW |
| New strategy | 102 MW | 95 MW | 95 MW |
The new strategy adds 2 MW of DC in this example, but the AC meter still shows 95 MW because both cases are already at the assumed AC limit.
If DC is normal but AC falls, move the investigation to curtailment, inverter availability, grid limits, or AC faults. If DC and AC both fall during the same backtracking window, keep looking at tracker angle and irradiance.
Prove the Cause With One Timeline
Put all of the relevant signals on one chart:
- old backtracking angle;
- new backtracking angle;
- commanded angle;
- measured tracker angle;
- front irradiance;
- rear irradiance;
- normalized DC power;
- AC power.
| Order of Events | Most Useful Next Check |
|---|---|
| Angle changes → front irradiance falls → DC falls | Too much backtracking, wrong GCR, wrong timing |
| Angle changes → rear irradiance falls → DC falls | Ground shadow, rear view, structural shade |
| Rear average stays similar → DC falls | Rear nonuniformity and mismatch |
| DC falls before tracker angle changes | Do not blame backtracking first |
| DC normal → AC falls | Inverter, curtailment, grid, AC system |
Keep the angle chain separate as well:
calculated target angle → commanded angle → controller feedback → physical tracker angle
A bad calculated target points back to the algorithm or its inputs. If the target and command are correct but the physical tracker is 3° away, the next checks are inclinometer calibration, actuator error, mechanical backlash, torque-tube twist, and position feedback.
Run a Fair Before-and-After Test
A good comparison needs similar operating conditions, not just the same clock time.
- similar sun height and direction;
- similar direct and diffuse irradiance;
- similar temperature;
- similar soiling condition;
- same inverter availability;
- no unmatched curtailment;
- same or comparable tracker geometry.
For example, 8:00 a.m. in April and 8:00 a.m. in July do not put the sun in the same position, so they are not automatically a fair tracker comparison.
Where site controls allow it, two similar tracker groups running the two approved settings at the same time provide a cleaner test than comparing different weeks. IEA PVPS recommends side-by-side testing at the same site when validating claimed energy gains from tracker algorithms.[12]
Small gains also need a higher standard of proof:
- old normalized energy: 100.0 MWh;
- new normalized energy: 100.4 MWh;
- apparent improvement: 0.4%.
A 0.4% difference may be real, but it is not enough by itself to prove that the new algorithm is better. Weather, sensor accuracy, curtailment, and data quality can all move the result.
If the Model Says Gain but the Plant Shows Loss
| Model Assumption | Field Check |
|---|---|
| Uniform row pitch | Measure local as-built spacing |
| One albedo value | Check soil, vegetation, moisture, and seasonal change |
| Perfect tracker angle | Measure physical angle independently |
| Simplified structural shading | Inspect torque-tube, cable, and motor shadows |
| Uniform rear irradiance | Check several rear positions and string currents |
A DOE-supported comparison of rear-irradiance models found that the tested methods underestimated rear-side nonuniformity and overestimated total rear irradiance in the studied tracker system. Even so, modeled energy yield remained within about ±2% of measured values because rear gain is only one part of total system output.[13]
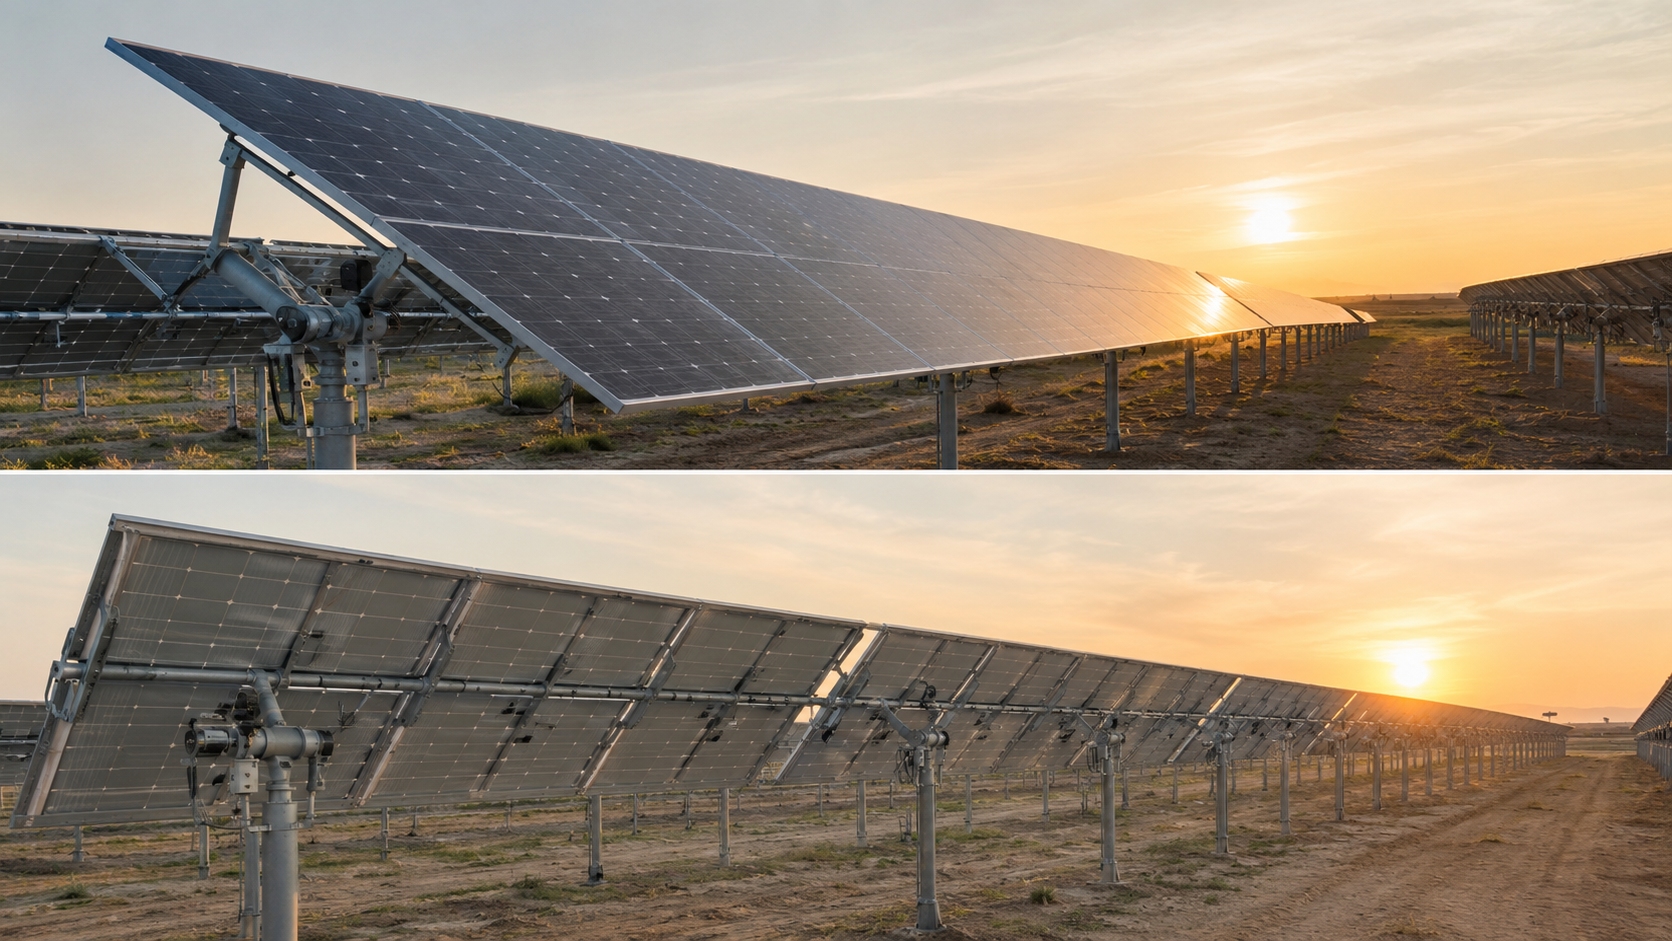
If the measured irradiance still does not match the electrical response after controller and sensor checks, the next step may be module characterization or failure analysis. Tongwei's PV testing and characterization facilities cover the types of cell, module, reliability, and failure-analysis work used to separate device-level problems from system-level operating problems.
Use This Troubleshooting Order
- Record the exact controller or firmware change.
- Identify whether rear irradiance, DC power, AC energy, or only bifacial gain fell.
- Recalculate GCR from actual collector width and local row pitch.
- Find the exact time and sun position where output starts to separate.
- Compare calculated, commanded, feedback, and physical tracker angles.
- Check front irradiance, rear irradiance, and DC power on the same timeline.
- Inspect row shadows, ground shadows, and rear hardware shade.
- Split flat and sloped tracker blocks.
- Check the active weather or diffuse control mode.
- Verify rear-sensor position, calibration, and timestamp.
- Remove curtailment, inverter outages, and AC limitations from the comparison.
- Repeat the comparison under matched solar and operating conditions.
Finally
Backtracking should be judged by measured energy, not by tracker angle or rear irradiance alone. A 4 m collector changes from GCR 0.40 at 10 m pitch to about 0.57 at 7 m pitch, so two blocks using the same control setting can behave very differently.
Rear-side variation matters too: Sandia measured differences of up to about 50 W/m² across a module-sized area, while NREL reported 2%–8% rear shading factors from torque-tube geometry in specific tracker configurations. Match tracker angle, front and rear irradiance, and DC power at the same sun position. If the data shows less row shade but a larger front or rear loss, the new setting is not delivering a useful trade-off.