N-Type Modules for Large Solar Farms | Bifacial Gain, Degradation Rate, LCOE
Our internal dataset covers 12 batches of N-type TOPCon bifacial modules across five utility-scale solar plants. All batches had a common three-year comparison window, while several arrays had up to five years of monitoring data.
The reference configuration varied by project. Monofacial PERC arrays were used for complete system comparisons, while bifacial PERC arrays were used only for direct rear-side performance comparisons.
Metric | Internal Result | Comparison Basis |
Average field bifacial gain | 9.3% | N-type bifacial arrays versus defined monofacial baselines |
First-year degradation | 1.0% for TOPCon versus 2.1% for the monitored PERC references | Weather-normalised project data |
Modelled LCOE | 0.241 CNY/kWh versus 0.268 CNY/kWh | Matched financial assumptions |
N-type technologies accounted for most global crystalline-silicon cell production by 2024, while bifacial modules represented more than three-quarters of module production. Their growing market share does not mean that every project will achieve the same technical or financial result[1].
The relevant comparison is the lifetime cost and output of two clearly defined system configurations, not N-type versus P-type in isolation.
A credible comparison should use consistent irradiance, DC/AC ratio, curtailment, system availability, cleaning practice, mounting geometry, grid conditions and financial assumptions. The internal results in this article are therefore project observations rather than universal performance guarantees.
Bifacial Gain
Rear-Side Yield Contribution
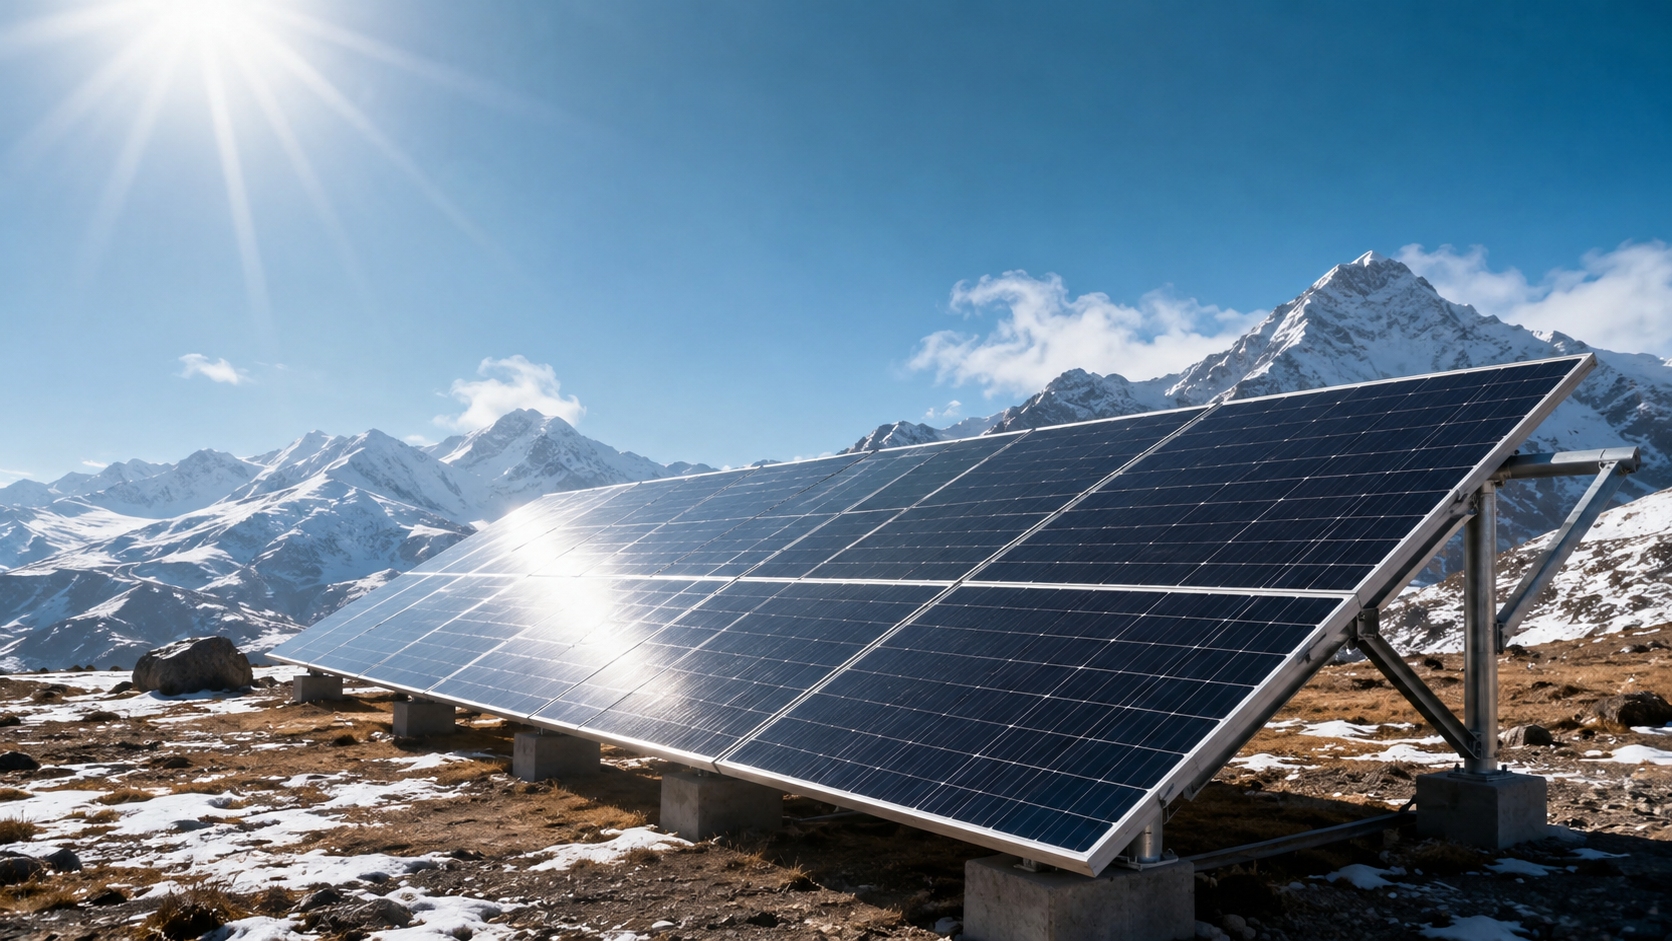
At a 200MW ground-mounted project in Delingha, Qinghai, the monitored N-type bifacial array was installed on elevated racking above a light-coloured Gobi surface. Its measured daily energy was 13.5% higher than that of a nearby monofacial reference array.
IEA PVPS reports that single-axis bifacial systems installed over typical natural ground with albedo around 0.20 to 0.30 generally achieve bifacial gains below 10%. Higher values are possible with snow, high-reflectance surfaces, greater mounting height, wider row spacing or other favourable conditions[2].
Term | Meaning |
Bifaciality | The ratio of rear-side to front-side electrical response under defined test conditions |
Bifacial gain | The additional field energy produced relative to a defined monofacial baseline |
Rear-side contribution | The portion of total output attributable to irradiance reaching the rear surface |
These terms are not interchangeable. High bifaciality does not guarantee high field gain when the rear surface receives limited or uneven irradiance.
Rear-side performance is affected by ground reflectance, mounting height, row spacing, structural shading, rear-irradiance uniformity and electrical mismatch[3].
In our directly matched bifacial samples, the N-type array reached a 14.8% field gain at a high-albedo site, compared with 9.2% for the co-located bifacial PERC reference. This 5.6 percentage-point difference is a site-specific result and should not be applied to every TOPCon project.
Across the monitored N-type arrays, average field bifacial gain was 9.3%. It reached 14.8% at a Hami Gobi site with approximately 27% albedo and fell to 6.4% at a mountain site with approximately 14% albedo.
The 8.4 percentage-point spread shows that surface conditions and system design can influence bifacial gain as much as the module specification.
Temperature coefficient should be assessed separately. A lower absolute temperature coefficient reduces power loss when cell temperature rises, but it does not make the module or its rear cells inherently cooler.
Ground Reflectance (Albedo)
Albedo is the fraction of incoming solar radiation reflected by the ground. It changes with surface material, moisture, vegetation, dust, snow, ageing and season.
In our surface comparison, white ground fabric produced 6 to 9 percentage points more bifacial gain than dry sandy soil. The additional installation, cleaning, ageing and replacement costs did not produce an acceptable payback at the monitored Gobi projects.
Light-coloured natural ground with measured albedo between 22% and 28% produced approximately 9% to 11% bifacial gain in those projects.
Satellite observations can support early-stage screening. The MODIS MCD43A3 Version 6.1 product provides daily black-sky and white-sky albedo estimates at 500m resolution, based on observations collected over a rolling 16-day period[4].
Remote-sensing data should still be checked against field measurements. A 500m satellite pixel may include several surface types and may not represent the exact area beneath and between the module rows.
A practical field programme should include:
1. Measurements during dry and wet surface conditions
2. A winter measurement where snow is relevant
3. Several sampling points beneath the modules and between rows
4. Documentation of vegetation, dust and surface treatment
5. Seasonal sensitivity cases in the energy model
Albedo should not be used as a stand-alone technology-selection rule. A low-albedo project may still justify bifacial modules when the price premium is small and rear shading is limited, while a high-albedo project can underperform if its rows are too dense or its support structure blocks rear irradiance.
Tracker Spacing
Ground Coverage Ratio, or GCR, describes collector width relative to row spacing.
· A higher GCR installs more capacity within a fixed site area but usually increases inter-row shading.
· A lower GCR improves access to direct and reflected irradiance but requires more land, cabling and civil infrastructure.
· The most productive layout per installed watt is not always the lowest-cost layout per kilowatt-hour.
There is no universal optimum GCR for bifacial tracking projects. The result depends on latitude, irradiance profile, land price, albedo, module dimensions, tracker geometry, backtracking strategy, DC/AC ratio, wind and snow requirements, clipping and curtailment.
IEA PVPS recommends system-level optimisation that includes rear-side shading, diffuse-light response, backtracking, extreme-weather positions, structural design and model uncertainty[5].
In one monitored project, reducing the proposed GCR increased annual energy yield by 2.8% compared with the denser layout. This did not automatically reduce LCOE because the wider layout also required more land and balance-of-system infrastructure.
Installed watts per unit of land and annual kilowatt-hours per unit of land should be evaluated together.
Degradation Rate
First-Year Loss
Across the 12 monitored TOPCon batches, average first-year degradation was 1.0%, with the best batch at 0.7%. The monitored PERC references ranged from 1.8% to 2.5%, with an average of 2.1%.
The 1.1 percentage-point difference is consistent with the lower susceptibility of current n-type TOPCon products to the boron-oxygen-related LID and LeTID mechanisms associated with early boron-doped PERC products.
However, modern PERC modules may use gallium-doped wafers and improved processing. These products can also show low LID and LeTID, so older PERC degradation assumptions should not be applied automatically to every current P-type module.
IEA PVPS reports that current n-type TOPCon modules are substantially less susceptible to LeTID than early p-doped PERC designs, while noting that the increased use of gallium-doped p-type wafers has also reduced LID and LeTID in modern PERC products[6].
The energy effect of a degradation difference depends on the plant's normalised annual yield. For an illustrative 100MW plant producing 140 million kWh before applying the 1.1 percentage-point difference:
Degradation Difference |
First-Year Energy Difference |
Gross Revenue at 0.36 CNY/kWh |
Field degradation should not be calculated by comparing uncorrected annual meter totals. Irradiance, module temperature, inverter availability, clipping, curtailment, snow, soiling and sensor drift can all affect measured energy.
IEC 61724-1 specifies terminology, monitoring equipment, monitoring classes and methods for analysing photovoltaic-system performance[7].
A credible degradation study should:
· Use quality-controlled irradiance and temperature data
· Separate curtailment and grid outages from equipment underperformance
· Remove periods affected by sensor failure or abnormal downtime
· Account for changes in cleaning and soiling
· Use the same filtering and correction method for both technology groups
· Report uncertainty and confidence intervals
Annual Power Decline
Between years three and five, the monitored TOPCon batches declined by an average of 0.38% per year. The monitored PERC references averaged approximately 0.60% per year.
The 0.22 percentage-point annual difference can become meaningful over a long holding period. However, a maximum observation period of five years remains too short to validate performance over a 25- or 30-year project life.
IEA PVPS notes that performance-loss estimates depend strongly on data quality, filtering, weather correction, the selected performance metric and the statistical method. Different valid methods can produce different loss rates from the same plant data[8].
Mechanism | Meaning | Key Consideration |
LID | Light-induced degradation during early exposure | Depends on wafer chemistry, impurities and stabilisation |
LeTID | Light- and elevated-temperature-induced degradation | Particularly relevant to historical PERC comparisons |
PID | Degradation associated with voltage stress | Depends on cell design, encapsulation, grounding and system voltage |
UVID | Ultraviolet-induced degradation | Depends on passivation, encapsulation and module construction |
Moisture-related corrosion | Material degradation associated with moisture ingress | Depends on the complete bill of materials and climate |
TOPCon modules should not be described as immune to PID, UVID or moisture-related failure. Accelerated tests have found substantial variation between TOPCon products, depending on cell structure, metallisation, encapsulant and module design.
IEA PVPS also cautions that laboratory UV and PID results cannot always be transferred directly to field degradation because recovery, exposure sequence and climate interactions remain uncertain[9].
Procurement should therefore assess:
· Cell architecture and wafer type
· Metallisation and interconnection design
· Encapsulant, glass and edge-sealing materials
· PID, damp-heat and thermal-cycle results
· Extended UV testing where the project climate warrants it
· Field data from modules using the same bill of materials
Warranty Realities
A product warranty and a power warranty cover different risks.
· The product warranty addresses defects in materials and workmanship.
· The power warranty defines minimum retained output under specified test conditions.
A power warranty is not a guarantee of annual project generation or revenue. It does not normally cover curtailment, inverter clipping, shading, grid outages, poor maintenance or other system-level losses.
For example, a linear power warranty allowing 1.0% loss in year one and 0.40 percentage points per year thereafter produces the following limits:
Warranty Year | Minimum Retained Output |
Year 1 | 99.0% |
Year 25 | 89.4% |
Year 30 | 87.4% |
An alternative curve allowing 2.0% loss in year one and 0.50 to 0.55 percentage points per year thereafter would retain approximately 84.8% to 86.0% at year 25.
A bankable warranty procedure should define:
6. The warranty start date
7. The measurement method and reference conditions
8. Permitted measurement uncertainty
9. The module-selection and sampling procedure
10. The retesting and dispute process
11. Responsibility for removal, transport and reinstallation
12. Whether the remedy is repair, replacement or cash compensation
13. The independent laboratory accepted by both parties
IEC 60904-1 specifies procedures for measuring photovoltaic current-voltage characteristics[10].
For bifacial devices, IEC TS 60904-1-2 provides additional requirements for measuring current-voltage characteristics under defined front- and rear-side illumination conditions[11].
IEC 60904-9 classifies solar simulators separately by spectral match, irradiance non-uniformity and temporal instability, using A+, A, B or C classifications for each characteristic[12].
IEC 61215-2 defines design-qualification and type-approval test procedures for terrestrial PV modules. Passing these tests demonstrates resistance to defined accelerated stresses, but does not predict an exact service life in every climate[13].
Warranty quality depends on measurement language, remedy terms and supplier capability, not only the percentage printed on the datasheet.
Levelized Cost of Electricity (LCOE)
Yield Per Acre
Land-use efficiency combines installed capacity density with annual energy production.
A dense layout can install more watts within a fixed area but produce less energy per watt because of shading. A wider layout may improve yield but increase land, trenching, road, cabling and security costs.
A 2024 NREL planning guide uses approximately 5 to 7 acres per MW as an indicative range for ground-mounted solar development. The actual requirement varies with topography, orientation, setbacks, tracker geometry and whether capacity is reported on an AC or DC basis[14].
Land figures should always identify:
· Whether the unit is an acre, hectare or Chinese mu
· Whether capacity is stated in MWdc or MWac
· Whether the area is module footprint, usable project area or total fenced area
One hectare equals approximately 2.471 acres, while one Chinese mu equals approximately 0.1647 acre. Confusing these units can change the reported land density by several times.
The effect of module technology must also be separated from the effects of tracking and layout.
Comparison | Primary Purpose |
TOPCon bifacial fixed-tilt versus PERC bifacial fixed-tilt | Compare module efficiency, bifaciality and degradation under similar geometry |
TOPCon bifacial tracker versus PERC bifacial tracker | Compare module technologies under similar tracking conditions |
Bifacial tracker versus monofacial fixed-tilt | Compare complete system packages |
A complete system-package comparison is appropriate for investment decisions, but its entire energy advantage should not be attributed to N-type cell technology.
Operations and Maintenance Cost Impact
Energy yield, operating expenditure and financing costs should be recorded separately in the financial model.
Item | Model Category |
Temperature coefficient and bifacial gain | Energy yield |
Module degradation | Lifetime energy yield |
Cleaning, inspection and repair labour | O&M expenditure |
Tracker and inverter service | O&M expenditure |
Insurance premium and cost of debt | Financing and risk cost |
Bifacial production can partly offset front-side soiling loss, but this does not mean that bifacial or TOPCon modules are inherently less sensitive to dust. The rear surface can also become soiled, and the amount of compensation depends on available rear irradiance.
Cleaning frequency should therefore be based on measured soiling loss, seasonal rainfall, water and labour costs, access conditions and the value of recovered electricity.
PID risk should also be assessed by module construction rather than by technology label alone. Encapsulant resistivity, grounding, system voltage, moisture, temperature and illumination all affect PID behaviour.
NREL identifies O&M expenditure as a material part of utility-scale PV LCOE and separates preventive maintenance, corrective maintenance, cleaning, vegetation management, component replacement and asset management in lifecycle cost analysis[15].
Several projects in our internal dataset recorded lower O&M expenditure for the N-type arrays. However, the projects did not have identical tracker systems, labour rates, cleaning requirements or failure histories, so the difference should not be presented as a universal percentage or fixed CNY/kWh saving.
A project-level comparison should separate:
· Cleaning labour and water
· Vegetation management
· Thermal, visual and electroluminescence inspection
· IV-curve testing
· Tracker and inverter maintenance
· Spare-module inventory
· Module and component replacement
· Insurance and claims administration
Payback Period
LCOE is the present value of lifetime costs divided by the present value of lifetime electricity generation. Its result depends on capital cost, O&M cost, annual yield, degradation, service life and discount rate[16].
Fraunhofer ISE estimated 2024 LCOE for ground-mounted PV systems above 1MW in Germany at approximately 0.041 to 0.050 EUR/kWh in southern Germany and 0.057 to 0.069 EUR/kWh in northern Germany[17].
These European values should not be converted directly into Chinese project benchmarks without adjusting investment cost, irradiation, tax, financing, land, curtailment and grid conditions.
In our matched internal model, total LCOE was 0.241 CNY/kWh for the N-type configuration and 0.268 CNY/kWh for the PERC configuration. The N-type case was therefore approximately 10.1% lower.
The 0.027 CNY/kWh difference was the combined net result of:
· Module and balance-of-system capital cost
· Bifacial and tracker energy gain
· Module degradation
· Availability, clipping and curtailment
· O&M expenditure
· Inverter and tracker replacement
· Land and grid-connection costs
· Financing and discount rate
The same 0.027 CNY/kWh must not be claimed again as a separate saving from bifacial gain, degradation or O&M. Those effects are already included in the total LCOE result.
The following equal-CAPEX example illustrates simple payback only:
Metric | N-Type Configuration | P-Type PERC Configuration |
Initial CAPEX | 350 million CNY | 350 million CNY |
Year-one generation | 140 million kWh | 125 million kWh |
Tariff | 0.36 CNY/kWh | 0.36 CNY/kWh |
Year-one gross revenue | 50.4 million CNY | 45.0 million CNY |
Simple payback before O&M, tax and financing | About 6.9 years | About 7.8 years |
This is not an IRR calculation. IRR requires a complete annual cash-flow model covering debt, interest, tax, depreciation, O&M escalation, degradation, curtailment, component replacement and residual value.
If the N-type project produces 140 million kWh in year one and output declines by 0.4% annually from year two onward, total generation over 25 years is approximately 3.34 billion kWh. Multiplying the first-year result by 25 would incorrectly assume no degradation.
N-type TOPCon bifacial systems create value only when their technical advantages are converted into bankable lifetime energy.
The strongest applications generally combine adequate rear irradiance, controlled shading, low curtailment, generation-linked revenue, a long ownership period and credible O&M execution.
Low-albedo, land-constrained, heavily curtailed or short-hold projects should compare matched system configurations and run sensitivity cases before paying a premium for bifacial modules or trackers.
Long-term performance remains uncertain because module materials, climates and failure mechanisms vary. IEA PVPS recommends combining field observations, accelerated testing and transparent degradation models instead of treating one qualification test or warranty curve as a complete service-life prediction[18].