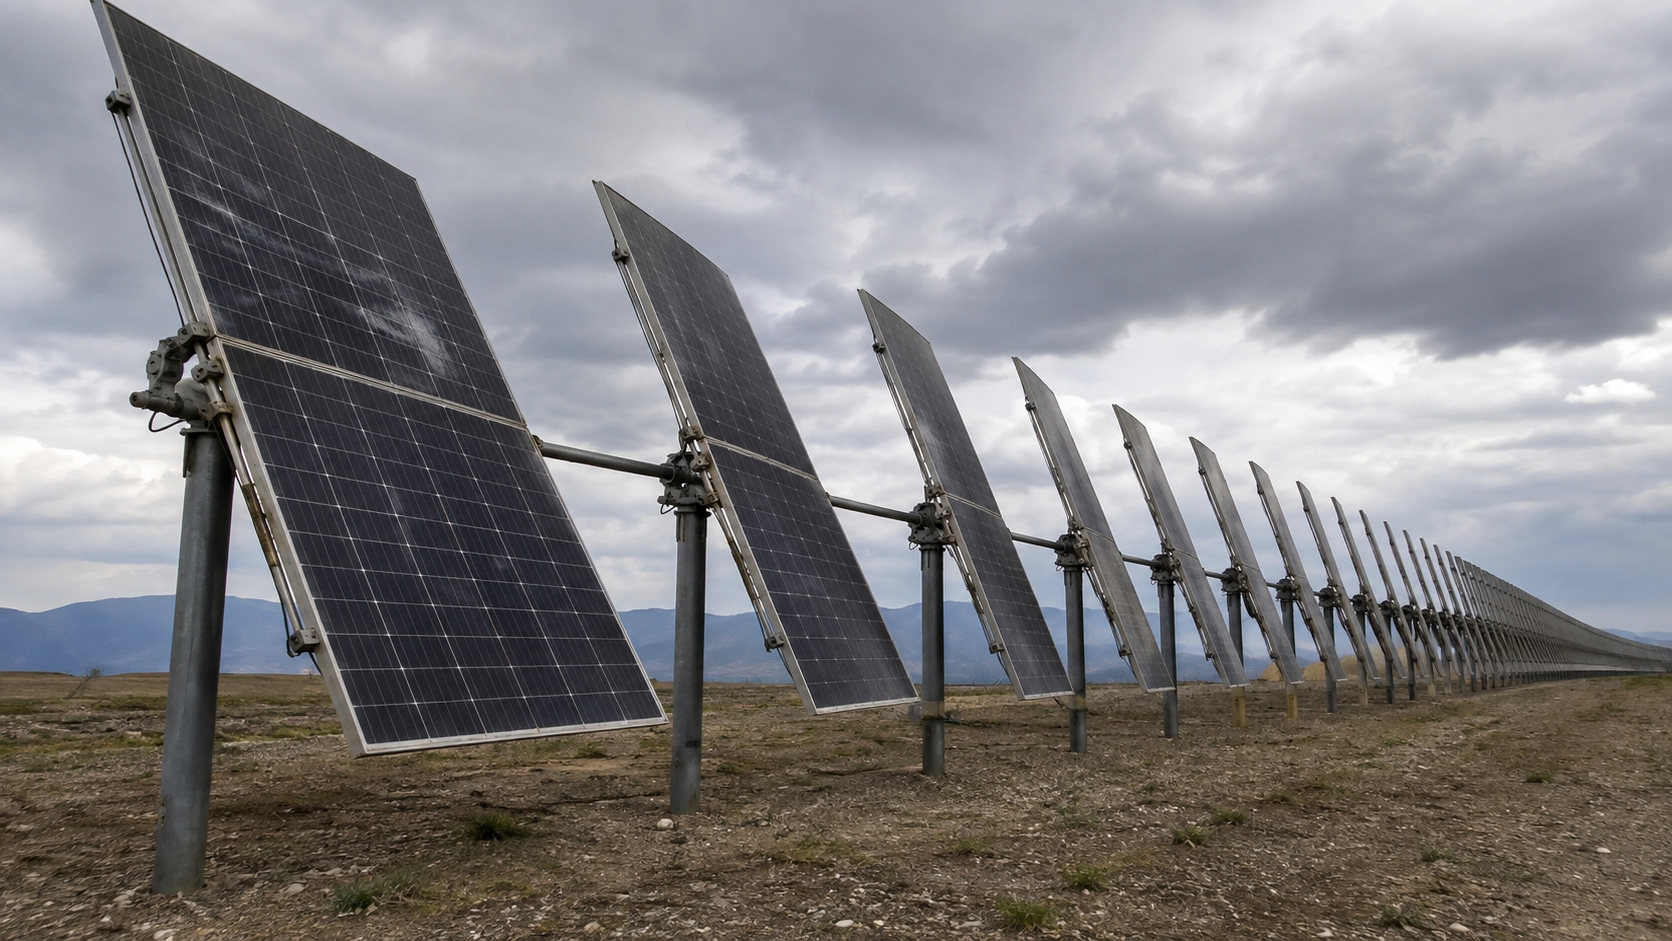
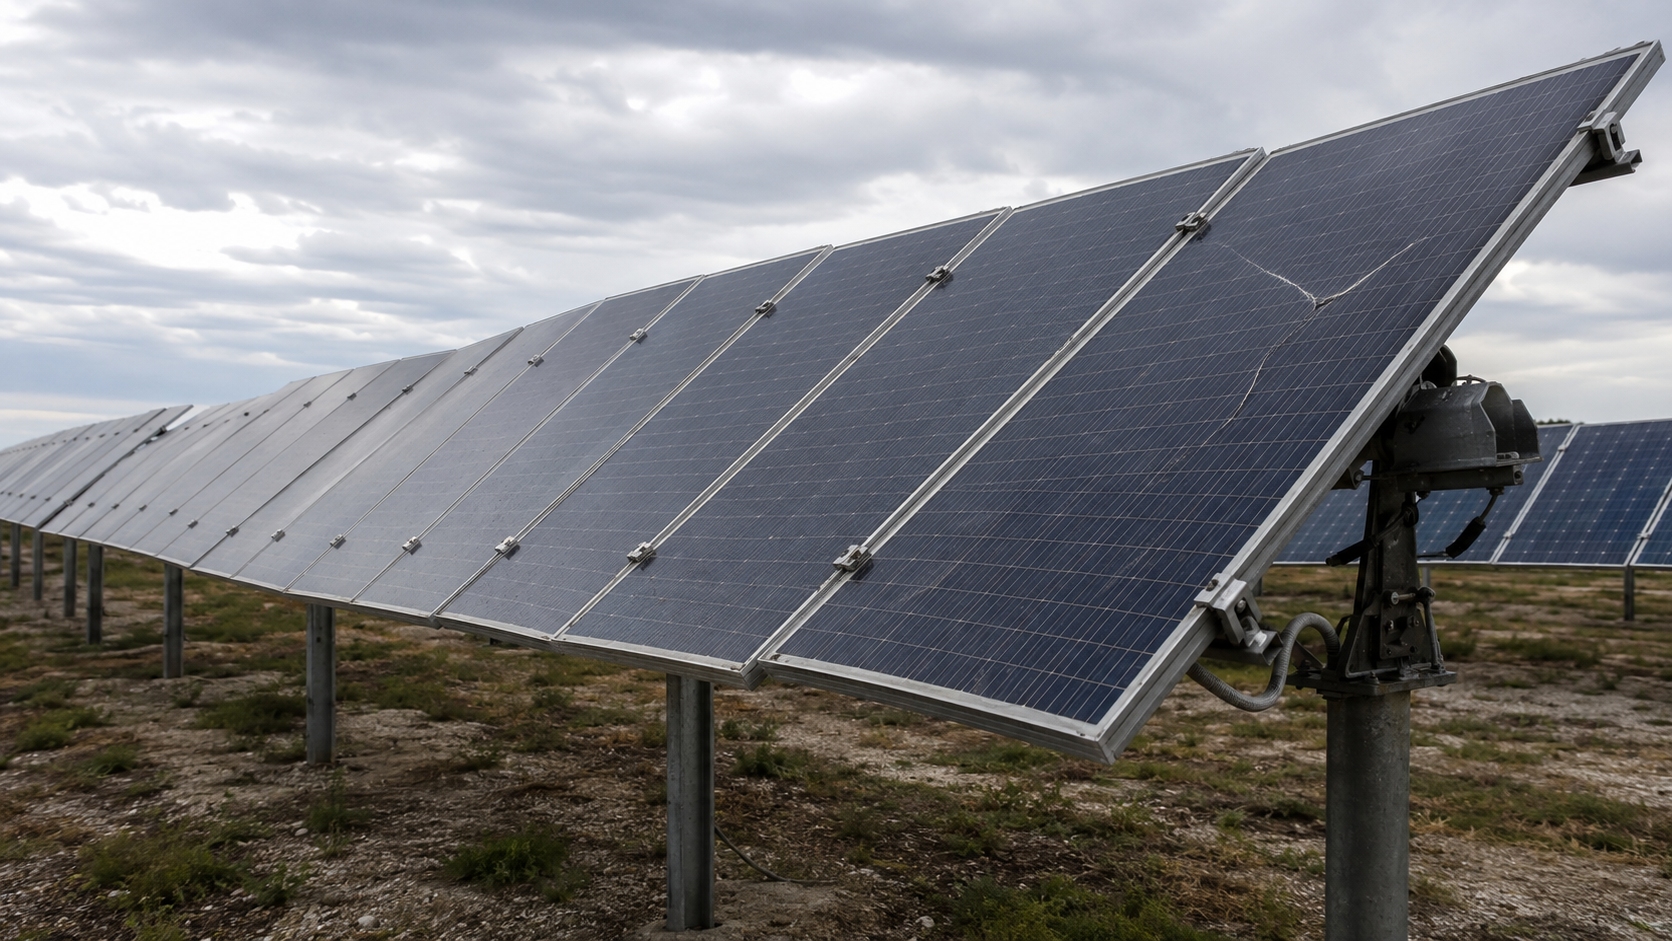
Yes. Solar modules can crack during a tracker stow event when the row twists, the drive stops sharply, wind pressure is uneven, clamps are outside the approved zones or the module already has hidden damage.
Do not blame the stow command simply because damage was found afterward. Treat stow as a likely contributor when controller logs, row measurements and module damage show the same failure path.
| Evidence | What it may show |
|---|---|
| Different angles along one row | Torque-tube twist, bearing resistance or drive mismatch |
| Current spike during startup or braking | Binding, strong wind resistance or a hard stop |
| Damage concentrated near clamps | Wrong clamp position, excessive tightening or frame deformation |
| More failures at row ends | Higher wind exposure or greater end-bay movement |
| Cracks already visible in earlier EL images | Manufacturing, transport or installation damage before stow |
Use Evidence, Not Timing
Separate the event into four parts. Each part leaves different evidence.
| Event stage | Data to check | Likely fault |
|---|---|---|
| Startup | Peak current, angle delay and impact noise | Bearing binding, backlash or sudden acceleration |
| Rotation | Current, wind direction and angle difference along the row | Wind resistance, tube twist or drive mismatch |
| Braking | Overshoot, rebound and stop current | Hard braking or wind pushing the row |
| After stopping | Vibration time and row-end movement | Low damping, loose parts or wind-driven oscillation |
Keep normal low-wind stow, wind stow, emergency stow and repeated stow-release cycles separate. A row that moves normally in low wind may behave differently during a gust or an emergency stop.
Stow is a stronger suspect when damage appears after a current spike, angle disagreement, overshoot or repeated cycling. It is a weaker suspect when the cracks were already present, follow one transport batch or appear only where clamps were installed incorrectly.
Calculate the Force
Total force equals average pressure multiplied by module area. These figures are calculations, not module safety limits.
| Module area | 800 Pa | 1,000 Pa | 1,500 Pa |
|---|---|---|---|
| 2.0 m² | 1,600 N | 2,000 N | 3,000 N |
| 2.3 m² | 1,840 N | 2,300 N | 3,450 N |
| 2.6 m² | 2,080 N | 2,600 N | 3,900 N |
A 2.6 m² module under 1,500 Pa carries 3,900 N of distributed force. A 2.0 m² module under the same pressure carries 3,000 N. The larger module receives 900 N more force before local edge pressure, tracker twist or vibration are added.
The force is distributed across the surface, but the supports do not carry it equally. Clamp position, rail stiffness and module bending determine how much force reaches each support point.
Use the full model number when checking dimensions and mass. Tongwei products cover several formats, so the Tongwei module range and the exact product datasheet must be checked before any tracker calculation. For example, the TWMNH-66HD datasheet applies only to that named product series.
Measure Row Twist
Measure the tracker angle at the drive, both quarter points and both row ends. Use synchronized instruments or take all readings at the same time.
The torque tube stores elastic twist when one section moves before another. The module then follows support points that are no longer in one plane.
Drive → torque tube → rail or bracket → clamp → frame → glass → cells
| Angle difference | Movement at a 1 m lever arm |
|---|---|
| 0.1° | About 1.7 mm |
| 0.3° | About 5.2 mm |
| 0.5° | About 8.7 mm |
These are geometric examples, not allowable tracker limits. Even a small angle can create visible corner movement when the module or rail extends a long distance from the rotation axis.
Check for:
- A larger angle near the drive than at the row end
- One bearing moving later than the others
- A row end continuing to move after the drive stops
- Different rail heights under one module
- Piles leaning in different directions
- Loose torque-tube connections
- One drive starting before another
- Damaged or missing dampers
NREL describes torsional galloping as unstable wind-driven movement that can grow until modules or tracker structures fail. Wind speed, tracker angle, damping, row layout and structural stiffness all change the response.[1]
Sandia has also modeled the effect of torque-tube twist on module orientation along a single tracker row. Its work shows that modules on one row should not automatically be treated as having one identical angle.[2]
A 1P tracker and a 2P tracker do not have the same support layout. Check the approved tracker arrangement rather than applying a short-mount 1P result to every system. Tongwei's G12 tracker compatibility document can be checked with the installation manual when a listed G12 product is used.
Read Motion Data
Compare each row with its own commissioning record. Absolute values from another tracker model are less useful.
| Recorded change | Calculated increase | What to inspect |
|---|---|---|
| Stow time: 60 s to 72 s | 20% | Bearings, wind resistance and drive wear |
| Peak current: 8 A to 10 A | 25% | Binding, alignment and gearbox condition |
| Post-stop movement: 4 s to 7 s | 75% | Dampers, loose joints and row stiffness |
These are comparison examples, not alarm limits. A longer row, different drive or different wind condition may have a different normal value.
Acceleration is more likely to matter when the log shows:
- A sharp current peak at startup
- Hard emergency braking
- Target-angle overshoot
- A reverse movement after stopping
- A bearing releasing after it has been stuck
- Different timing between multiple drives
- Repeated automatic retries
- A change after new firmware or control settings
A low maximum speed does not prevent a sharp load. A tracker that starts or stops almost instantly can create a larger short-term force than one using a smooth speed ramp.
Motor current serves only as supporting evidence. Voltage, motor temperature, gearbox efficiency, friction and wind direction also change current.
Check Wind Data
Wind pressure changes roughly with the square of wind speed. These values compare theoretical relative pressure only.
| Wind-speed change | Relative pressure |
|---|---|
| 10 m/s to 15 m/s | About 2.25 times |
| 10 m/s to 20 m/s | About 4 times |
| 10 m/s to 25 m/s | About 6.25 times |
Actual module pressure also depends on air density, wind direction, tracker angle, terrain, row spacing and aerodynamic coefficients. Do not convert this table into a stow threshold.
Check the windward rows, row ends, slopes, gaps and field boundaries separately. An anemometer in a sheltered central position may not represent an exposed damaged row.
| Sampling interval | Values stored per minute | What may be missed |
|---|---|---|
| 1 second | 60 | Most short gusts are visible |
| 10 seconds | 6 | A peak between samples |
| 1-minute average | 1 | Short gusts and braking events |
A five-second gust occupies only 8.3% of a one-minute averaging period. A one-minute value can therefore hide the peak that acted during the stow movement.
Confirm:
- Anemometer location and height
- Average wind speed
- Peak gust speed
- Wind direction
- Sampling and averaging periods
- Sensor calibration date
- Obstructions around the sensor
- Clock synchronization with tracker logs
Count repeated movements as well. Six complete stow-and-release cycles on each of 15 windy days add 90 cycles in one month and 1,080 cycles in one year. This is an operating example, not a fatigue limit.
Use separate stow and release thresholds, with a time delay between them, to prevent small wind changes from repeatedly reversing the tracker.
Check Clamp Geometry
Measure clamp position, length, thickness, overlap and fastener condition. Correct torque cannot fix an incorrect position.
The linked 2024 Tongwei PV Module Installation Manual states that its covered clamp installation uses at least four symmetrical clamps. It also states:
- Clamp length: at least 50 mm
- Clamp thickness: at least 4 mm
- Frame overlap: at least 10 mm
- The clamp must not contact the front glass
- The clamp must not deform the frame
- M8 bolt torque example: 15–18 N·m
The bolt torque is an example for the hardware described by the manual. The actual clamp and bolt design determines the correct value. Check the latest document in the Tongwei download center before using any value.
The same manual shows why one published Pa value cannot be applied to every clamp layout. For some listed models, long-side mounting method A is shown at 5,400/2,400 Pa, while short-side methods in the same table may be limited to approximately ±1,200 or ±1,600 Pa. Use the row for the exact model and installation method.
If an approved clamp zone begins 400 mm from the module corner but the installed clamp center is at 375 mm, the clamp is 25 mm outside the approved zone. Retightening the bolt does not correct the 25 mm position error.
| Finding | Likely problem |
|---|---|
| Polished aluminum or metal dust | The module has moved inside a loose clamp |
| Changed gap between modules | Clamp slip or rail movement |
| Frame dent below the clamp | Excessive preload or a small contact area |
| Clamp close to or touching glass | Wrong clamp design or frame deformation |
| Glass crack starting beside a clamp | Local stress, frame damage or an earlier glass flaw |
| Aligned paint mark but low joint force | Joint settlement or coating compression |
Inspect below the module through the full tracker angle. Bearings, torque tubes, bolts, cables, connectors and metal burrs must not touch the glass, backsheet or junction box.
Check Module Size
A 2.6 m² module receives 30% more total force than a 2.0 m² module under the same pressure. Mechanical strength is not determined by area alone.
| Item | What to verify |
|---|---|
| Glass | Thickness, heat treatment, edge quality and surface damage |
| Frame | Height, wall thickness, shape and corner connection |
| Support | Rail length, clamp spacing and unsupported overhang |
| Laminate | Encapsulant stiffness, cell format and interconnection design |
| Handling | Pallet condition, unloading, lifting and tool impacts |
A 2025 national-laboratory review found that modern modules are moving toward large glass-glass formats with thinner glass and several simultaneous design changes. The authors identified module area, glass thickness, heat treatment, frame changes and mounting as possible contributors to early glass failure rather than naming one universal cause.[3]
Glass-edge damage can start during packaging, transport or unloading. IEC 62759-1:2022 provides methods for simulating transport of complete module packages and the environmental effects that follow transport.[4]
Inspect pallets, corner protectors and module edges before blaming the tracker. Keep shipment, unloading and installation records for the affected serial-number range.
Know Test Limits
| Evidence | What it proves | What it does not prove |
|---|---|---|
| IEC 61215 qualification | The tested design completed the required qualification sequence | A fixed service life or compatibility with every tracker |
| Static mechanical load test | Response to the stated pressure and support method | Long-term response to repeated loading |
| Dynamic mechanical load test | Response to repeated positive and negative uniform pressure | Full-row twist or uneven field wind |
| Tracker-specific module test | Response with representative rails and clamps | Every site tolerance, storm and installation error |
| Representative row test | Interaction among modules, tube, bearings and drive | Every production or terrain variation |
IEC 61215-1:2021 states that qualification results are not a numerical prediction of module lifetime. Service life still depends on design, use and environment.[5]
IEC TS 62782 applies alternating positive and negative uniform pressure while the module is held at its design support points. It can expose cell, interconnection, bond and seal weaknesses, but it does not reproduce a long tracker row with moving supports and uneven wind.[6]
Test load and design load are different. Test load is applied during laboratory testing. Design load is the project value after the required safety factors and structural rules have been applied.
IEC 61730-1:2023 covers construction requirements related to electrical and mechanical safety.[7] IEC 61730-2:2023 defines tests intended to detect failures that could cause fire, electric shock or injury.[8]
A module that passed its original certification must be checked again after glass, frame or insulation damage.
Identify the Damage
| Damage | What may be visible | Best first test | Immediate action |
|---|---|---|---|
| Cell crack | Often nothing | EL imaging | Compare with control modules |
| Rear-glass crack | Crack network or fracture origin | Visual and insulation testing | Secure and isolate the module |
| Front-glass crack | Edge, corner or impact fracture | Visual and fracture analysis | Restrict access and isolate |
| Frame deformation | Dents, bowing or changed diagonals | Geometry measurement | Check clamps and support levels |
| Interconnect damage | May be hidden | EL, I-V and infrared | Check resistance and heating |
A cell crack may remain electrically connected. NREL applied one million cycles at each of several low pressure levels to a commercial module containing newly cracked cells. Ten-pascal cycles caused little change, while 30 Pa caused existing damage to continue growing. This was a case study of an already cracked cell, not a 30 Pa cracking limit for intact modules.[9]
In another NREL study, modules with cracked cells degraded an average of 0.5 percentage points more than uncracked modules over 21 months in the tested group. The result shows that crack effects can grow, but it is not a universal degradation rate.[10]
Broken glass requires a safety decision even when power is normal. The Tongwei installation manual prohibits the installation or use of damaged modules and warns that contact with damaged glass may create an electric-shock risk.
Build the Evidence
Use this order before hardware is moved or retightened:
- Secure the area around broken glass.
- Export raw weather, controller and drive data.
- Photograph clamps, frames, bearings and contact marks.
- Map every damaged and inspected module.
- Measure row angles and support geometry.
- Test damaged modules and matched controls.
- Compare all possible causes with the same evidence.
Record:
- Block, row, table and module position
- Distance from the drive and row end
- Module model and serial number
- Production and shipment batch
- Clamp position and hardware type
- Visible fracture origin
- Weather and movement time
- EL, I-V, infrared and insulation results
The Tongwei module authenticity query can support serial-number checking. Root-cause work may still require production BOM, packaging and shipment records.
Do not test only broken modules. A balanced example could include:
| Sample group | Example quantity |
|---|---|
| Visibly broken modules | 15 |
| Adjacent normal-looking modules | 15 |
| Modules near the drive | 10 |
| Row-end modules | 10 |
| Unaffected control modules | 20 |
| Total | 70 |
This is a sample-building example, not a required sample size. The final number depends on the affected population, failure spread and safety risk.
Compare rates, not just counts. If 12 of 100 inspected row-end modules are damaged, the row-end rate is 12%. If 2 of 100 middle modules are damaged, the middle rate is 2%. The observed row-end rate is six times higher.
Use:
- EL: cell cracks and disconnected cell areas
- I-V: power, fill factor and resistance changes
- Infrared: hot cells, inactive areas and resistive connections
- Insulation tests: glass, backsheet and junction-box safety
- Fracture analysis: glass origin, edge flaws and impact marks
NREL has published a method using high- and low-current EL images to measure partially and fully disconnected cracked cell areas.[11]
IEA-PVPS treats infrared and EL as complementary methods because they reveal different failure types and require different field conditions.[12]
Prevent Repeat Damage
Approve the exact combination, not only the module and tracker brands.
- Full module model and BOM
- Frame and glass construction
- Tracker and torque-tube version
- Clamp, rail and bolt part numbers
- Support spacing and overhang
- Approved positive and negative loads
- Stow angle and movement profile
- Site wind pressure and direction
Use the Tongwei download center to confirm the current installation manual, product specification and applicable warranty before construction or replacement work.
The structural model should report:
- Angle difference along the row
- Reaction force at each module support
- Module corner movement
- Clamp and rail deformation
- Drive torque during startup and braking
- Response to uneven wind
- Response to one failed drive, bearing or damper
Sandia compared simplified module models with a detailed finite-element model under 1.0 kPa. Simplified homogeneous models underpredicted peak deflection by 13%–19%, while basic plate theory overpredicted it by 45%–67%. Detailed models were still required for accurate local stress analysis.[13]
Record a commissioning baseline for every tracker type:
- Startup and peak current
- Time required to reach stow
- Angle overshoot
- Time for vibration to stop
- Drive-to-row-end angle difference
- Difference between multiple drives
- Number of automatic retries
Investigate when the same row becomes slower, draws more current, overshoots farther or vibrates longer than its own baseline.
Finally
Treat stow as a cause only when logs and physical evidence agree. A 2.6 m² module under 1,500 Pa carries 3,900 N, and doubling wind speed raises theoretical pressure about four times. Export high-resolution wind and drive data, photograph clamps before adjustment, and measure row angles at the drive, quarter points and ends. Check the exact clamp table because a load approved for long-side mounting may be much lower for short-side mounting. Use EL for cell cracks, I-V for electrical impact, infrared for heating and insulation tests for safety. Follow the manufacturer's isolation and replacement rules for every glass-broken module.