Yes. A PV module or string fault can remain invisible in total AC power while the remaining array still has enough DC capacity to hold the inverter at its output limit. In a 650 kWp array connected to a 500 kW inverter, losing one of 40 equal strings may leave the midday output fixed at 500 kW. The same fault becomes visible in string current immediately and in total AC power after the inverter leaves the clipped state.
Hidden Margin
Use the inverter's actual active-power limit, not only its nameplate rating.
DC power needed for full AC output = active AC limit ÷ inverter efficiency
For a 500 kW inverter operating at an assumed 98% efficiency:
500 ÷ 0.98 = 510.2 kW DC
If the array could produce 590 kW DC at its maximum power point:
Hidden margin = 590 − 510.2 = 79.8 kW DC
The array can lose about 80 kW of available DC power before the loss begins to reduce the 500 kW AC plateau under those exact conditions.
| Condition | Available DC power | Potential AC power at 98% | Reported AC power |
|---|---|---|---|
| Healthy and clipping | 590 kW | 578.2 kW | 500 kW |
| 50 kW DC loss | 540 kW | 529.2 kW | 500 kW |
| Healthy and not clipping | 408 kW | 399.8 kW | 399.8 kW |
| Same 50 kW DC loss | 358 kW | 350.8 kW | 350.8 kW |
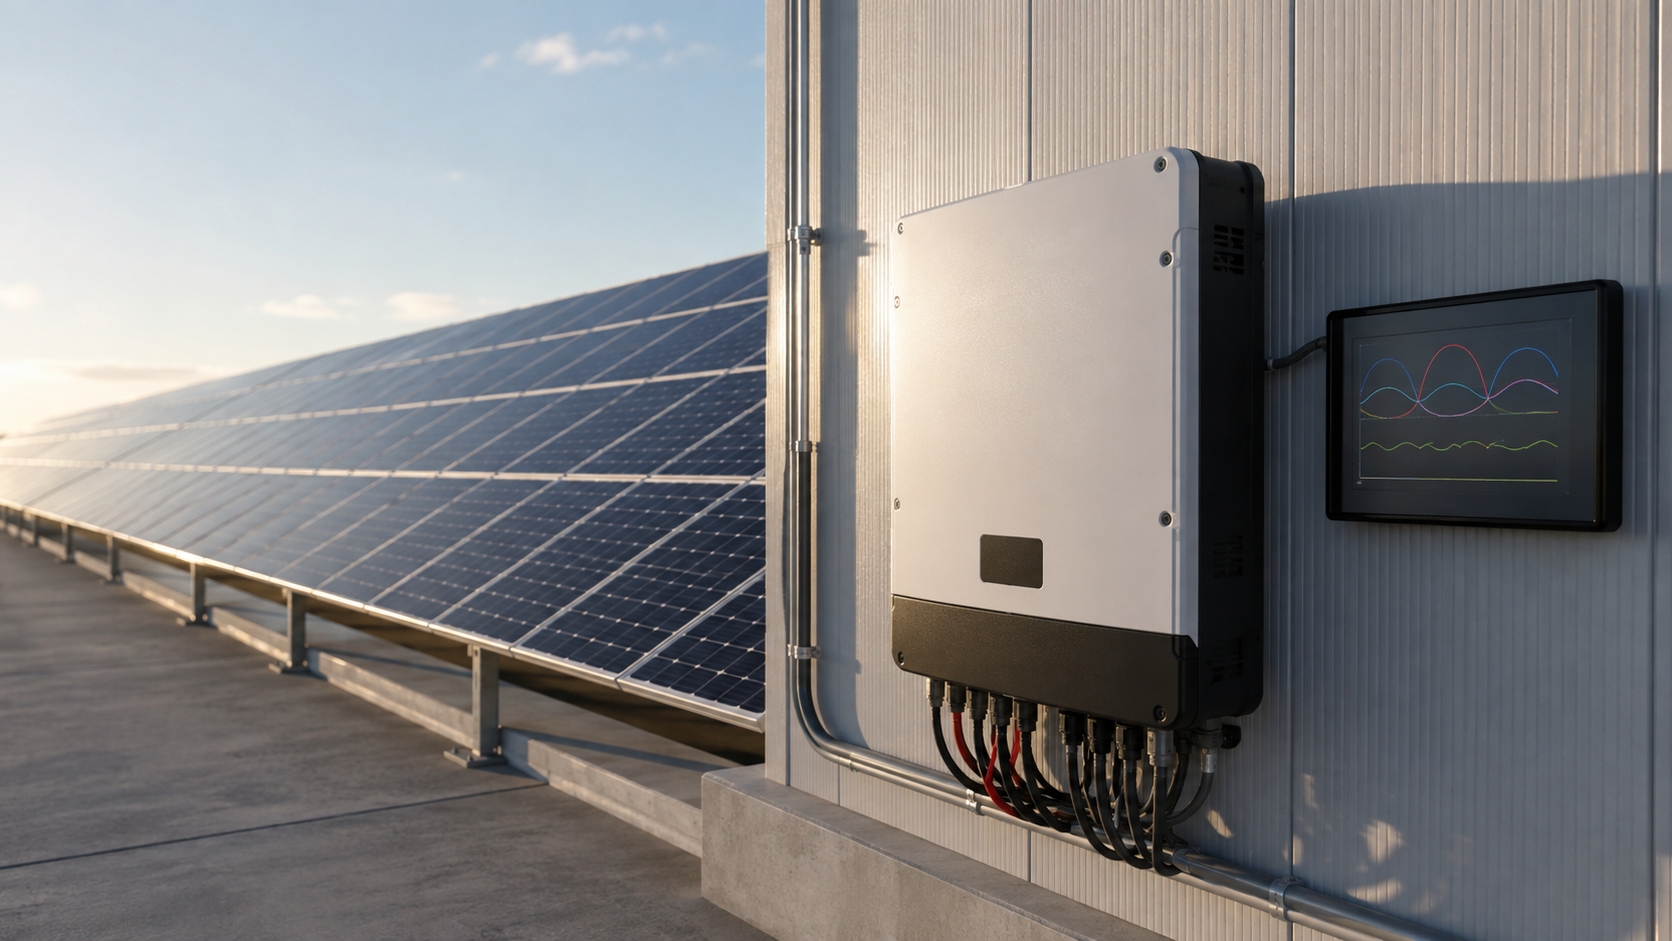
During clipping, many inverters move the array away from its true maximum power point to limit input power. The DC value displayed by the inverter may therefore be a controlled value, not the full power the array could have produced.[1]
Estimate unconstrained DC power from a weather-corrected model, a healthy peer inverter, data immediately before clipping, or a safely performed I-V test. Do not calculate hidden margin directly from clipped DC telemetry.
The 98% efficiency used above is only an example. Inverter efficiency changes with load and DC voltage, so a detailed calculation should use the manufacturer's efficiency curve or a validated inverter model.[2]
Clipping Window
A DC fault may shorten the clipping period without changing the height of the AC plateau.
| Condition | Clipping starts | Clipping ends | Clipped time |
|---|---|---|---|
| Healthy array | 10:45 a.m. | 2:20 p.m. | 215 minutes |
| Faulted array | 11:05 a.m. | 2:00 p.m. | 175 minutes |
| Change | 20 minutes later | 20 minutes earlier | 40 minutes shorter |
Compare these five values on similar clear days:
- Clipping start time
- Clipping end time
- Total clipped minutes
- Power during the 30 minutes before clipping
- Power during the 30 minutes after clipping
The time difference is not fixed. It changes with irradiance, cell temperature, cloud movement, array direction, tracker position, and fault size.
NREL found that hourly data can miss subhourly irradiance peaks and underestimate clipping losses, especially at higher inverter loading ratios.[3]
| Sampling interval | Records per day | Eight-minute event |
|---|---|---|
| 1 minute | 1,440 | About 8 records |
| 5 minutes | 288 | Usually 1–2 records |
| 15 minutes | 96 | May appear in one averaged record |
| 60 minutes | 24 | May disappear inside the hourly average |
DC/AC Ratio
DC/AC ratio = array DC nameplate capacity ÷ inverter AC rating
For a 650 kWp array and a 500 kW inverter:
650 ÷ 500 = 1.30
| Example ratio | Likely monitoring effect |
|---|---|
| 1.00 | Less spare DC capacity is available to hide a fault |
| 1.15 | Short clipping periods may appear during strong irradiance |
| 1.30 | Small DC losses may remain hidden through part of midday |
| 1.50 | Clipping duration and inverter input-current limits need closer review |
These are operating examples, not design limits. The same 1.30 ratio can produce different clipping results in hot and cold climates, east-west rooftops, fixed-tilt arrays, trackers, and bifacial systems.
Use the voltage, current, power, temperature coefficients, bifaciality, and maximum system voltage of the selected module. Tongwei's module range covers different power classes and application types, while its application data provides electrical values for residential, commercial, and utility-scale modules.
Temperature Check
Temperature can create a power difference larger than the fault being investigated. Higher cell temperature normally reduces module voltage and maximum power.[4]
A 635 W Tongwei TNC-G12R 66 monofacial module is listed with:
- Vmp: 41.11 V
- Imp: 15.45 A
- Voc: 49.65 V
- Pmax temperature coefficient: −0.28%/°C
- Voc temperature coefficient: −0.24%/°C
- Three bypass diodes
These values are available in Tongwei's commercial and utility-scale module specifications.
At a cell temperature of 55°C instead of 25°C:
Temperature rise = 55 − 25 = 30°C
Estimated power reduction = 30 × 0.28% = 8.4%
635 W × 8.4% = about 53 W per module
A 25-module string could show a simplified temperature-related reduction of:
25 × 53 W = about 1.33 kW
This is not a fault. Compare strings at similar cell temperatures or correct the data before judging performance.
Cold temperature raises Voc. For 25 modules:
STC string Voc = 25 × 49.65 = 1,241.25 V
At −10°C, the temperature is 35°C below the 25°C reference:
Estimated Voc increase = 35 × 0.24% = 8.4%
Estimated cold Voc = 1,241.25 × 1.084 = about 1,346 V
Final string length must use the site's design minimum temperature, module tolerances, inverter limits, and the approved engineering calculation.
Power Limits
Confirm the cause of a flat power curve before treating it as normal clipping.
| Condition | Expected evidence |
|---|---|
| AC clipping | High DC availability, fixed AC ceiling, no lower control command |
| Export limit | Plant controller or grid meter holds the site at a set value |
| Utility curtailment | Active-power setpoint is below the inverter rating |
| Reactive-power demand | kVAR rises while available active kW falls |
| Thermal derating | High inverter temperature, fan issue, or derating status code |
| MPPT current limit | One input reaches its current rating before total AC power is reached |
| High grid voltage | AC voltage event, output reduction, or inverter disconnection |
| MPPT voltage problem | String voltage is outside or close to the valid tracking range |
A 500 kVA inverter cannot always supply 500 kW while also providing substantial reactive power. High-current modules or too many parallel strings can also push an MPPT to its current limit before the inverter reaches 500 kW AC.
IEC TS 61724-2:2025 requires PV power-performance testing to use periods when inverter AC output is not constrained. High DC/AC ratios and external power limits reduce the number of usable test periods.[5]
Monitoring Data
| Measurement level | Faults it can expose | Main blind spot |
|---|---|---|
| Plant AC | Large outages and major plant loss | Individual inverter, string, and module faults |
| Inverter | One inverter below comparable units | The exact MPPT or string |
| MPPT | Voltage, current, or power imbalance between channels | Individual strings combined on one MPPT |
| String | Open strings and large current differences | Small voltage loss and early resistance growth |
| Module | Individual low-output modules | Damage that has not yet reduced measured power |
Keep AC power, DC voltage, DC current, MPPT values, string current, plane-of-array irradiance, module temperature, inverter temperature, grid voltage, power factor, active-power setpoint, and operating status. DOE guidance identifies these electrical and environmental measurements as useful PV monitoring inputs.[6]
IEC 61724-1:2021 covers monitoring equipment, measurement methods, data collection, data-quality checks, and calculated performance values.[7]
Reject or correct data with:
- Different timestamps for irradiance and power
- A dirty irradiance sensor
- Incorrect sensor ratios or units
- Repeated values or fixed zeros
- Missing communication records
- Outdated string maps
- Unrecorded maintenance changes
MPPT and Strings
Compare MPPTs only when module type, string length, string count, direction, tilt, tracker position, shading, and cable length are similar.
For three comparable MPPT channels:
- MPPT 1: 10 strings, 72 kW
- MPPT 2: 10 strings, 71 kW
- MPPT 3: 10 strings, 63 kW
Healthy reference = (72 + 71) ÷ 2 = 71.5 kW
MPPT 3 difference = (71.5 − 63) ÷ 71.5 × 100% = 11.9%
An 11.9% repeated difference under similar irradiance requires a current and voltage check.
| MPPT result | First checks |
|---|---|
| Low current, normal voltage | Open string, shading, soiling, current sensor, or mismatch |
| Normal current, low voltage | Missing module, bypassed substring, wrong string length, or wiring error |
| Low current and low voltage | Multiple faults, severe shading, or incorrect circuit configuration |
| Normal operating point, low tested Pmp | Series resistance, curve-shape loss, or intermittent fault |
For ten similar strings:
- Nine strings: 9.8–10.2 A
- Healthy median: 10.0 A
- Weak string: 7.6 A
Current difference = (10.0 − 7.6) ÷ 10.0 × 100% = 24%
A repeated 24% difference under stable irradiance is not normal module tolerance. Check shading, soiling, connectors, sensor scaling, and the string I-V curve.
An open string may display 0 A, but sensor offset can leave a small reading such as 0.1–0.2 A. Use "near zero" rather than requiring exactly 0.00 A.
Modules in one string carry the same current, while parallel strings on one MPPT operate at a common voltage. A weak module or uneven irradiance can therefore pull other parts of the array away from their best operating points.[8]
Voltage Check
Normal string current does not prove normal string voltage.
Using the 635 W module values above, a 25-module string has an STC maximum-power voltage of:
25 × 41.11 = 1,027.75 V
If one complete module is fully bypassed, the operating voltage may fall by roughly one module's Vmp under comparable temperature and load conditions:
Approximate drop = 41.11 V
With three bypass-protected substrings, the simplified contribution of one substring is:
41.11 ÷ 3 = about 13.7 V
A shorted bypass diode may therefore reduce string voltage by roughly 14 V under comparable conditions. Actual voltage depends on module temperature, cell layout, diode design, and the inverter operating point.
Do not compare a clipped operating voltage directly with datasheet Vmp. During clipping, the inverter may deliberately change DC voltage. Compare simultaneous readings from similar MPPTs or perform an independent test.
I-V Test
An inverter normally reports one voltage-current operating point. An I-V test records the circuit from near short circuit, where voltage is close to zero and current is Isc, to near open circuit, where current is close to zero and voltage is Voc.
- Isc: short-circuit current
- Voc: open-circuit voltage
- Imp: current at maximum power
- Vmp: voltage at maximum power
- Pmp: maximum power
- Fill factor: Pmp divided by Isc × Voc
These values are used in established PV performance models to describe module and array behavior under changing irradiance and temperature.[9]
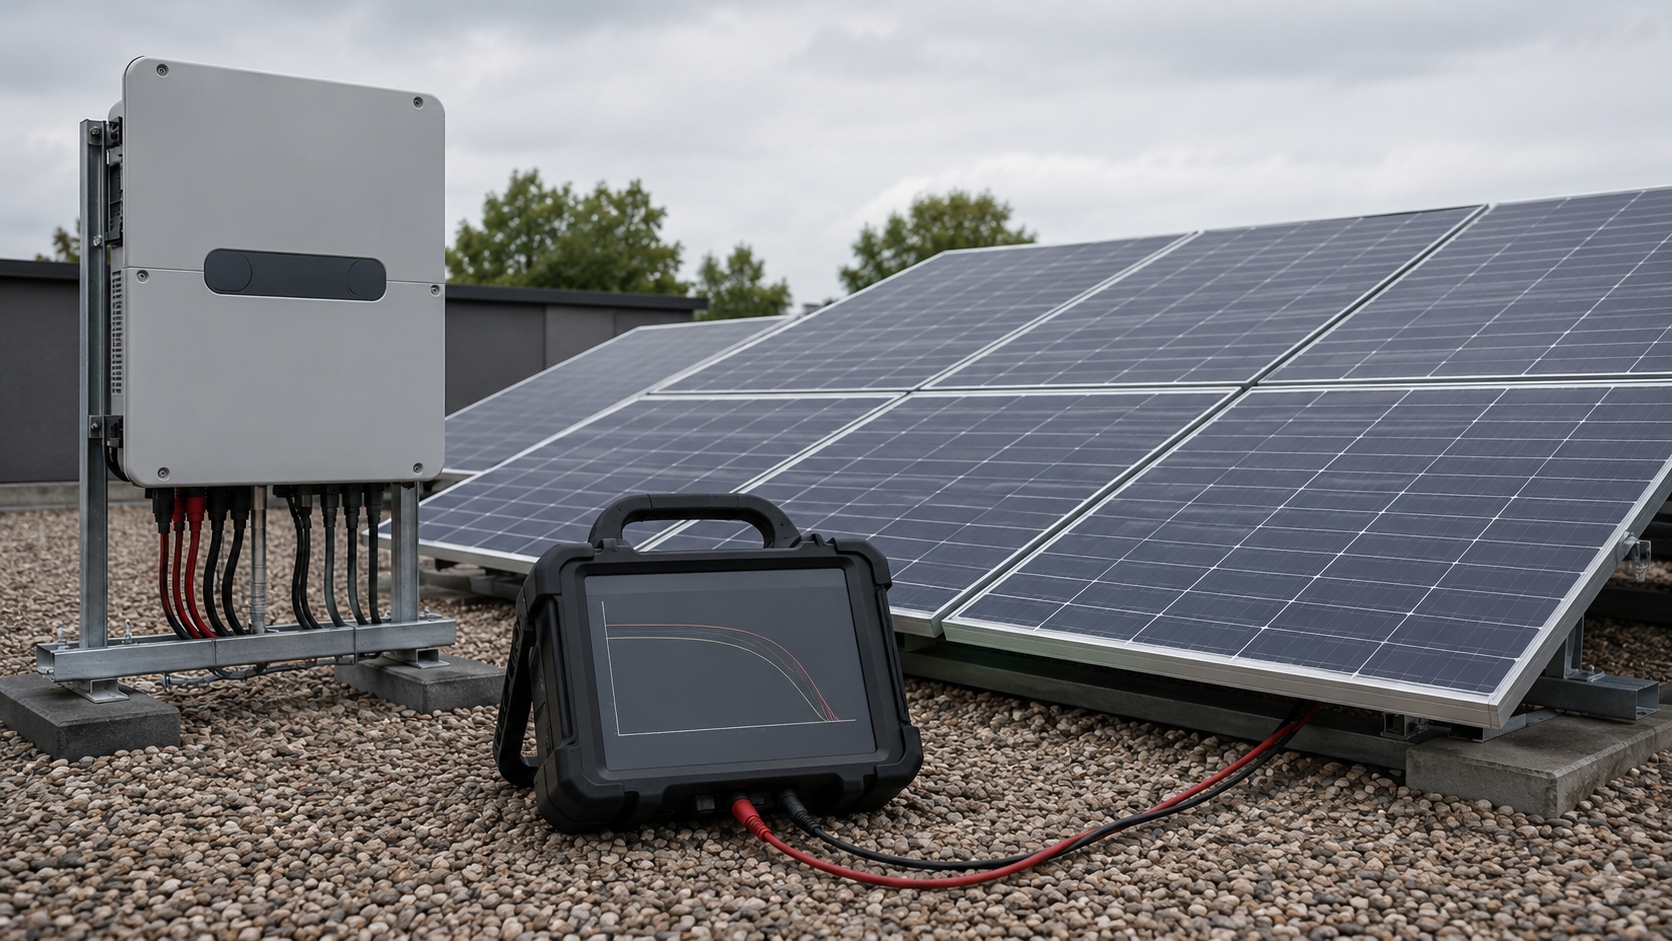
After the circuit is safely isolated from the inverter, an I-V tracer can test it without the inverter's AC ceiling controlling the result.
| I-V value | Healthy string | Abnormal string | Change |
|---|---|---|---|
| Isc | 16.2 A | 15.9 A | −1.9% |
| Voc | 1,240 V | 1,200 V | −3.2% |
| Pmp | 15.6 kW | 14.0 kW | −10.3% |
| Fill factor | 0.78 | 0.73 | −0.05 |
The current changed by only 1.9%, but maximum power fell by 10.3%. Current-only monitoring could miss this problem.
| Curve result | Possible causes | Confirmation |
|---|---|---|
| Low Isc and Imp | Soiling, shading, low irradiance, or current-limiting damage | Check irradiance, clean the surface, and compare peers |
| Low Voc | Missing voltage contribution, shorted diode, PID, or wrong string length | Compare Voc, module count, and diode condition |
| Rounded curve near Voc | Higher series resistance | Inspect connectors, ribbons, junction boxes, and heat |
| Steeper slope near Isc | Low shunt resistance or leakage | Use module-level and insulation-related tests |
| Steps or several knees | Partial shading, mismatch, cell damage, or bypass operation | Inspect shade and test smaller circuit sections |
| Low fill factor | Resistance, leakage, mismatch, or cell damage | Combine I-V, thermal, and imaging results |
IEC 61829:2015 covers on-site array I-V measurement and the related weather measurements.[10]
IEC 60891:2021 defines procedures for correcting I-V curves for temperature and irradiance differences.[11]
Fault Matrix
| Evidence | Likely area | Next test |
|---|---|---|
| String current near zero | Fuse, switch, connector, or open circuit | Continuity and connection checks |
| Low current across several strings | Uniform soiling, common shade, or sensor problem | Inspection, cleaning test, and irradiance check |
| Normal current with lower voltage | Bypassed substring, missing module, or wrong string length | Voc comparison, diode test, and I-V curve |
| Local high temperature | Connector, cell, solder joint, or junction box | Thermography and qualified electrical inspection |
| Low fill factor | Series resistance, leakage, or mismatch | I-V test, thermal inspection, and imaging |
| Suspected cell cracks | Cell or interconnection damage | Electroluminescence testing |
| Insulation alarm | Cable, connector, module, or moisture-related leakage | Qualified insulation and earth-fault testing |
IEA PVPS documents cell cracks, interconnection failures, bypass-diode faults, PID, junction-box faults, hotspots, glass damage, and insulation problems. Each fault requires different evidence.[12]
Higher series resistance can provide an early warning of broken ribbons, solder-bond damage, and contact problems in junction or combiner boxes. Heat may develop before the total energy loss becomes large.[13]
Accelerated module tests cannot detect later installation faults. Tongwei's 2025 Kiwa PVEL results list TC600, Dh3000, PID192, LeTID486, mechanical stress, 40 mm hail, PAN, and UV120 testing; field monitoring is still needed for loose connectors, shading, wiring errors, and site damage.
Alarm Rules
The values below are setup examples, not universal pass-or-fail limits.
| Condition | Example action |
|---|---|
| One isolated 3% peer difference | Record it and wait for more valid data |
| 5% difference lasting 15 minutes | Create a low-priority performance alert |
| 8% difference on three comparable days | Review MPPT, string, weather, and maintenance data |
| String current near zero above 300 W/m² | Check the string, fuse, switch, sensor, and connector |
| Insulation alarm, arcing sign, or severe hotspot | Treat it as a safety issue without waiting for energy-loss confirmation |
Each performance alarm should include:
- A minimum valid irradiance
- A stable-weather filter
- A valid peer or model baseline
- A minimum difference
- A minimum duration
- A repeat or confirmation rule
Field Steps
- Confirm the actual AC limit. Check active-power settings, export limits, kVA rating, reactive power, current limits, and inverter temperature.
- Confirm the operating state. Exclude curtailment, thermal derating, high grid voltage, and MPPT current limiting.
- Compare the clipping window. Check start time, end time, clipped minutes, and shoulder power.
- Use unclipped intervals. Compare stable periods below the inverter limit with healthy peers or a weather-corrected model.
- Compare MPPTs. Separate current loss from voltage loss.
- Check strings. Confirm sensor scaling, fuse state, switches, connectors, string maps, current, and voltage.
- Select the field test. Use I-V tracing, thermography, EL, diode testing, or insulation testing according to the evidence.
- Verify the repair. Repeat the same current, voltage, I-V, or thermal measurement after corrective work.
IEC 62446-1:2016+A1:2018 covers grid-connected PV documentation, commissioning tests, and inspection.[14]
IEC 62446-2:2020 covers preventive, corrective, and performance-related maintenance.[15]
Safety
PV strings can remain at dangerous DC voltage whenever the modules receive light. Opening the AC breaker does not make the DC side safe.
- Do not disconnect ordinary DC connectors while they carry load current.
- Do not measure string Isc with an instrument that is not rated for the full circuit voltage and current.
- Use approved isolation, lockout, tagout, PPE, test equipment, and current system drawings.
- Treat insulation alarms, arcing signs, and severe hotspots as safety faults rather than waiting for a confirmed energy loss.
IEC TS 62446-3:2017 covers outdoor thermographic inspection of operating PV systems and the conditions needed to interpret thermal abnormalities.[16]
OSHA identifies electric shock, burns, electrocution, and arc-flash exposure as hazards during PV electrical work.[17]
Finally
A clipped AC plateau cannot confirm full array health. In the 650 kWp example, the inverter needed about 510 kW DC to hold a 500 kW AC limit, while the healthy array could supply 590 kW DC. That left about 80 kW of hidden margin. Losing one of 40 equal strings still left 575.25 kW DC at noon, so total AC output remained at 500 kW. The same fault reduced unclipped afternoon output by about 7.3 kW AC. Check clipped minutes, MPPT differences, string current, voltage, irradiance, temperature, and inverter status before replacing modules or accepting the system as healthy.