Power drift during flash testing usually comes from temperature, a changing module state, simulator error, scan timing or electrical contact. On a 600 W module, a 5°C rise can change Pmax by about 7.5–10.5 W when the temperature coefficient is between -0.25%/°C and -0.35%/°C. An extra 10 mΩ of resistance at 14 A removes 1.96 W. Check the full I-V curve, stabilize the module temperature and repeat the same test sequence before reporting permanent degradation.
Use the I-V Curve to Find the Cause
IEC 60904-1 defines the measurement of photovoltaic I-V curves under natural or simulated sunlight.[1] Standard Test Conditions use 1,000 W/m² irradiance, 25°C cell temperature and the IEC reference terrestrial spectrum.[2]
| Value | What it measures | What a change often points to |
|---|---|---|
| Isc | Current when voltage is close to zero | Irradiance, spectrum, glass condition or cell-current loss |
| Voc | Voltage when current is close to zero | Temperature, recombination or cell-state change |
| Imp | Current at maximum power | Irradiance, spectrum or current mismatch |
| Vmp | Voltage at maximum power | Temperature, resistance or scan error |
| Fill factor | Pmax divided by Voc × Isc | Contact resistance, internal resistance, leakage or scan timing |
| Pmax | Imp × Vmp | The combined result; it does not identify the cause by itself |
| Observed pattern | Check first | Next test |
|---|---|---|
| Voc and Vmp fall while Isc stays stable or rises slightly | Module temperature | Allow the module to reach thermal stability and repeat |
| Isc and Imp fall together while Voc stays nearly unchanged | Irradiance, spectrum or dirty glass | Check the reference device, simulator spectrum and module surface |
| Fill factor falls while Voc and Isc remain stable | Connectors, cables, sense leads or sweep speed | Reconnect the module and repeat with the same temperature |
| Forward and reverse scans give different Pmax values | Pulse length, scan speed or capacitance | Use a longer pulse or slower scan |
| Power changes after light soaking or dark storage | Module stabilization state | Repeat a controlled exposure and storage sequence |
| Power changes when the module is moved or rotated | Test-plane light uniformity | Check the irradiance map |
Correct Temperature Before Comparing Power
The table below shows how a 5°C temperature rise affects a 600 W module. The coefficients are calculation examples; use the coefficient for the exact module model.
| Pmax coefficient | Change over 5°C | Power difference | Uncorrected result |
|---|---|---|---|
| -0.25%/°C | -1.25% | -7.5 W | 592.5 W |
| -0.30%/°C | -1.50% | -9.0 W | 591.0 W |
| -0.35%/°C | -1.75% | -10.5 W | 589.5 W |
IEC 60891 defines the procedures used to translate measured I-V curves between different temperature and irradiance conditions.[3]
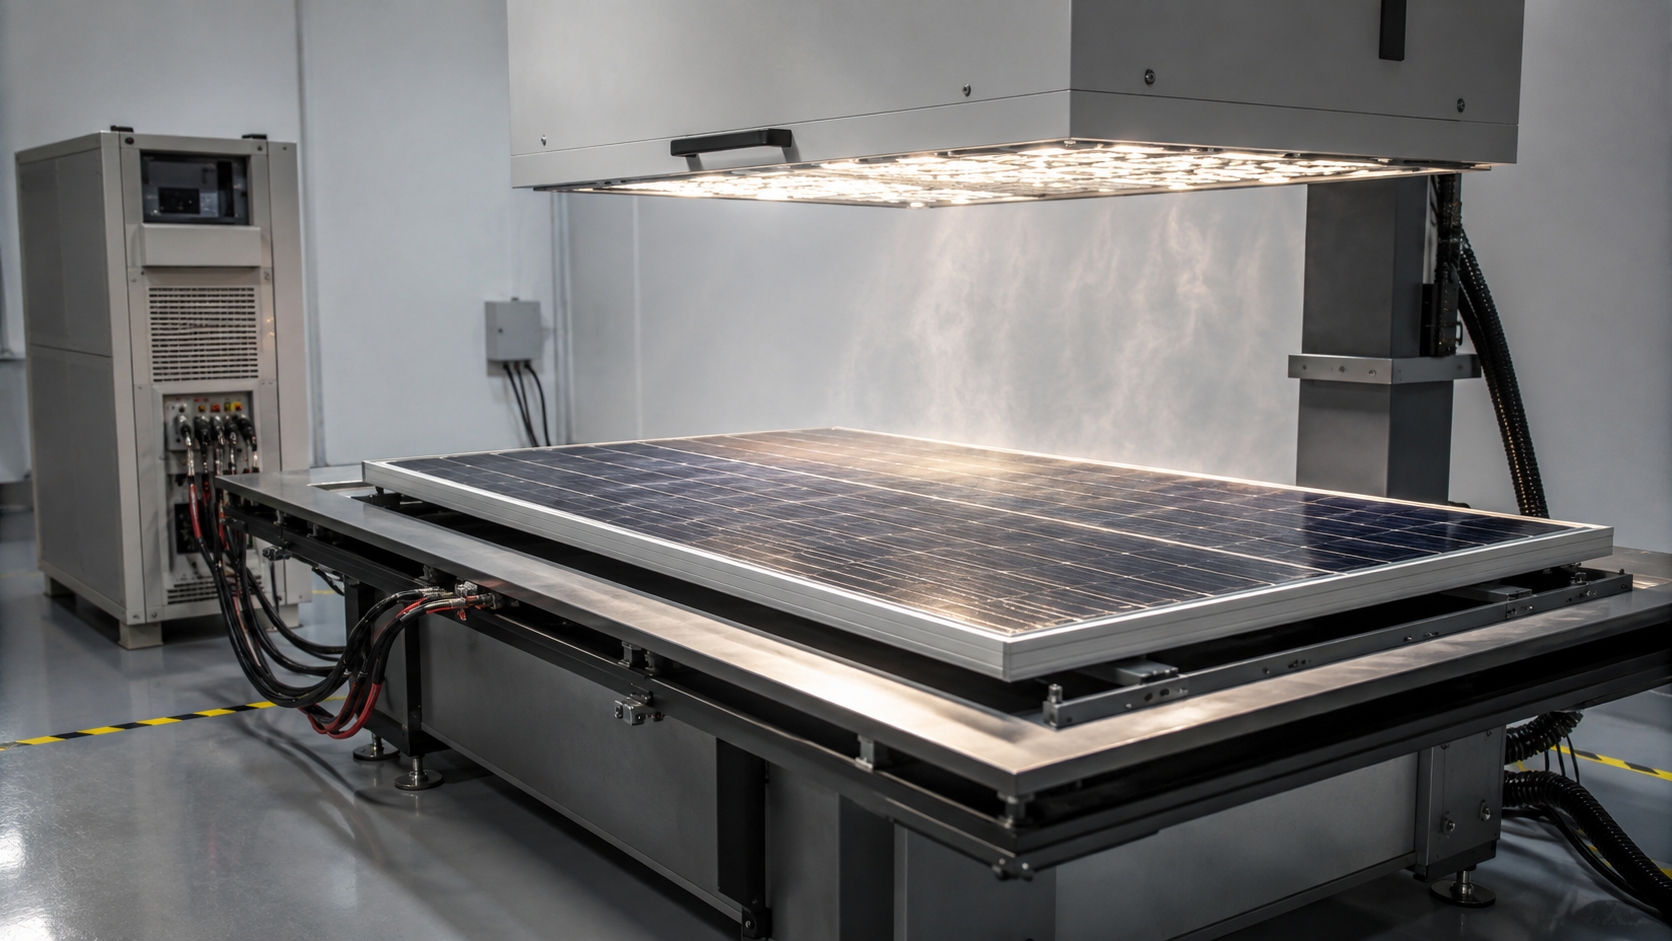
Do not use room temperature as cell temperature. After transport or light soaking, the centre cells may remain warmer than the rear surface, frame and laboratory air. Use the same sensor type, position and attachment method for every comparison. Record both the temperature and its rate of change.
For Tongwei products, confirm the module family on the module product page and use the coefficient in the matching file from the technical document library. A coefficient from another wattage, glass structure or cell technology can produce an incorrect STC correction.
Separate Random Scatter from a Moving Trend
The values below are diagnostic examples, not commercial module test records.
| Flash | Random scatter | Steady decline |
|---|---|---|
| First | 600.2 W | 600.2 W |
| Second | 599.8 W | 598.9 W |
| Third | 600.1 W | 597.7 W |
| Fourth | 599.9 W | 596.8 W |
| Fifth | 600.0 W | 596.1 W |
The random series has a range of only 0.4 W, or about 0.07% of 600 W. It moves above and below the average without a clear direction. The second series falls by 4.1 W, or about 0.68%, across five flashes. Do not hide a steady decline inside an average. Check temperature, connection resistance, scan timing and module stabilization first.
Set the Module to a Known State
Two flash results are not comparable when one module was recently illuminated and the other was stored in darkness. Record the following before each test:
| Condition | Required record |
|---|---|
| Light exposure | Irradiance, duration, spectrum and total dose |
| Temperature | Temperature during exposure, cooling and flash testing |
| Electrical state | Open circuit, short circuit, MPP or forward bias |
| Dark storage | Duration, temperature and connection state |
| Measurement delay | Time between treatment and flash testing |
| Stopping rule | Allowed change between consecutive exposure intervals |
IEC 61215-2 defines the test procedures used in terrestrial module design qualification.[4] IEC 61215-1 states that qualification results are not a numerical prediction of module lifetime.[5]
Do not stop a stabilization process because the result has moved above a pass limit. Stop only when the stated procedure is complete and Pmax, Voc, Isc and fill factor no longer show an unacceptable trend.
Match Stabilization to the Cell Technology
Tongwei's cell technology overview identifies current TOPCon and HJT routes. The test history must match the actual cell technology, not only the module size or rated wattage.
| Technology | Possible power movement | Useful test action |
|---|---|---|
| Boron-doped crystalline silicon | BO-LID can reduce Voc and Pmax after initial illumination | Compare modules in the same initial or stabilized BO-LID state |
| LETID-sensitive crystalline silicon | Power can fall under heat and carrier injection, then recover later | Record the full degradation-and-recovery curve instead of one endpoint |
| TOPCon | UV testing followed by dark storage can add reversible power loss | Apply the defined post-UV light-soaking procedure before comparison |
| HJT / SHJ | Some designs gain Voc and fill factor after light or forward bias | Do not treat every rising Pmax sequence as tester drift |
| CIGS | Light, bias and cooling history can change the measured state | Control the bias condition while the module cools to the measurement temperature |
| CdTe | Light exposure, dark bias and measurement delay can change Pmax | Keep exposure temperature and delay before STC measurement fixed |
| Amorphous silicon | Stabilized output depends strongly on temperature and previous exposure | Use the same light-soaking temperature and exposure history |
IEC 61215-1-1 provides technology-specific requirements for crystalline-silicon modules, including control of light-induced effects.[6]
IEC TS 63342 uses current injection at elevated temperature to detect LETID sensitivity. It does not predict the exact loss that will occur outdoors.[7] In an international laboratory study, deliberately LETID-sensitive modules lost about 6% of Pmax on average, while other module types showed much smaller or negligible losses. The reported 6% is not a normal loss value for every module.[8]
A Fraunhofer study found that light soaking at a 25°C module temperature provided repeatable stabilization for tested TOPCon modules after UV exposure and dark storage.[9]
A silicon heterojunction study reported efficiency gains of up to 0.3 absolute percentage points after light soaking, mainly through higher Voc and fill factor.[10] An increase from 23.0% to 23.3% is 0.3 absolute percentage points, or about 1.3% relative.
A five-laboratory CIGS study found that light exposure followed by forward bias while the module cooled to 25°C produced more repeatable results than testing immediately after hot exposure and relying on a temperature correction.[11]
CdTe and CIGS studies also found temporary electrical changes after dark heat, forward bias and light exposure.[12] For amorphous-silicon modules, controlled tests found that operating temperature and previous exposure history were the main factors affecting stabilized output.[13]
Record Every Light-Soak Condition
Light dose is irradiance multiplied by time. At 1,000 W/m², one hour equals 1 kWh/m².
| Irradiance | Exposure time | Total dose |
|---|---|---|
| 1,000 W/m² | 5 hours | 5 kWh/m² |
| 800 W/m² | 6.25 hours | 5 kWh/m² |
| 500 W/m² | 10 hours | 5 kWh/m² |
Equal dose does not produce an equal electrical state when temperature or bias is different.
| Example | Dose | Temperature | Electrical state |
|---|---|---|---|
| Module A | 5 kWh/m² | 25°C | Operating near MPP |
| Module B | 5 kWh/m² | 65°C | Open circuit |
Module B may change faster because of the higher temperature, while open-circuit operation creates a different carrier condition from MPP operation. Record irradiance, dose, temperature, operating point, cooling method and time to the next flash.
Control Dark Storage Before Retesting
The following values are a diagnostic example, not commercial module data.
| Condition | Pmax | Change |
|---|---|---|
| Immediately after light soaking | 600.0 W | Baseline |
| After 24 hours in darkness | 597.6 W | -0.40% |
| After controlled re-light-soaking | 599.4 W | -0.10% |
The recovery from 597.6 W to 599.4 W shows that much of the apparent loss was reversible. It does not identify the exact material mechanism. Keep dark-storage time, temperature, light level, connection state and measurement delay the same for every sample.
Check Spectrum, Reference Device and Light Uniformity
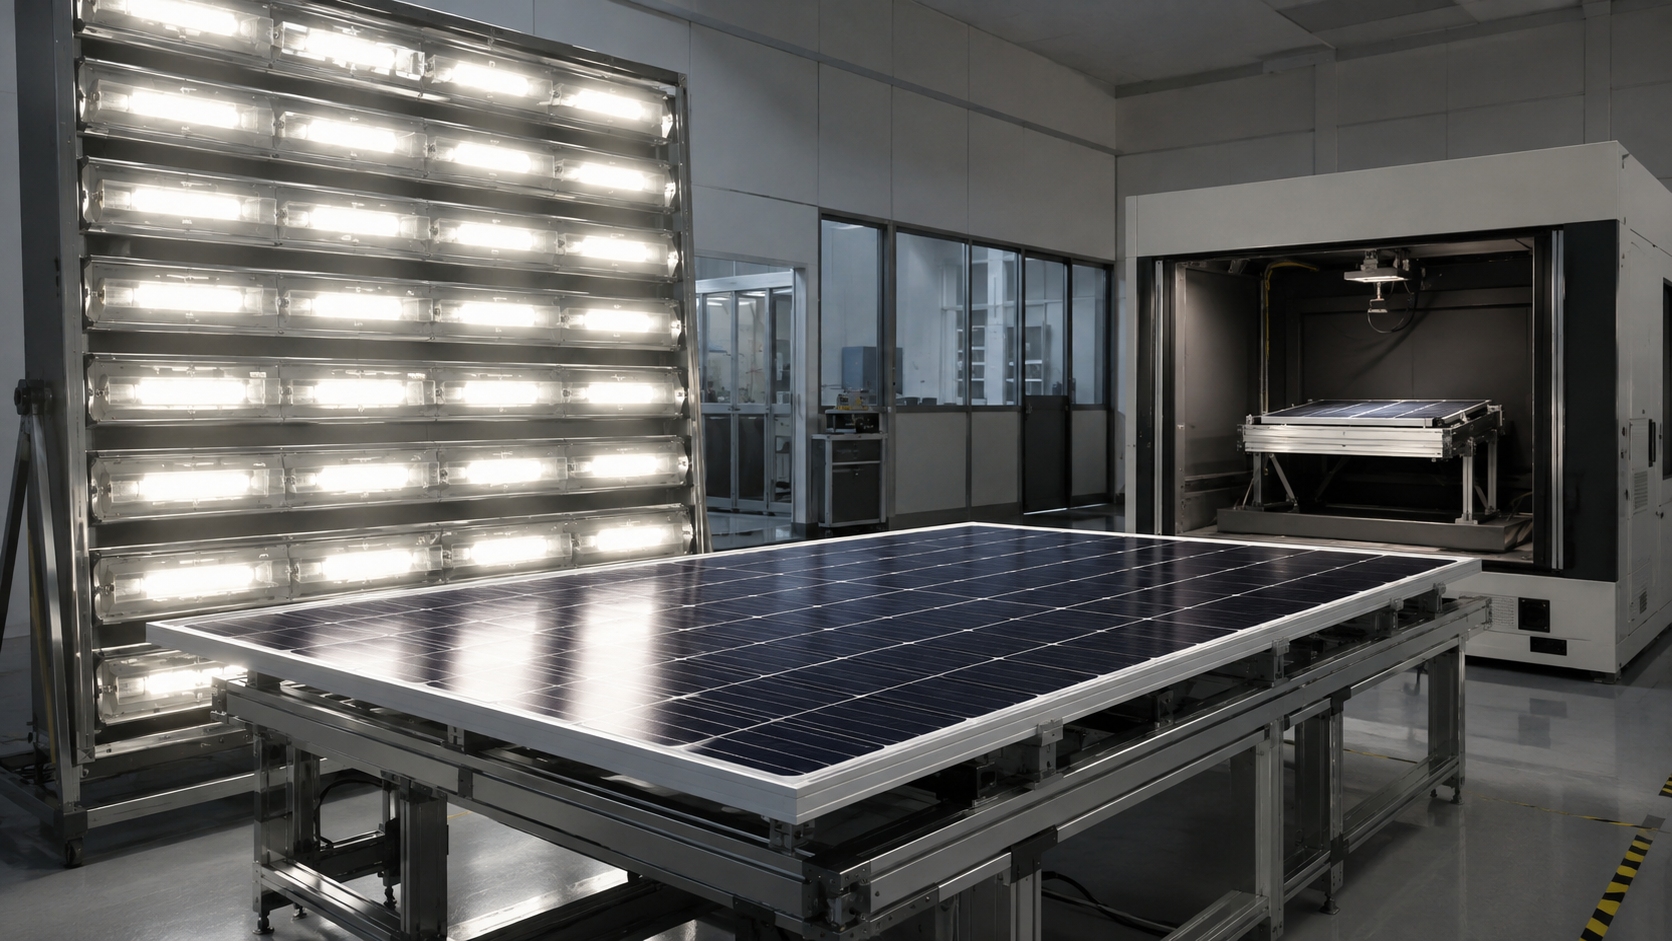
IEC 60904-7 defines spectral mismatch correction for the specific combination of simulator spectrum, reference device and module under test.[14]
If current reads 1% low while voltage and fill factor remain unchanged, a 600 W module can appear close to 594 W:
| Condition | Relative current | Approximate Pmax |
|---|---|---|
| Correct effective irradiance | 100% | 600 W |
| Current reads 1% low | 99% | 594 W |
This is a simplified calculation, not a claim that every simulator has a 1% error. Recalculate spectral mismatch when the cell technology, glass, encapsulant, lamp or reference device changes.
IEC 60904-9 classifies solar simulators separately for spectral match, irradiance non-uniformity and temporal instability.[15] IEC 60904-2 defines the selection, calibration and care of photovoltaic reference devices.[16]
A full module covers a much larger area than a reference cell. If rotating the module 180° changes Pmax from 600 W to 597 W while temperature and cables stay unchanged, inspect the test-plane irradiance map. The 3 W difference is evidence of a position effect, not proof by itself that the simulator fails its IEC class.
Compare Both Sweep Directions
NREL's module measurement facilities include a pulsed system using 30–100 ms flashes with sweeps in both directions, as well as a continuous-light system.[17] The range describes that laboratory equipment; it is not a minimum pulse requirement for every tester.
A 50 ms pulse lasts 0.05 seconds. During that time, the lamp must remain stable, the load must scan the I-V curve, and the current and voltage channels must stay synchronized.
| Sweep | Pmax | Fill factor |
|---|---|---|
| Isc to Voc | 600.0 W | 82.0% |
| Voc to Isc | 594.6 W | 81.2% |
The difference is 5.4 W, or 0.9%. When temperature and irradiance are stable, check pulse length, sweep speed, capacitance and load synchronization. Do not average the two curves before finding the cause.
Calculate Contact and Cable Loss
Contact loss follows I²R. At 14 A:
| Extra resistance | Calculation | Power loss |
|---|---|---|
| 2 mΩ | 14² × 0.002 | 0.392 W |
| 5 mΩ | 14² × 0.005 | 0.98 W |
| 10 mΩ | 14² × 0.010 | 1.96 W |
An added resistance of 10 mΩ removes almost 2 W at 14 A, or about 0.33% of a 600 W result. Voc can remain normal because almost no current flows at open circuit.
Check connector pins, clamp pressure, current cables and voltage-sense positions. A four-wire connection uses separate current and voltage leads so cable voltage drop is not counted as module loss.
Control Rear Irradiance on Bifacial Modules
IEC TS 60904-1-2 defines the additional I-V measurement requirements for bifacial photovoltaic devices.[18]
A simplified equivalent-irradiance example uses:
- Front irradiance: 1,000 W/m²
- Rear irradiance: 100 W/m²
- Bifaciality factor: 70%
Equivalent irradiance = 1,000 + (100 × 0.70) = 1,070 W/m²
If rear irradiance falls to 80 W/m²:
Equivalent irradiance = 1,000 + (80 × 0.70) = 1,056 W/m²
The two setups differ by 14 W/m², or about 1.3% of the first result. Keep the background, support rails, cable position, rear-light level and module-to-background distance unchanged. Use the model-specific bifaciality value from the applicable Tongwei document rather than a general 70% assumption.
Use One Test Sequence
| Check | Required action |
|---|---|
| Module identity | Record model, serial number, cell technology, rated power and bifacial status |
| Required state | Define whether the result is initial, stabilized, post-light-soak, post-stress or dark-relaxed |
| Surface and connectors | Record dirt, condensation, glass damage, junction-box damage and connector condition |
| Temperature | Wait until the module is inside the allowed range and no longer changing rapidly |
| Simulator | Verify irradiance, spectrum, pulse waveform, test position and reference-device status |
| Scan settings | Keep pulse length, delay, direction, point count and correction method unchanged |
| Repeat test | Save every result; do not keep only the average |
| Control module | Test a stable control before and after the sample |
| Raw data | Save the complete I-V curve, temperature, irradiance, time and tester settings |
If a current step, inactive area or unexplained fill-factor loss remains, use EL or infrared testing. Tongwei's module manufacturing process overview shows why flash testing and EL imaging are separate checks: flash testing measures electrical output, while EL helps locate damaged cells and current paths.
Set a Defensible Pass Limit
| Term | Meaning |
|---|---|
| Resolution | The smallest value shown by the instrument |
| Repeatability | The spread from repeated tests under nearly unchanged conditions |
| Reproducibility | Agreement after changing the day, operator, setup or laboratory |
| Measurement uncertainty | The estimated range associated with the reported result |
| Degradation limit | The allowed loss defined by the test method, contract or qualification rule |
An NREL module self-reference calibration procedure reported ±1.1% expanded uncertainty for Pmax at a coverage factor of two. This is the result of a specialised calibration procedure, not a universal production-line limit.[19]
Consider a result that falls from 600.0 W to 596.4 W:
- Power difference: 3.6 W
- Relative difference: 0.6%
If the measurement uncertainty is close to ±1%, the 0.6% difference is not enough by itself to prove permanent degradation. Retest at stable temperature, check the control module and use another diagnostic method before making a pass-or-fail decision.
Finally
A 5°C temperature rise can move a 600 W result by 7.5–10.5 W, 10 mΩ of extra resistance can remove 1.96 W at 14 A, and a 1% current error can appear as roughly 6 W of lost power. Check the I-V pattern before changing the test method: lower Voc usually sends you to temperature first, lower Isc to irradiance or spectrum, and lower fill factor to contacts or scan timing. Keep the module state, temperature, position, reference device and sweep settings fixed. Report degradation only when the loss remains under controlled retesting and is supported by EL, infrared or another independent test.