Is solar photovoltaic cell renewable or nonrenewable?
Solar photovoltaic cells are a classic form of renewable energy. Because they utilize inexhaustible light energy to generate electricity, their conversion efficiencies are generally above 20%.
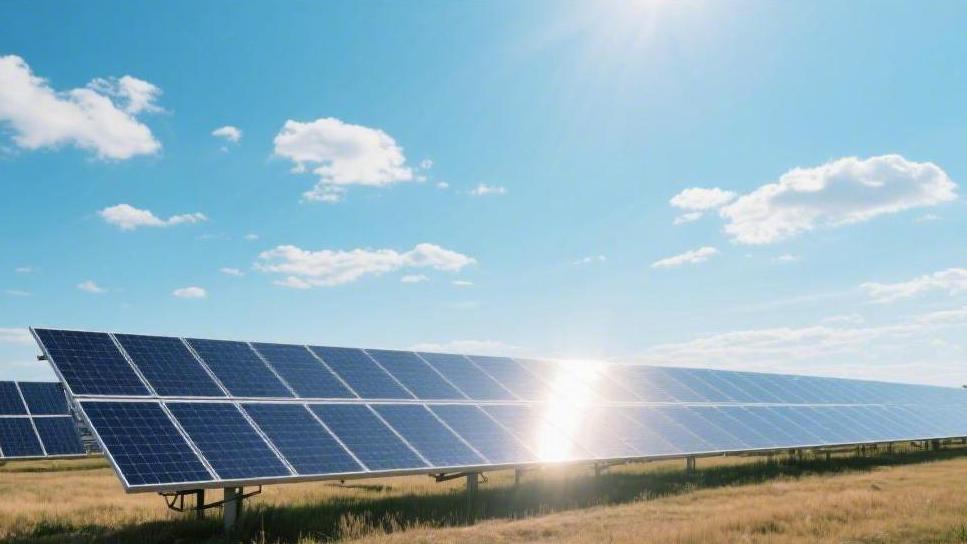
In operation, simply installing silicon panels at a 30-degree tilt facing south allows for the continuous capture of photons to generate current. They have a lifespan of up to 25 years and an energy payback period of only 1.5 years.
Fuel
The sun, acting as a massive nuclear fusion reactor, converts approximately 600 million tons of hydrogen into 596 million tons of helium every second through thermonuclear reactions, releasing a total radiant power of 3.8 x 10^26 watts in the process. Only about one 2.2-billionth of this energy reaches the edge of Earth's atmosphere, forming a solar constant of approximately 1,361 W/m², with its spectral energy distributed across wavelengths from 250 nm to 2,500 nm.
Solar radiation reaching the ground is attenuated by the thickness of the atmosphere; the AM1.5 spectrum is typically used as the standard test benchmark, where standard terrestrial irradiance is defined as 1,000 W/m².
In actual operating environments, the solar energy received by a photovoltaic system depends on geographical latitude and meteorological conditions. For example, in the Sahara Desert or Northwest China, the Global Horizontal Irradiance (GHI) can exceed 2,200 kWh/m² per year.
Theoretically, each square meter of light-receiving surface can capture over 2,000 kWh of electrical energy within 365 days. PV modules respond to these photons through electronic transitions within semiconductor materials. The bandgap of silicon is 1.12 eV; only photons with energy greater than this value (wavelengths shorter than 1,110 nm) can be effectively absorbed to generate free electrons.
Parameter | Quantitative Value | Notes |
Solar Constant | 1,361 W/m² | Measured at the outer edge of the atmosphere |
Standard Irradiance (STC) | 1,000 W/m² | Terrestrial module testing standard |
Silicon bandgap | 1.12 eV | Determines the threshold frequency for conversion |
Spectral Range | 250 - 2,500 nm | Covers UV, visible, and infrared light |
Theoretical Utilization Time | 5 Billion Years | The sustainable lifecycle of the energy source |
The tilt angle of PV panels during ground installation directly affects energy capture efficiency; the optimal tilt is usually set within plus or minus 5 degrees of the local latitude. Employing a single-axis tracking system can increase annual power generation by 15% to 25%, while a dual-axis tracking system can increase this gain to over 35%, though it adds about 10% to the initial investment budget.
For every 1,000 meters increase in altitude, UV intensity increases by about 10% to 12% due to a thinner atmosphere; while this benefits power generation, it also accelerates the polymer degradation of the module's backsheet and encapsulation materials.
The negative impact of ambient temperature on "fuel" conversion is significant. The temperature coefficient of a standard monocrystalline silicon module is approximately -0.35% to -0.45% for every 1°C increase. When the module surface temperature reaches 65°C in midsummer, its rated 580W power output will shrink to around 490W.
To compensate for this loss, station designers usually reserve a DC/AC ratio of 1.2 to 1.4—meaning they install a 1.4 MW PV array to match a 1 MW inverter capacity—to ensure full-load output is maintained under varying light intensities.
The conversion efficiency of PV cells is constrained by the Shockley-Queisser limit, which locks the theoretical ceiling for single-junction silicon cells at 33.7%. Currently, the conversion efficiency of mass-produced N-type TOPCon cells has exceeded 25.5%, while laboratory records for HJT (heterojunction) cells have surpassed 26.8%. Over a 25-year operating lifecycle, due to Light-Induced Degradation (LID) and Potential-Induced Degradation (PID), first-year power degradation is typically controlled between 1% and 2%, with the subsequent annual linear degradation rate maintained at 0.4% to 0.55%.
The cover glass of a PV module typically uses 3.2 mm thick high-transmittance tempered glass, which must have a light transmittance higher than 91.5% to reduce reflection losses before photons reach the silicon wafer. Dust shading is a primary source of real-world loss; in arid regions, dust accumulation on the module surface can cause power losses of 15% to 30% if not cleaned. By deploying automated cleaning robots with a cost of approximately 50 RMB per kilowatt, system failure rates can be reduced to below 2%, significantly improving the project's Internal Rate of Return (IRR).
Efficiency Item | Percentage Value | Influencing Factor |
Theoretical Limit (SQ Limit) | 33.7% | Physical laws of semiconductors |
TOPCon Mass Production Efficiency | 24.5% - 25.5% | Current mainstream technical level |
First-year Degradation Rate | 1% - 2% | Initial light-induced reactions |
Annual Average Degradation Rate | 0.4% - 0.55% | Long-term material aging |
Dust Shading Loss | 5% - 30% | Environmental O&M quality |
Although sunlight itself is free, the hardware required to capture it consumes vast amounts of non-renewable resources. Manufacturing 1 gigawatt (GW) of PV modules requires approximately 1,900 to 2,100 tons of high-purity polysilicon. Silver paste serves as the conductive electrode on the front of the cell; while silver consumption per cell has been optimized from 150 mg to around 80 mg, the PV industry still consumes more than 10% of global annual silver production. Aluminum frames account for about 15% to 20% of the module's total weight, with every 10,000 tons of modules requiring approximately 1,800 tons of extruded aluminum.
The Energy Payback Time (EPBT) is a key metric for measuring the green attributes of a PV system. In regions with good solar resources, the electricity generated by a module in 0.9 to 1.2 years can offset the energy consumed throughout its entire process—from mining and purification to assembly. Over a 30-year expected lifespan, a PV cell spends 29 years producing pure incremental energy. As module power has increased from 400W to over 700W, material consumption per watt has dropped by about 40%, further reducing the system's carbon footprint to 20–30 grams of CO2 equivalent per kilowatt-hour.
From an economic perspective, the Levelized Cost of Energy (LCOE) for solar PV has dropped by more than 85% over the past decade, with the global average falling to $0.048/kWh. In regions with excellent solar resources, such as the Middle East and Latin America, bid prices have reached extreme lows of $0.015/kWh. The construction budget for a typical 100 MW PV plant is approximately 350 to 450 million RMB, with module costs accounting for 45% to 50% and the remaining 50% distributed among cables, brackets, transformers, and land lease fees.
The investment payback period for PV assets is usually between 5 and 8 years, depending on local feed-in tariffs and subsidy policies. Considering discounted cash flow over 20 years, the leveraged Return on Equity (ROE) generally reaches 10% to 15%. As energy storage cell costs fall below 600 RMB per kilowatt-hour, solar-plus-storage systems can achieve stable 24-hour power output. Although this increases initial construction investment by about 30%, it raises the self-consumption ratio from 30% to over 80%, greatly enhancing project risk resistance.
Hardware
Current mainstream silicon wafer purity requirements reach "9 nines" or 99.9999999% to ensure that recombination losses during electron movement within the crystal lattice are minimized. Wafer sizes have evolved from the early 156 mm specifications to the current 182 mm (M10) and 210 mm (G12) standards. Larger wafers allow for more effective power generation area per module; a typical 210 mm specification module can easily exceed 600W output. To save material and reduce thermal resistance, wafer thickness is rapidly thinning from 170 microns to 130 or even 110 microns. This refined processing imposes extreme requirements on diamond wire cutting precision, with current wire diameters reaching about 35 microns—roughly half the width of a human hair.
"With the popularization of N-type cell technology, oxygen content within the silicon wafer is controlled below 10^16 per cubic centimeter, which significantly increases the minority carrier lifetime to over 5,000 microseconds, laying the foundation for conversion efficiencies to exceed 25%."
In terms of material types, N-type monocrystalline silicon is gradually replacing traditional P-type silicon. Because P-type silicon is doped with boron, it is prone to forming boron-oxygen complexes during the initial light exposure, resulting in about 1.5% light-induced degradation. N-type silicon, doped with phosphorus, fundamentally eliminates this issue, keeping first-year degradation below 1%. However, the cost of this high-performance hardware is extreme purification energy consumption; producing 1 kg of such high-purity silicon requires approximately 55 kWh of electricity. This high dependence on electricity and the precise processing of rare minerals constitute the technical background of the non-renewable attributes of PV hardware.
To collect and export photo-generated electrons, precise and complex metal electrodes must be printed on the silicon wafer surface. Currently, monocrystalline silicon cells generally use silver paste as the primary material for front and rear electrodes. Each 182 mm specification cell consumes approximately 80 mg to 110 mg of silver. Given the hundreds of gigawatts installed globally each year, the PV industry's annual demand for silver now accounts for about 12% of total global production.
To reduce costs and mitigate silver scarcity, hardware designs have introduced Super Multi-Busbar (SMBB) technology, increasing the number of busbars from the traditional 5 to 16 or even 20. This fine-line design not only shortens the current transmission path on fingers—reducing internal resistance loss by about 0.2 W—but also minimizes shading on the silicon wafer, improving overall conversion efficiency by about 0.15%.
"By adopting copper plating technology to replace printed silver paste, laboratories have achieved a reduction in metal cost per watt of over 30% while maintaining a current collection efficiency as high as 98.5%."
In addition to silver, copper and tin are used extensively in module backings and connections. The interconnect ribbons used to join cells are typically tinned copper strips, with high-purity oxygen-free copper as the base material and a 15–20 micron layer of tin-lead or tin-silver alloy on the surface to ensure welding reliability and conductivity. This combination of metallic hardware provides 25 years of stable power but also faces complex recycling challenges. Over 20 years of outdoor operation, the increase in oxidation resistance at metal interfaces must not exceed 5 mΩ; otherwise, severe localized heating or module burnout may occur.
To protect fragile silicon wafers from rain, hail, and wind-blown sand, PV hardware is equipped with a multi-layer protective structure. The outermost layer is usually 3.2 mm or 2.0 mm thick high-transmittance tempered glass. The iron content of this glass must be below 120 ppm, and its surface is covered with an Anti-Reflective (AR) coating that reduces light reflectance from 8% to below 2%, allowing more photons to enter the cell.
For the back, bifacial modules use tempered glass of the same thickness for symmetrical encapsulation, while monofacial modules use polymer composite backsheets like TPT or KPE. These backsheet materials must have extremely high water vapor barrier rates, requiring a transmission rate below 0.1 g/m² per day to prevent electrochemical corrosion of internal metal parts.
"High-performance encapsulation materials such as POE film, compared to traditional EVA film, perform excellently in blocking water vapor and resisting Potential-Induced Degradation, reducing PID power loss from 5% to below 0.5%."
The films (EVA or POE) used in the encapsulation process complete cross-linking in a vacuum laminator at 145°C. The degree of cross-linking must reach between 75% and 85% to ensure the cells are firmly suspended between the glass and the backsheet. While this chemical encapsulation greatly extends hardware life, it complicates material separation after disposal. Currently, these polymer films are removed via pyrolysis at temperatures above 600°C after physical crushing to recover the glass and metal, a process whose secondary energy input is a key consideration in assessing life-cycle renewability.
The physical support for PV modules is provided by 6063-T5 grade aluminum alloy frames. Frame thickness is typically between 30 mm and 40 mm, with the surface anodized to an oxide film thickness of over 15 microns to resist long-term salt spray and acid rain corrosion.
The toughness of the aluminum ensures the module can withstand a positive snow load of 5,400 Pa and a rear wind load of 2,400 Pa. However, aluminum production is a high-energy, high-pollution electrolytic process, with 1 ton of primary aluminum emitting approximately 12 to 14 tons of CO2. The strength of this metal architecture directly determines plant safety, but in the waste stage, separating the aluminum frame from the tightly bonded silicone sealant is a detail currently being addressed by automated recycling equipment.
"The junction box, acting as the electrical outlet for the hardware system, must reach the highest protection rating of IP68. Its three integrated bypass diodes can handle instantaneous currents of over 25 amps during partial shading."
The busbars inside the junction box are made of red copper, with contact resistance controlled below 1 mΩ. The accompanying specialized PV DC cables (usually 4 mm² or 6 mm²) use dual-layer cross-linked polyethylene insulation, with a design life synchronized to the module at 25 years. The copper core purity of these cables is as high as 99.95%, and the DC resistance per kilometer must be below 5 Ω. Every connector (such as the MC4 type) is required to have a tensile strength of over 20 kg and extremely low insertion/extraction loss. These seemingly small hardware details collectively form a precision generator set capable of continuous operation in extreme environments.
Beyond the modules themselves, PV system operation requires power compensation hardware such as inverters. Inverters use a large number of power semiconductor devices, such as Insulated Gate Bipolar Transistors (IGBTs), with switching frequencies typically between 10 kHz and 20 kHz.
The maximum conversion efficiency of modern string inverters has reached 98.8%, and the static efficiency of Maximum Power Point Tracking (MPPT) is as high as 99.9%. To achieve this extreme conversion, internal film capacitors and magnetic modules (inductors) are used, containing polypropylene film, oxygen-free copper coils, and high-permeability ferrite materials.
"As the skeleton of PV hardware, the mounting system uses hot-dip galvanized steel with a zinc layer thickness of over 65 microns to ensure that no structural corrosion occurs in the soil for 25 years."
Mounting systems must not only be stable but also possess angle adjustment or automatic tracking capabilities. Single-axis tracking systems use high-precision slewing drives and tilt sensors, controlled by algorithms to ensure modules are always facing the sun, which can increase annual peak sun hours per unit of hardware by 150 to 300 hours. Although these auxiliary hardware modules increase the initial system cost by about 10%, they significantly lower the energy consumption per kilowatt-hour by increasing total power generation.
EPBT
Energy Payback Time (EPBT) defines how long a photovoltaic system must run to generate an amount of electricity equal to the total energy consumed during its lifecycle. This covers all energy consumption from mining, high-purity silicon refining, module encapsulation, and transportation to power plant construction. According to data from the International Energy Agency (IEA) and multiple Life Cycle Assessments (LCA), the average EPBT for mainstream monocrystalline silicon systems has shortened from 3.5 years a decade ago to between 0.7 and 1.4 years today.
Over a rated design life of 25 to 30 years, a PV system spends more than 95% of its time providing pure energy increments to the planet. If a system's operating cycle is 30 years, its Energy Return on Investment (EROI) can typically reach 20 to 35 times. In contrast, traditional coal or gas-fired power systems have an EPBT that is effectively infinite, as they require a continuous input of chemical fuel during operation and can never achieve energy self-sufficiency.
The manufacturing stage is the most energy-intensive phase, especially the Siemens process for polysilicon purification. Producing 1 kg of electronic-grade polysilicon with a purity of 99.9999999% requires an average of 50 to 80 kWh of electricity. With the trend toward larger wafers, the thickness of 182 mm and 210 mm wafers has decreased from 170 microns to 130 microns, reducing the silicon material required per watt from 2.5 grams to approximately 1.8 grams, directly lowering front-end energy costs by 28%.
Beyond silicon wafers, auxiliary materials for PV modules also carry significant energy weight. A standard 580W module contains about 22 kg of 3.2 mm thick tempered glass, with a manufacturing energy intensity of about 15 MJ/kg. Aluminum alloy frames are even more energy-intensive; producing 1 ton of primary aluminum requires about 13,500 kWh of electricity.
The industry is currently increasing the proportion of recycled aluminum (recycled aluminum energy consumption is only 5% of primary aluminum) and developing frameless bifacial modules, causing the comprehensive manufacturing energy intensity per watt to drop from 1.2 kWh to below 0.8 kWh.
Stage | Energy Share | Specific Parameter/Detail |
Silicon Purification | 45% - 55% | 9N purity, 50-80 kWh/kg |
Wafer Cutting | 10% - 15% | 130 μm thickness, diamond wire cutting |
Glass Manufacturing | 10% - 12% | 3.2mm tempered, 91.5% transmittance |
Frame Extrusion | 15% - 20% | 18-22 kg/module, high-energy primary Al |
Cell Encapsulation | 5% - 8% | Stringing, lamination, and vacuum energy |
EPBT is not a fixed value; it highly depends on the geographical latitude of the power plant and the local irradiance intensity. In arid desert regions where total annual irradiance reaches 2,200 kWh/m², a 100 MW plant using single-axis tracking can shorten its EPBT to 0.65 years. Conversely, in high-latitude rainy regions with only 1,000 kWh/m² annual irradiance, the same system might require 1.5 to 1.8 years to complete its energy offset.
Energy input for the Balance of System (BOS), such as inverters and brackets, also cannot be ignored. Constructing a 1 MW ground-mounted power plant typically requires 40 to 60 tons of steel and about 5 kilometers of various cables. The galvanizing process for brackets and the concrete pouring for foundations (a carbon footprint of about 200 kg per cubic meter of concrete) both increase initial energy expenditure. However, as module conversion efficiency has increased from 18% to over 23%, the output power for the same land area has increased by more than 25%, effectively diluting the energy input per watt and keeping the global average EPBT decline rate at 3% to 5% annually.
The evolution of technical routes directly optimizes the energy repayment speed. Because N-type TOPCon cells have better low-light response and a lower temperature coefficient (-0.29%/°C), their annual power generation in actual environments is 3% to 5% higher than P-type modules of equal capacity.
Systems using TOPCon technology can enter the net energy production phase approximately 45 days earlier. While heterojunction (HJT) cells have fewer processing steps (4–6 steps compared to 12–14 for TOPCon) and a low-temperature process (below 200°C) that significantly reduces thermal energy consumption, their currently high silver paste consumption (about 150 mg per wafer) remains a variable energy expenditure.
Reducing system losses is also key to shortening EPBT. Modern plants using 1500V high-voltage systems can reduce cable usage by about 40% and line ohmic losses by 3% compared to 1000V systems. The precision of MPPT in inverters has now reached over 99.9%, ensuring the system captures maximum energy flow even under cloud cover or shading interference. These percentage-level improvements accumulate to allow a plant to produce millions of additional kilowatt-hours over a 30-year lifecycle, further diluting initial energy costs.
The power output of a PV module after 25 years of operation can typically still be maintained at over 85% of its rated power. If advanced recycling technologies can physically repair or chemically repurpose silicon wafers from decommissioned modules, over 70% of initial production energy can be saved. Currently, some recycling stations in Europe and North America have achieved recovery rates of 95% for aluminum and glass and 90% for silver.
By reintegrating these recycled materials into the production chain, the EPBT of next-generation modules could fall below 0.5 years.