How Many Solar Panels Does It Take to Charge a 12 Volt Cell
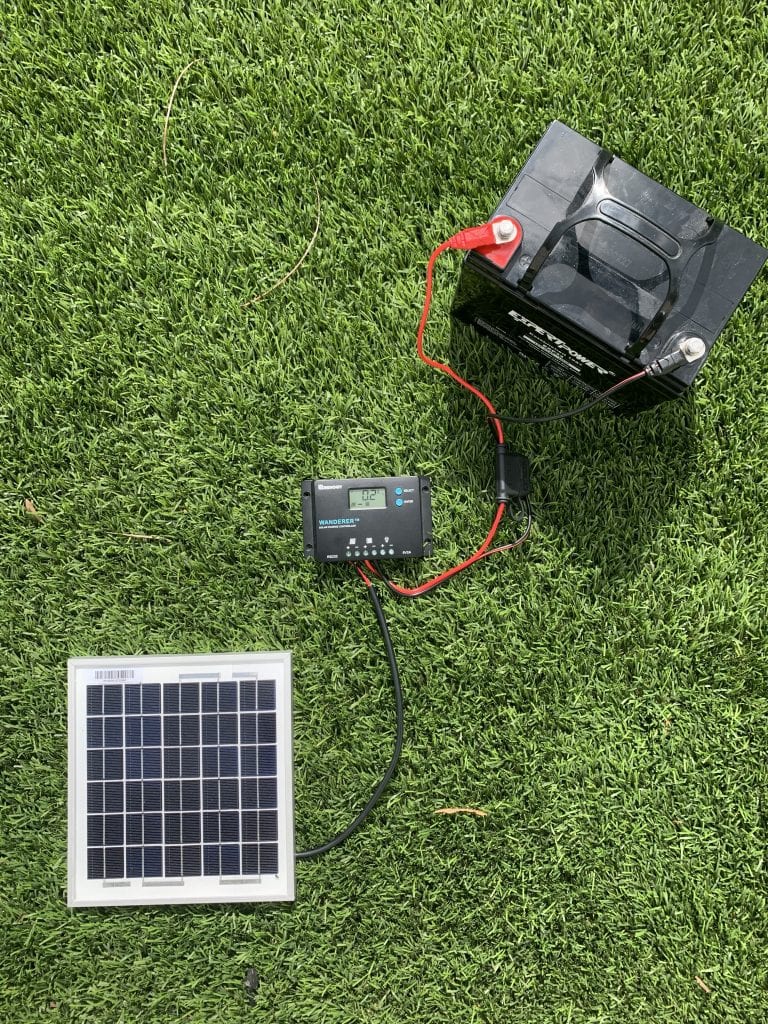
Charging a 12V 60Ah cell usually requires one 100-watt panel, taking about 8 hours to fully charge under strong light with a controller.
The panel output voltage must reach 18V. When installing, you must follow the order of "connect the cell first, then the panel" to ensure the controller correctly identifies the system voltage.
The Golden Formula
Energy Conversion
A standard 12-volt 100-amp-hour (Ah) lead-acid cell nominally contains 1200 watt-hours (Wh) of total energy.
However, based on lead-acid chemistry characteristics, to prevent irreversible sulfation of the plates, you can only use 50% of this energy, which is 600 Wh.
If you use a Lithium Iron Phosphate (LiFePO4) cell, also rated at 12V 100Ah, its depth of discharge allows for 90% or even 95%.
The energy gap you need to fill is as high as 1,080 Wh to 1140 Wh.
Suppose your electrical load is a car refrigerator with a power of 60 watts, plus lighting equipment consuming 10 watts per hour.
Running for 10 hours a day, the total energy consumption is 700 Wh.
To fill this 700 Wh vacancy, you cannot simply generate 700 Wh of electricity.
Because the charging efficiency of lead-acid batteries is only 85%, you need to input about 824 Wh of energy into the cell to actually store 700 Wh.
Loss Factors
Every connection point in a photovoltaic system is "stealing" energy. You must add a system loss multiplier of 1.3 to 1.5 into your calculation formula.
The standard test environment for solar panels is 25 degrees Celsius.
However, outdoors in summer, for every 1 degree Celsius increase in panel surface temperature, the output power drops by 0.35% to 0.45%.
When the panel temperature reaches 65 degrees Celsius, a 100-watt panel instantly loses 14 to 18 watts of power.
PWM charge controllers regulate voltage via "chopping." Their average conversion efficiency is only between 70% and 80%.
If you input 100 watts of power, only 75 watts will reach the cell end after passing through the controller.
Even with a high-end MPPT controller, although the nominal efficiency is 98%, adding the 2% to 3% voltage drop generated by 4mm² copper wires over a distance of 5 meters, the overall system efficiency rarely exceeds 85%.
Therefore, the safest calculation method is to divide your target power by 0.7. For example, if you need 600 Wh into the cell, the solar panel end must actually generate 857 Wh of raw power.
Sunlight Window
In high-radiation areas like the southern United States or Australia, the annual average peak sunshine can reach five hours.
However, in areas above latitude 45 degrees or cloudy regions, the average peak sunshine is only 3 to 3.5 hours.
In winter, the solar altitude angle is lower than 45 degrees, and the increase in air mass causes light attenuation.
The radiation received by a flat-laid solar panel will be reduced by 40% to 60% compared to summer.
We must use the most conservative winter or average values for calculation.
Assuming the average peak sunshine in your area is 4 hours, you must generate the previously calculated 857 Wh of raw power through the solar panels within these 4 hours.
If you encounter three consecutive rainy days, the light intensity drops to 100 to 200 watts per square meter, and power generation will directly shrink by 80% to 90%.
At this time, if you do not increase cell reserves or the number of panels, the system will collapse.
Matching Power
Dividing the total required power generation of 857 Wh by the daily effective 4 hours of peak sunshine gives a required total photovoltaic array power of 214.25 watts.
It is difficult to buy a single 214-watt module on the market, so you need to choose a plan that rounds up the specifications, such as two 120-watt panels connected in parallel, bringing the total power to 240 watts.
Or simply buy a large-size household module of 250 watts or 300 watts. Although the size may reach 1640 mm by 992 mm, this provides about 15% to 30% power redundancy.
With a 300-watt solar panel, theoretically capable of producing 1,200 Wh under four hours of light, after deducting 30% system heat loss and line loss, it can net charge 840 Wh per day, covering the previously calculated 700 Wh load plus cell self-discharge loss.
If you pursue extreme reliability, following the off-grid principle of "three days without sunshine," both your solar panel power and cell capacity need to be expanded by 3 times, meaning installing 900 watts of solar panels to cope with extreme weather.
Current Limits
For a 240-watt solar panel system, at a charging voltage of 14.4 volts, the maximum current is approximately 16.6 amps.
For a 100Ah lead-acid cell, the recommended optimal charging current is 0.1C to 0.2C, which is 10 amps to 20 amps. 16.6 amps falls exactly within this healthy range and will not cause the electrolyte to overheat or generate excessive gas.
But if you install a 600-watt solar panel for fast charging, the peak current will reach 41.6 amps.
This exceeds the endurance limit of a 100Ah lead-acid cell, causing internal plate bending or shedding of active material, plummeting the lifespan from 800 cycles to 200 cycles.
If it is a 100Ah Lithium Iron Phosphate cell, it typically supports a charging current of 0.5C, i.e., 50 amps.
In this case, a 600-watt solar panel configuration is safe and efficient, compressing the charging time from 4 hours to about 1.5 hours.
Voltage Matching
For a single 12-volt system solar panel, the open-circuit voltage (Voc) is usually between 21 volts and 24 volts, and the operating voltage (Vmp) is between 17 volts and 19 volts.
If you connect two 100-watt panels in series, the operating voltage will double to 36 volts.
At this time, you must use an MPPT controller to convert the high voltage into low voltage and high current; otherwise, a PWM controller will directly cut off all voltage above 14.4 volts, causing 50% of the power to be wasted in vain.
In parallel mode, the voltage of the two panels remains unchanged at 18 volts, and the current superimposes. This places demands on the wire diameter.
A current of 20 amps on a 5-meter-long line requires at least 4 mm² or even 6 mm² cables; otherwise, the voltage will drop by 0.5 to 1 volt on the line, causing the cell to never be fully charged.
Practical Scenarios
Lightweight Camping
The combined cell capacity of two mobile phones is about 30 Wh to 40 Wh. An LED light strip consumes 5 watts per hour; calculating for 6 hours of use per night, it consumes 30 Wh. Adding 15 Wh for a speaker, your total daily electricity consumption is between 85 Wh and 100 Wh.
For this demand, bringing a foldable 60-watt solar panel is the most economical choice. The folded size is only 40 cm by 40 cm, and the weight does not exceed 2.5 kg.
During the golden lighting period of four hours from 10 am to 2 pm, this panel can stably output about 35 to 45 watts of power, generating a total of about 160 Wh of electricity.
Even after deducting the 25% loss of the PWM controller, the remaining 120 Wh of electricity is enough to fully charge a small 12V 20Ah Lithium Iron Phosphate cell (total capacity 256 Wh) from a deficit state within two days, or easily maintain your daily consumption.
This lightweight solution must pay attention to the voltage drop problem. The included cables are usually only 18 AWG or even 20 AWG. When the length exceeds 3 meters, the 18-volt voltage transmitted to the cell end may drop below 13 volts, causing charging efficiency to plummet. It is recommended to replace the original cable with a 14 AWG pure copper wire, or keep the wire length within 2 meters.
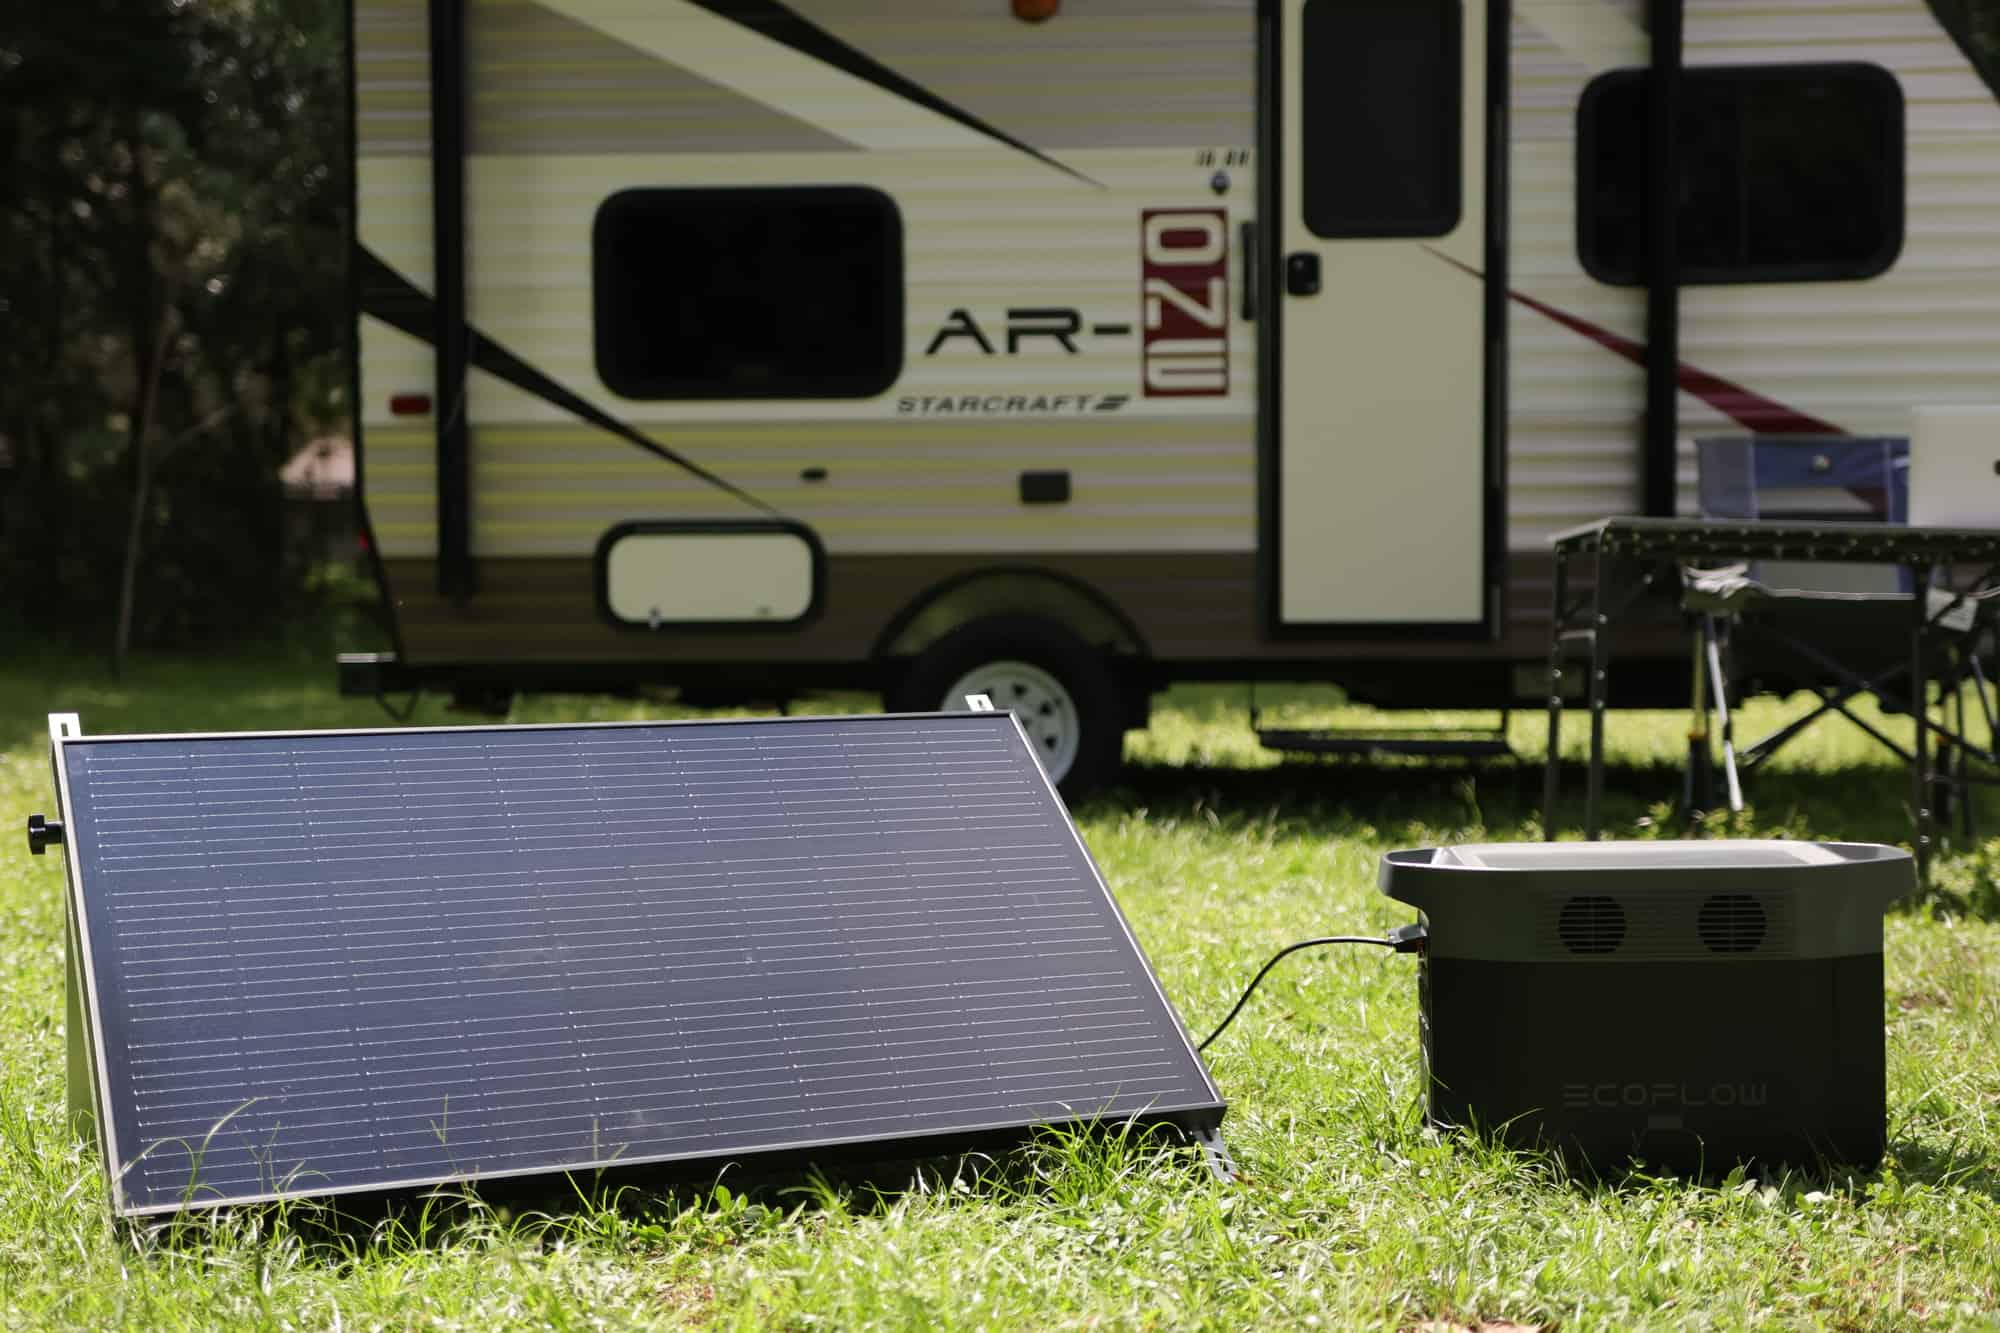
RV Life
For RV users living on the road for a long time, the biggest electricity consumer is a 45-watt to 60-watt compressor refrigerator.
Adding ventilation fans, water pumps, and laptop charging, the average daily energy consumption is usually between 1,200 Wh and 1500 Wh.
To support this consumption, you need to build a system consisting of a lithium cell bank with a capacity of 400 Wh to 600 Wh, which means a 12V 300Ah to 400Ah Lithium Iron Phosphate cell bank.
To fill this "large reservoir," the roof needs to be installed with at least three 100-watt monocrystalline rigid panels, or two 175-watt large-size modules, reaching a total power of 300 watts to 400 watts.
Under good summer sunshine conditions, a 400-watt array can produce 1600 Wh to 2000 Wh of electricity per day.
After deducting the 1,080 Wh consumed by the refrigerator running 24 hours, you still have a surplus of 500 Wh to 900 Wh for cooking or boiling water.
If the roof space is limited and only 300 watts of solar panels can be installed, you must pair it with the highest efficiency MPPT controller.
Compared with PWM, MPPT can squeeze out an extra 15% to 20% of power when the panel temperature rises to 60 degrees Celsius.
Especially on cloudy days, a 300-watt panel may only have an output of 30 watts.
MPPT can ensure that this weak current is charged into the cell by stepping down the voltage and boosting the current, rather than being cut off due to insufficient voltage.
Marine Use
Masts and rigging on a boat can cast shadows on solar panels at any time. If connected in the traditional series connection, if 10% of the area of one panel is shaded, the current of the entire array will drop by 90%.
Therefore, marine systems must use parallel connections or use panels with independent bypass diodes.
Assuming your marine service cell is a 12V 200Ah deep-cycle gel cell, mainly powering the autopilot (3 amps), chart plotter (1.5 amps), and refrigerator (4 amps), the basic consumption for 24 hours is around 100 Ah, which is 1,200 Wh.
Due to the high reflectivity of the sea surface, lighting conditions are usually better than on land. Installing two 150-watt semi-flexible solar panels (ETFE material) is the best solution.
Although the flexible panel weighs only 3 kg and can be glued directly to the curved surface of the deck, heat dissipation is extremely poor. At noon in summer, the deck temperature may exceed 70 degrees Celsius, causing power generation efficiency to drop by more than 25%. To alleviate this problem, hollow polycarbonate sheets can be used as a cushion layer during installation to leave an air circulation layer of 5mm to 10mm. This can reduce the panel temperature by 10 to 15 degrees and recover 150 Wh of electricity per day.
Off-Grid Cabin
Suppose you need to drive a 1000-watt microwave oven (accumulated use of 20 minutes per day), a TV (100 watts, used for 4 hours), lighting (50 watts, 6 hours), and Starlink network equipment (average 60 watts, 24 hours). The total daily energy consumption will reach about 2,500 Wh.
Considering that there may be a continuous week of rain and snow in winter, the cell reserve must support three days without power generation.
You need a massive cell bank of 12V 800Ah (about 10 kWh).
You need to install a solar array of at least 1200 watts, such as four 300-watt large modules.
In winter, the bracket angle must be adjusted to the local latitude plus 15 degrees to capture low-angle sunlight vertically. This 1200-watt array can generate more than 5,000 Wh of electricity per day in summer.
Even if there are only three hours of effective sunshine in winter, it can generate 2,500 Wh to 3000 Wh, barely maintaining a break-even balance.
All cables must be upgraded to 2AWG (35mm²) or even 0AWG to carry charging currents that may exceed 80 amps, and a 100-amp ANL fuse must be installed between the controller and the cell to prevent short circuits from causing fires.
Crucial Module
Which Heart to Choose
For standard 12-volt solar panels, the maximum power point voltage is usually between 17.5 volts and 18.5 volts, while the charging voltage range of a 12-volt lead-acid cell is only 10.8 volts to 14.4 volts.
If you connect the panel directly to the cell, the cell will forcibly pull the panel's voltage down to its current voltage level, such as 12.5 volts.
According to the physical law that power equals voltage multiplied by current, a panel nominally rated at 100 watts (18 volts multiplied by 5.55 amps), when pulled down to 12.5 volts, retains the current at 5.55 amps, and the actual output power instantly becomes 69.4 watts.
You haven't even started using electricity, and you have already lost 30.6 watts, equivalent to 30% of your investment going down the drain.
Currently, the "hearts" on the market are divided into two types: PWM (Pulse Width Modulation) and MPPT (Maximum Power Point Tracking).
The PWM controller is essentially a fast switch. It simulates voltage reduction by cutting off and reconnecting thousands of times per second. The efficiency is extremely low, usually retaining only 70% to 80% of the energy.
If you only have one panel under 100 watts and the budget is extremely tight, a PWM costing a few dozen bucks is barely usable.
But if your system exceeds 200 watts, you must use an MPPT controller. The MPPT contains a DC-DC step-down converter inside, which can "exchange" the excess voltage of the panel (18 volts minus 12.5 volts equals 5.5 volts) for extra current.
With the same 100-watt panel, MPPT can convert it to 12.5 volts multiplied by 7.8 amps, outputting 97.5 watts of power.
For a 400-watt system, using MPPT can generate 300 Wh to 400 Wh more electricity per day than PWM, which is equivalent to getting an extra 80-watt solar panel for free.
Sizing Amperage
The most conservative way to calculate current is to divide the total wattage of the solar panels by the system's lowest operating voltage, usually taking 10.5 volts or 11 volts instead of 12 volts, because when the cell is in a deficit, the voltage is lower and the current is actually higher.
Suppose you install 300 watts of solar panels; 300 watts divided by 10.5 volts equals 28.57 amps.
Electronic products cannot run at full load for a long time. A 25% safety margin must be left, i.e., 28.57 multiplied by 1.25 equals 35.7 amps.
There is no 35.7-amp specification on the market, so you need to buy a 40-amp controller.
If you only bought a 30-amp controller, during the 15 minutes when the sun is strongest at noon, the controller will start self-protection due to overheating and forcibly limit power output, causing the electricity you could have generated to be wasted, or even causing the internal MOS tubes of the controller to break down and burn.
Besides current, the maximum input voltage (Voc limit) is often overlooked. MPPT controllers are usually marked with voltage limits of 75V, 100V, or 150V.
If, in order to reduce line loss, you connect three panels with an open-circuit voltage of 22 volts in series, the total voltage will reach 66 volts.
It looks lower than the 75 V limit, but in the early morning of winter at minus 20 degrees, the physical properties of silicon crystals will cause the voltage to rise by 10% to 15%.
66 volts will instantly become 73 volts or even 76 volts, which can easily break down capacitors rated for 75V.
Therefore, for a 3-series connection, a controller with a 100V withstand voltage rating must be selected; for a 4-series connection (88 volts), you must go up to the 150V tier.
Never let your panel series voltage exceed 85% of the controller's nominal value; this is an iron rule.
Don't Skimp on Cables
12-volt systems are extremely sensitive to voltage. A voltage drop of 0.5 volts on the line means a 4% energy loss.
More seriously, this will cause the controller to misjudge the cell voltage.
For example, the actual cell voltage is only 13.8 volts (not full), but because the wire is too thin, the controller end detects 14.4 volts (because a higher voltage is needed to push the current through), so the controller cuts off charging prematurely.
This leads to the cell never being fully charged and remaining below 90% charge for a long time, which will cause the lead-acid cell to sulfate and be scrapped within six months.
For the common 40-amp charging current, if the wire length is 1 meter, at least 8 AWG (8.3 mm²) copper wire is required; if the wire length is extended to 3 meters, it must be upgraded to 6 AWG (13.3 mm²) or even 4 AWG (21.2 mm²).
Never use ordinary car audio wires or aluminum wires as substitutes. Multi-strand tinned copper wires must be used to prevent oxidation in humid environments, which leads to increased resistance.
All wiring terminals must be cold-pressed with hydraulic pliers. You cannot just pinch them with regular pliers.
Loose interfaces will heat up to over 100 degrees Celsius under high current, melting the insulation and even causing a fire.
Charging Current (Amps) | Rec. Wire Gauge @ 1m (AWG/mm²) | Rec. Wire Gauge @ 2m (AWG/mm²) | Rec. Wire Gauge @ 3m (AWG/mm²) | Rec. Wire Gauge @ 5m (AWG/mm²) |
10A | 14 AWG (2.0 mm²) | 12 AWG (3.3 mm²) | 10 AWG (5.3 mm²) | 8 AWG (8.3 mm²) |
20A | 12 AWG (3.3 mm²) | 10 AWG (5.3 mm²) | 8 AWG (8.3 mm²) | 6 AWG (13.3 mm²) |
30A | 10 AWG (5.3 mm²) | 8 AWG (8.3 mm²) | 6 AWG (13.3 mm²) | 4 AWG (21.2 mm²) |
40A | 8 AWG (8.3 mm²) | 6 AWG (13.3 mm²) | 4 AWG (21.2 mm²) | 2 AWG (33.6 mm²) |
50A | 6 AWG (13.3 mm²) | 4 AWG (21.2 mm²) | 2 AWG (33.6 mm²) | 1/0 AWG (53.5 mm²) |
60A | 6 AWG (13.3 mm²) | 4 AWG (21.2 mm²) | 2 AWG (33.6 mm²) | 1/0 AWG (53.5 mm²) |
Temperature Compensation
The chemical reaction speed of the cell is hugely affected by temperature. The standard charging voltage (e.g., 14.4 volts) is set based on 25 degrees Celsius.
When the ambient temperature drops to 0 degrees Celsius, the internal resistance of the cell increases, and a higher voltage (about 14.9 volts) is needed to charge electricity in;
When the temperature rises to 40 degrees Celsius, the cell loses water easily, and the charging voltage must be reduced to 13.9 volts.
If your controller does not have a temperature sensor (RTS), it will charge at 14.4 volts in winter, resulting in the cell not being fully charged;
In summer, it will still charge at 14.4 volts, causing the cell to overcharge and bulge.
High-quality MPPT controllers usually come with a temperature probe.
You must stick it on the cell case, not place it next to the controller, because the self-heating of the controller during operation will mislead the sensor.
Data shows that a system with temperature compensation functions can extend the service life of lead-acid batteries by 30% to 50%.
Especially in areas where the temperature difference between day and night exceeds 15 degrees Celsius, the role of this small accessory is greater than adding an extra solar panel.