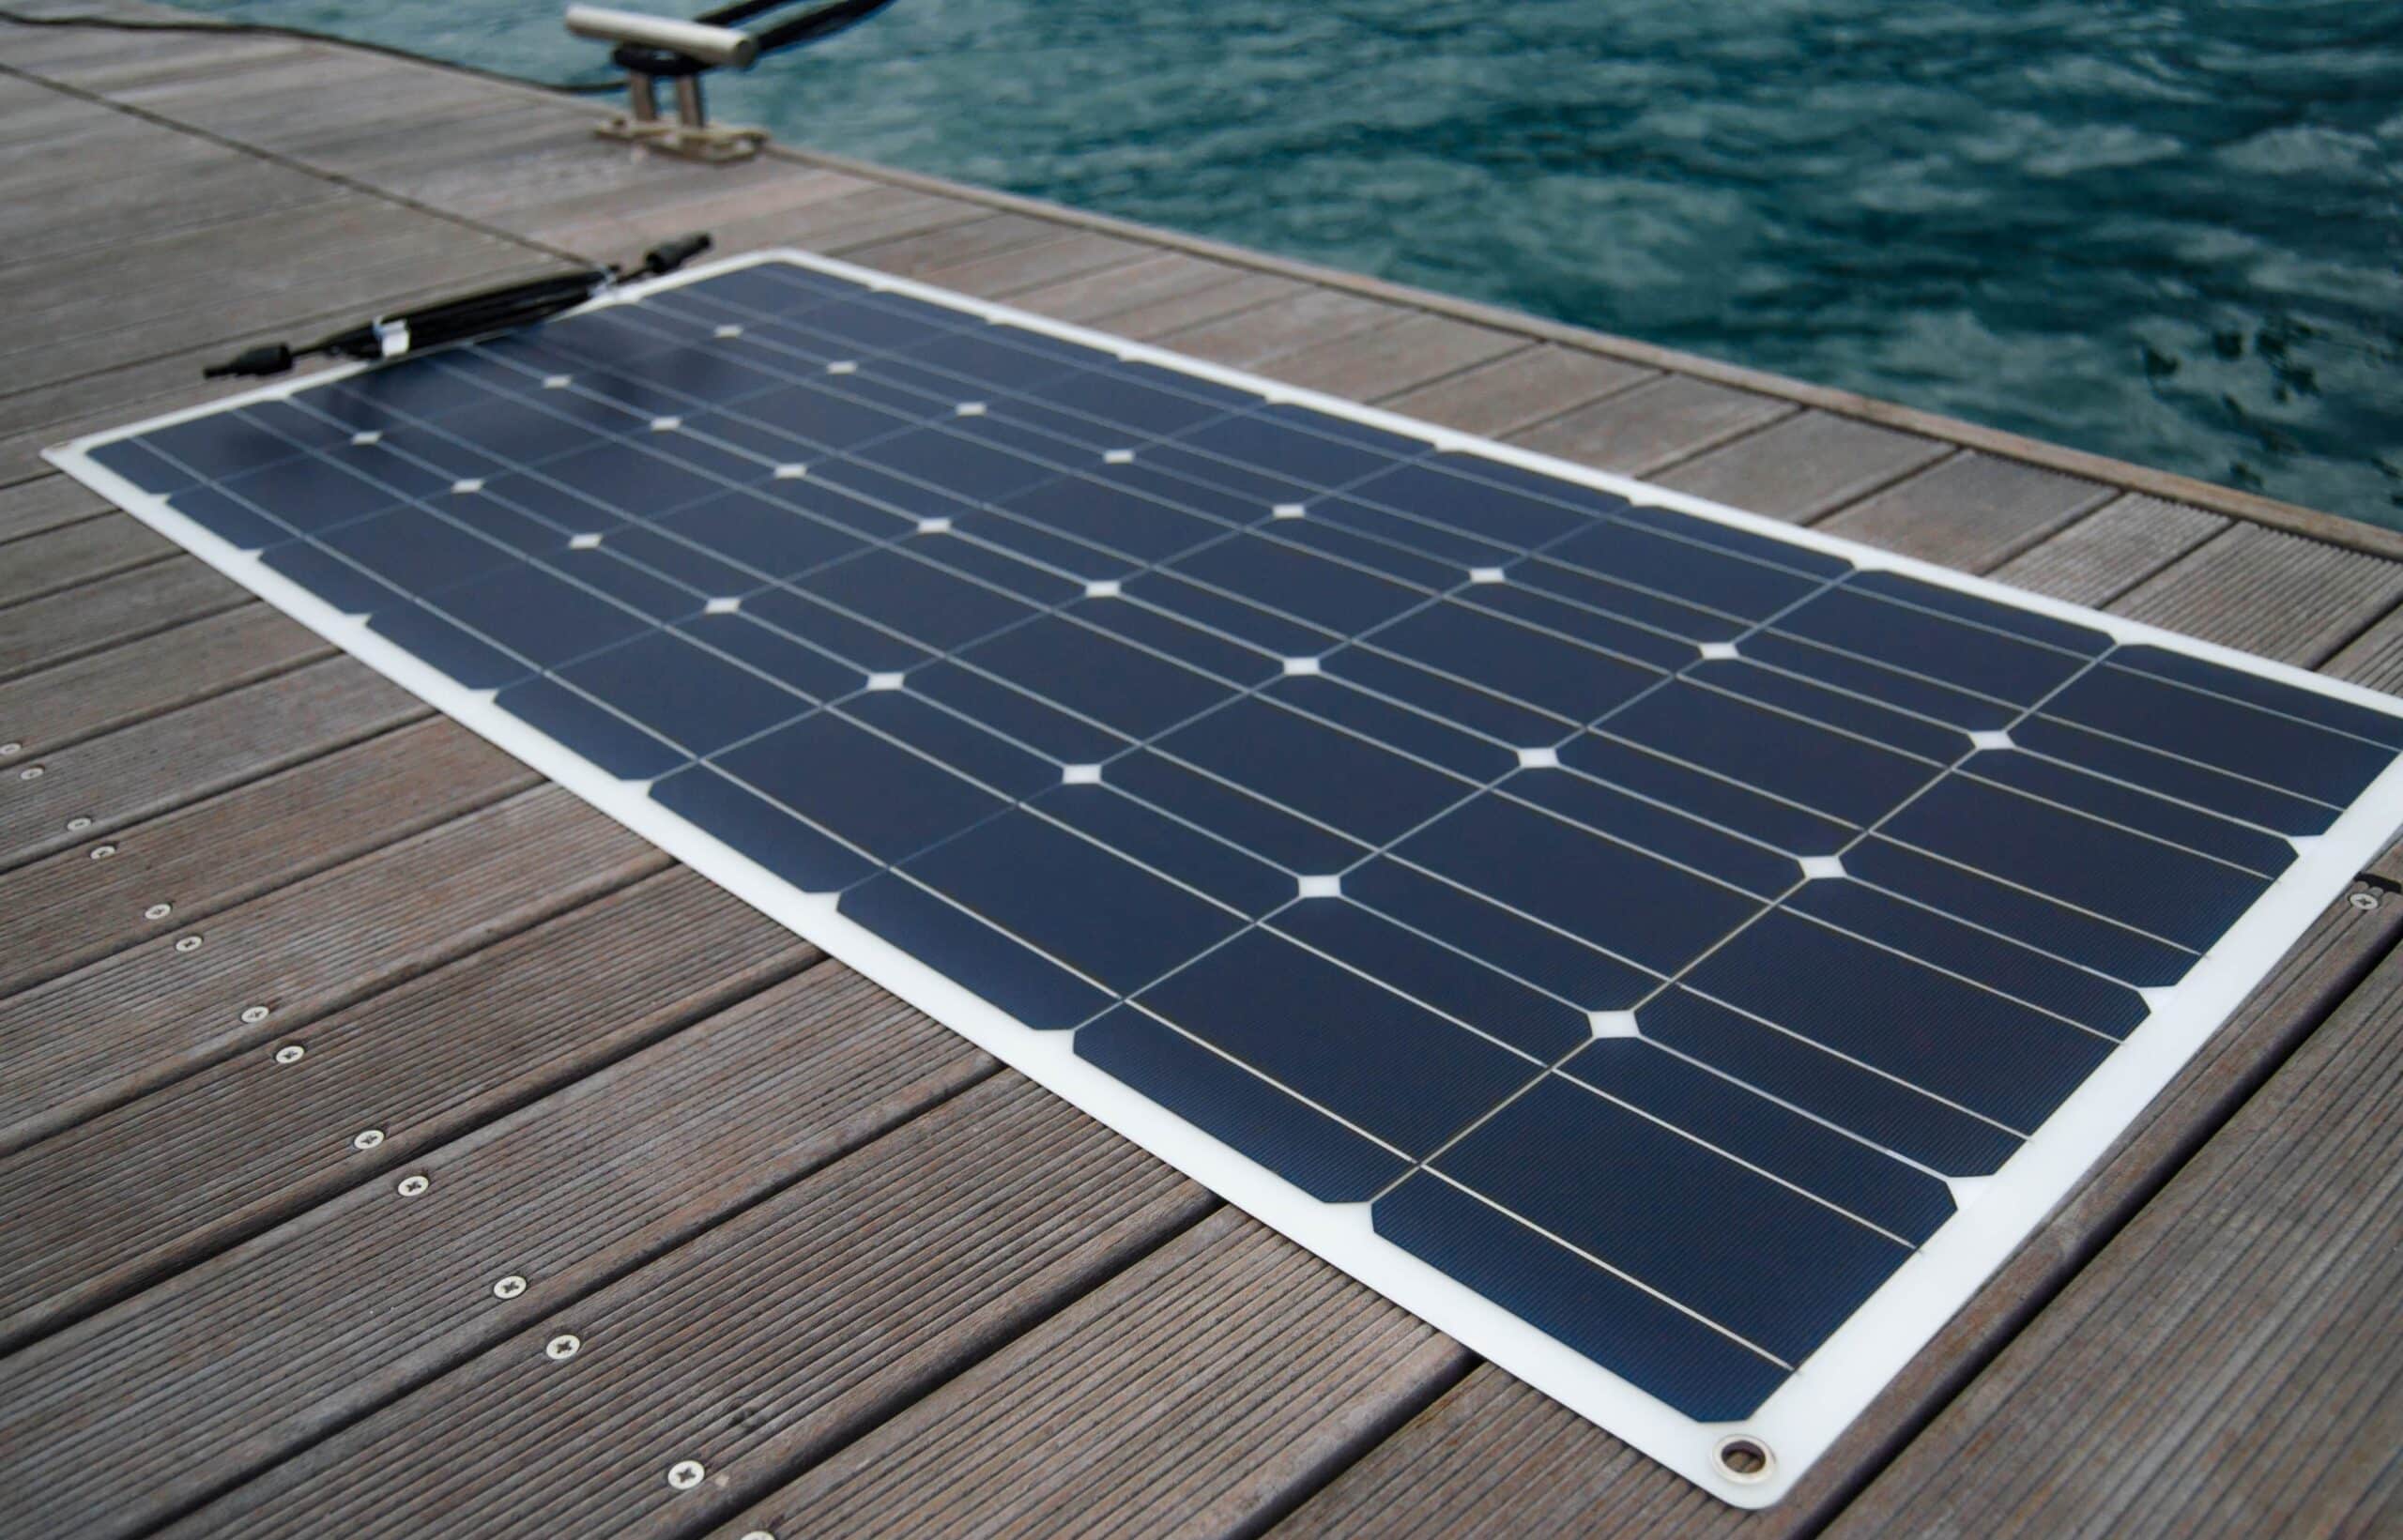
Poly Solar Modules | Ultimate Guide to Efficiency, Lifespan
Polycrystalline modules are a cost-effective choice. Their conversion efficiency is typically in the 17-18% range, slightly lower than monocrystalline, but their price is about 10-20% lower.
Their lifespan can also exceed 25 years, with an initial degradation rate of about 2% in the first year, and an annual degradation rate of about 0.6% thereafter.
Efficiency
The efficiency of a photovoltaic module is a core indicator of its ability to convert sunlight into electricity, usually expressed as a percentage.
Under Standard Test Conditions, a module with 22.5% efficiency converts 225W of the 1000W of solar energy received per square meter into usable electricity.
Definition of Efficiency
Core Calculation:
The formula for calculating efficiency is the cornerstone of understanding it:
Efficiency (%) = (Module's Maximum Output Power ÷ Module's Area) ÷ 1000 W/m² × 100%
Each part of this formula has a clear physical meaning:
l Module's Maximum Output Power: This refers to the maximum power a module can produce under ideal laboratory conditions, measured in Watts. Common examples are 420W, 550W, etc.
l Module's Area: Refers to the total area of the module exposed to sunlight, measured in square meters.
l 1000 W/m²: This is the standard solar irradiance defined by Standard Test Conditions, equivalent to the light intensity of a very sunny ideal noon.
An example will make it clearer:
A module with an area of 2.5 square meters has a nameplate maximum power of 500W.
Its efficiency is calculated as follows:
(500W ÷ 2.5 m²) = 200 W/m². This means it generates 200 watts per square meter.
Then, 200 W/m² ÷ 1000 W/m² = 0.20.
Therefore, the efficiency of this module is 20%.
Under standard sunlight, 200 watts of solar energy per square meter of module area are converted into electricity, while the remaining 800 watts are mainly converted into heat or reflected away.
Standard Test Conditions:
To allow modules produced by all manufacturers to be compared on a level playing field, a unified "ruler" is used globally, namely the Standard Test Conditions:
l Irradiance: 1000 watts per square meter
l Cell Temperature: 25°C
l Solar Spectrum: AM 1.5
A key point often overlooked: "25°C" refers to the temperature of the solar cell itself, not the ambient air temperature.
In actual installation, the cell temperature under direct sunlight is much higher than the air temperature, potentially reaching 50°C or even 70°C, which is one of the main reasons why the actual output power of a module is lower than its rated power.
Efficiency vs. Power:
People often confuse "efficiency" and "power".
l Power answers the question "How much electricity can this panel generate?" – For example, a 550W module has a higher generation capacity than a 450W module.
l Efficiency answers the question "Which panel can generate more electricity for the same size?" – It measures the power generation capacity per unit area.
You can have two modules both rated at 450W, but they may be completely different sizes.
The smaller module must have higher efficiency because it achieves the same power output with a smaller area.
Differences in Efficiency
Efficiency Comparison of Different Technology Routes
The current mainstream technology routes and their efficiency ranges are compared below (based on 2024 industry mass production data):
Technology Type | Mass Production Average Efficiency Range | Technical Characteristics and Efficiency Impact Analysis |
PERC (P-type Mono) | 21.0% - 22.8% | Reduces electron recombination through rear-side passivation reflection technology, efficiency improvement is approaching the theoretical limit. |
TOPCon (N-type) | 22.8% - 24.5% | Uses tunnel oxide passivated contact, significantly reducing surface recombination, higher open-circuit voltage, efficiency potential is significantly better than PERC. |
HJT (N-type) | 23.8% - 25.2%+ | Amorphous silicon passivation layer provides extremely low surface recombination, high bifaciality, symmetrical structure offers better temperature coefficient, fewer process steps but cost-sensitive. |
IBC (N-type) | 24.5% - 26.0%+ | All electrodes are placed on the back of the cell, completely eliminating front grid line shading loss, achieving the highest front-side efficiency currently, but the process is the most complex and costly. |
These efficiency differences are directly reflected in the power per panel. Taking a typical 72-cell module as an example, the corresponding power ranges for different technologies are roughly:
l PERC modules: approx. 550W - 580W
l TOPCon modules: approx. 580W - 610W
l HJT modules: approx. 590W - 620W+
Nuances in Materials and Manufacturing Processes
Wafer Quality: N-type silicon wafers have far greater tolerance to metal impurities than P-type wafers. Cells made from N-type wafers have almost negligible initial light-induced degradation (0.5%), whereas the first-year degradation for P-type PERC cells is typically 1.5%-2%.
Grid Line Design: Multi-bus bar technology has become mainstream, evolving from early 5BB to current 12BB, 16BB, and even more. Finer and denser grid lines reduce the shading area on the cell surface while providing a shorter current transmission path, lowering series resistance, thereby improving module efficiency. For example, upgrading from 9BB to 16BB may bring about a 0.3% absolute efficiency gain.
Passivation and Anti-Reflection Technology: Advanced anti-reflection coatings can significantly reduce sunlight reflection losses. Meanwhile, excellent surface passivation quality (such as TOPCon's silicon oxide/polycrystalline silicon stack, HJT's intrinsic amorphous silicon layer) minimizes the chance of photogenerated carriers being "trapped" and lost at the surface.
Practical Impact of Environmental Factors on Efficiency Performance
Temperature Coefficient: This is a key parameter measuring how output power changes with temperature. For example:
· Typical P-type PERC module power temperature coefficient is about -0.34%/°C to -0.40%/°C.
· Typical N-type TOPCon/HJT module power temperature coefficient is better, about -0.25%/°C to -0.30%/°C.
· Actual Impact: When the module operating temperature reaches 45°C (a common summer condition), compared to the standard 25°C condition, the output power of P-type modules decreases by about 6.8%, while N-type modules decrease by only about 5%.
Shade Tolerance: Modern modules typically have built-in bypass diodes (usually one for every 24 or 36 cell strings) to mitigate shading effects.
Low-Light Performance: In early morning, evening, or cloudy weather, light intensity is below standard conditions. The startup voltage and current output capability of modules using different technologies vary slightly under these conditions. Typically, modules with lower series resistance and better spectral response characteristics (like HJT) have longer generation times under low light, producing a small amount of extra electricity daily.
Differences in Efficiency Degradation During Long-Term Operation
The degradation rate directly determines the total electricity generated by the module over its entire life cycle.
l Light-Induced Degradation (LID): P-type PERC modules typically experience 1.5%-2% power degradation in the first year, followed by an annual degradation of about 0.45%-0.55%. In contrast, N-type modules, due to their extremely low boron-oxygen content, generally have first-year degradation below 1%, and the subsequent annual degradation can be controlled at around 0.4%.
l Potential Induced Degradation (PID): Under high system voltage, ion migration can cause module power loss. Rigorous manufacturing processes and high-quality encapsulation materials are key to resisting PID. High-quality modules typically have power degradation controlled within 3% after PID testing (e.g., 85°C, 85% humidity, -1000V bias, 96 hours).
Efficiency Performance
How Temperature Changes Power Output
PV module output power decreases when it gets hot, a characteristic described by the temperature coefficient. For example, a module with a rated power of 550W:
l If its temperature coefficient is -0.35%/°C
l When the cell temperature rises from the standard 25°C condition to 45°C (a common summer temperature)
l The temperature difference is 20°C
l Power loss is 20 C × 0.35%/°C = 7%
l Actual output power is approximately 550W × (1 - 0.07) = 511.5W
Temperature coefficients vary significantly between technologies:
l P-type PERC modules: approx. -0.34%/°C to -0.40%/°C
l N-type TOPCon modules: approx. -0.29%/°C to -0.32%/°C
l HJT modules: approx. -0.24%/°C to -0.28%/°C
A study on PV systems in Arizona, USA, showed that in environments with high average annual operating temperatures, modules with superior temperature coefficients can generate 3%-5% more electricity than ordinary modules.
How Much Impact Does Partial Shading Have?
Modern modules are typically composed of 120 or 144 half-cut cells connected in series, divided into several parallel strings, each protected by a bypass diode.
When a cell is shaded, it changes from a power-generating unit to a resistor, hindering the current flow through the entire string.
l Without Shading: Current flows smoothly through the cell string, outputting 100% power.
l With Shading: The shaded cell heats up, and the current output of that string is limited by the darkest cell. At this point, the bypass diode activates, bypassing the entire affected string, but at the cost of losing all the generation capacity of that string.
For example, a module with 3 bypass diodes and 144 half-cut cells, if just one cell is completely shaded by a leaf, could cause about one-third of the module's generation capacity to fail.
Using a half-cut cell design can mitigate this effect, limiting the loss to a smaller unit.
Module Degradation Curve in Real-World Environments
Module efficiency slowly decreases over time; this degradation is not linear.
1. First Year: Initial light-induced degradation is most pronounced. P-type PERC modules typically degrade 1.5%-2% in the first year, while N-type technology, with its superior wafer quality, can control first-year degradation to below 1%, even around 0.5%.
2. Year 2 to Year 25: Enters the linear degradation period. P-type modules degrade about 0.45%-0.55% annually, N-type modules about 0.4%-0.45%.
3. At Year 25: The performance warranty provided by manufacturers typically promises an output power of no less than 84%-87% of the initial rated value, while high-quality N-type products can promise over 90%.
A module with an initial efficiency of 22% might have an efficiency of about 18.5% after 25 years (calculated at 0.55% annual degradation) or 19.8% (calculated at 0.4% annual degradation).
The stability of efficiency performance directly determines the total power generation revenue over decades.
Operating Status Under Different Weather Conditions
Module efficiency performance varies with weather:
l Sunny Weather: Irradiance is close to 1000W/m², the module operates near its maximum power point, but the temperature may be high, and actual power is usually lower than the rated value.
l Cloudy Weather: Irradiance may drop to 300-600W/m². Module output power decreases proportionally, but not all technologies perform the same. Some modules have a wider spectral response and lower startup voltage under low light, starting generation earlier in the morning and stopping later in the evening.
l Cold, Sunny Weather: Although sunshine hours are short, low temperatures increase the module's operating voltage, and efficiency may temporarily exceed the rated value. In snowy environments, ground-reflected light can also increase power generation from the module's rear side.
Efficiency Loss Due to System Matching
The actual performance of a module in a system is also affected by other modules:
l Inverter Matching: Inverters have an optimal operating voltage and current range. Improper string design may cause the inverter to operate outside its most efficient range for part of the time.
l Cable Losses: Using DC cables with too small a cross-section generates heat due to resistance, causing energy loss. DC-side cable losses should typically be controlled within 1%-2%.
l Dust Accumulation: Dust on the panel surface blocks light. Research shows that in dry, dusty areas, infrequent cleaning can lead to an average power generation loss of 10%-15%, which can temporarily recover to below 5% after rain.
Lifespan
The nominal service life of modern high-quality PV modules is typically 25 to 30 years, but this is not their final end-of-life age.
The key metric behind this is the power degradation rate, i.e., the rate at which output power decreases over time.
For example, N-type TOPCon modules can have a first-year degradation as low as 1%, followed by an annual degradation of only 0.4%, meaning their power can still remain above 87.4% of the initial value after 30 years.
The actual lifespan depends on material technology (e.g., PERC vs TOPCon), environmental stress (UV, heat, humidity), and the quality of installation and maintenance.
Power Degradation
1. What are the types of power degradation?
Power degradation does not occur uniformly; different mechanisms dominate at different stages.
Initial Light-Induced Degradation (LID)
· Occurrence Time: Within the first few hours or days after the module leaves the factory and is first exposed to sunlight.
· Degradation Magnitude: Typically between 0.5% and 1.5%. This is the portion already accounted for by manufacturers in "positive power tolerance" and "first-year degradation".
· Main Cause: For traditional P-type boron-doped silicon wafers, sunlight exposure causes boron and oxygen elements in the wafer to form "boron-oxygen recombination centers".
Early Degradation
· Occurrence Time: The first full year of operation.
· Degradation Magnitude: Industry standards are mostly between 1% and 2%, with high-quality modules optimized to below 1%.
· Main Cause: A continuation of the initial degradation, coupled with minor shrinkage or deformation of encapsulation materials (like EVA film) under thermal effects, subjecting the cells to slight stress.
Linear Degradation
· Occurrence Time: From the second year onwards, throughout the module's entire life cycle.
· Degradation Magnitude: This is a relatively stable process, with an annual rate between 0.2% and 0.7%, depending on the technology path.
· Main Cause: Caused by the continuous, slow aging of materials, including:
1. Encapsulant Yellowing: EVA film degrades under UV light, slowly reducing its transmittance.
2. Cell Aging: The performance of the silicon wafer and anti-reflection coating slowly changes due to thermal cycling and humidity.
3. Slight Increase in Interconnect Resistance: The contact resistance of solder ribbons and busbars may increase very slightly over time.
2. Which technology paths have slower degradation?
The module's technology choice directly determines the degradation rate. Below is a comparison of typical annual degradation rates for different technologies:
Technology Type | Typical First-Year Degradation | Typical Annual Linear Degradation (From Year 2) | Estimated Power Retention at 30 Years |
Multicrystalline Silicon (Traditional PERC) | 2.0% | 0.60% - 0.70% | Approx. 80.0% |
Monocrystalline PERC (P-type) | 1.5% | 0.45% - 0.55% | Approx. 84.5% |
N-type TOPCon | 1.0% | 0.40% - 0.45% | Approx. 87.0% |
N-type HJT | 1.0% | 0.25% - 0.40% | Approx. 89.5% |
Reasons for slower degradation in N-type technologies (like TOPCon, HJT):
l Less sensitive to impurities: N-type silicon wafers typically use phosphorus doping, fundamentally eliminating the light-induced degradation problem associated with P-type boron doping.
l Lower temperature coefficient: In high-temperature environments, power loss is smaller, and the degradation stress caused by heat is correspondingly reduced.
l Better material compatibility: Advanced technologies like HJT often use amorphous silicon films and low-temperature processes, which are more compatible with POE encapsulation materials, more effectively resisting moisture ingress and potential-induced degradation.
3. How do environment and system accelerate degradation?
Even with a high-quality module itself, harsh environments and non-standard system design can significantly accelerate power loss.
l High Temperature and Humidity: This is the harshest test. For every 10°C increase in ambient temperature, the chemical aging reaction rate of the module's internal materials roughly doubles. Hot and humid environments significantly accelerate two main problems:
l Potential Induced Degradation (PID): Under the combined effect of high system voltage (e.g., 1500V) and humidity, leakage current occurs between the module's internal circuit and the frame, causing significant power degradation, which can exceed 30% loss within a year in severe cases.
l Encapsulation Material Hydrolysis: Moisture penetrates the back sheet or edge sealant, causing EVA to decompose and produce acetic acid, leading to circuit corrosion and glass delamination.
l UV Radiation and Dust:
l Sustained, intense ultraviolet radiation is the primary cause of aging for polymer materials (like EVA, back sheets).
l In windy, sandy areas, sand particles can abrade the glass surface, reducing light transmittance and potentially exacerbating hot spot effects.
l Chemical Corrosion (Ammonia, Salt Spray):
On farms (ammonia) or in coastal areas (salt spray), chemicals in the air can corrode the module frame, mounting structure, and cell grid lines, increasing series resistance and reducing output power.
4. How to identify the degradation rate from warranty terms?
The manufacturer's "Linear Power Warranty" is the most direct document for assessing a module's long-term degradation performance. When interpreting a typical 25-year warranty, pay attention to the following three points:
1. First-Year Degradation Promise: For example, "Power at the end of the first year is not less than 98% of the initial value," meaning first-year degradation does not exceed 2%.
2. Subsequent Annual Degradation Rate: For example, "From year 2 to year 25, annual degradation does not exceed 0.45%." The smaller this number, the better.
3. End-of-Term Power Guarantee: For example, "At the end of the 25th year, output power is not less than 84.8% of the initial rated power." Calculated as: 1 - First-year degradation - (Annual degradation × 24 years).
Factors Affecting Lifespan
1. What materials and technologies are used in the module itself?
The module's "innate genes" are the foundation of its long-term durability.
l Cell Technology is Fundamental
N-type silicon wafers (like TOPCon, HJT) have a lower degradation rate compared to traditional P-type PERC cells. The main reason is that N-type silicon is insensitive to boron-oxygen complexes, almost eliminating initial light-induced degradation. Data shows that under the same environment, the annual power degradation rate of N-type technology routes can be 0.05% to 0.15% lower than that of P-type.
l Encapsulation Materials are the Protective Layer
The cells are sealed between an encapsulation film and glass; the stability of these materials is crucial.
l Encapsulation Film: Traditional EVA film is prone to yellowing under long-term UV exposure, reducing light transmittance and causing power degradation. High-quality POE film or co-extruded EPE film have stronger hydrolysis resistance and anti-PID performance, better blocking moisture and protecting the cells. Under harsh testing conditions (85°C/85% humidity), the power degradation rate of POE-encapsulated modules is typically more than 50% lower than that of EVA modules.
l Back sheet: For common back sheet structures like TPT, KPK, the key is whether the outer fluorine film can effectively resist UV aging and the overall moisture vapor transmission rate. Glass back sheets (for bifacial modules) have excellent moisture barrier properties and weather resistance but increase weight.
l Details of Frame and Junction Box
l The thickness of the anodized layer on the aluminum alloy frame must meet standards to ensure it is not corroded through in high-salt-spray coastal environments.
l The quality of the junction box's sealing ring material and potting compound determines whether moisture will intrude into the box, causing circuit corrosion and failure.
2. In what environment is it installed?
The climate conditions of the installation site are the "stress test" the modules face every day.
l High Temperature and Humidity are the Most Severe Challenges
For every 10°C increase in ambient temperature, the chemical aging reaction rate of the materials inside the module roughly doubles. High temperature and humidity environments significantly accelerate two main problems:
l Potential Induced Degradation (PID): Under the combined effect of high system voltage (e.g., 1500V) and humidity, leakage current occurs between the module's internal circuit and the frame, causing significant power degradation, which can exceed 30% loss within a year in severe cases.
l Encapsulation Material Hydrolysis: Moisture penetrates the back sheet or edge sealant, causing EVA to decompose and produce acetic acid, leading to circuit corrosion and glass delamination.
l UV Intensity and Dust
l Long-term, intense ultraviolet radiation is the primary cause of aging for polymer materials (like EVA, back sheets).
l In windy, sandy areas, sand particles can abrade the glass surface, reducing light transmittance and potentially exacerbating hot spot effects.
l Chemical Corrosion (Ammonia, Salt Spray, etc.)
On farms (ammonia) or in coastal areas (salt spray), chemicals in the air can corrode the module frame, mounting structure, and cell grid lines, increasing series resistance and reducing output power.
3. Do system design and installation techniques have an impact?
Incorrect system design and rough installation practices can give modules "congenital defects" that affect their lifespan.
l Hidden Dangers in Electrical System Design
l System Voltage: 1500V systems compared to 1000V systems, while reducing line losses, place higher demands on the module's anti-PID performance.
l Grounding Method: The potential of the module in the system string (positive or negative voltage to ground) affects the likelihood and severity of PID.
l Mechanical Stress in Installation Practices
l Uneven Installation Force: Incorrect clamp positions or over/under-tightened bolts can cause internal stress in the glass, making it prone to micro cracks under wind/snow loads. Installers should follow the manufacturer's specified torque values (typically 15-20 N·m) and clamp placement guidelines strictly.
l Insufficient Mounting Structure Stiffness: The mounting structure must be designed to withstand local maximum wind speed and snow load. A structure with insufficient stiffness sways frequently under wind load, fatiguing the cell interconnects, leading to micro cracks or even breakage.
4. What maintenance is needed later?
Modules are not "install and forget" devices; proper maintenance can effectively delay performance decline.
l Importance of Regular Cleaning
Surface dust, bird droppings, pollen, and other contaminants not only block sunlight but also cause "hot spot effects" – the shaded part heats up, and localized high temperatures can permanently damage the cell and cause EVA delamination. Data shows that in dusty areas, regular cleaning can increase annual power generation by 3%-6% and avoid irreversible damage from hot spots.
l Inspection and Monitoring
l Visual Inspection: Annually check the module surface for new cracks, whether the back sheet shows yellowing, wrinkles, or bulges, and if the junction box seal is intact.
l Infrared Thermography Inspection: Periodically scan the array with a thermal imager to quickly detect abnormal hot spots caused by micro cracks, diode failure, or poor connections, and address them promptly.
l Data Monitoring: Use the inverter monitoring platform to watch for abnormal drops in system generation efficiency, which may signal severe performance degradation in some modules.