What are the Most Common Applications for Solar Energy
The most common application is rooftop PV, which can save 50% on electricity bills. Module efficiency exceeds 20%, and the lifespan is 25 years.
Combined with hot water and street lights, it is the authoritative solution for achieving household energy saving and cost reduction.
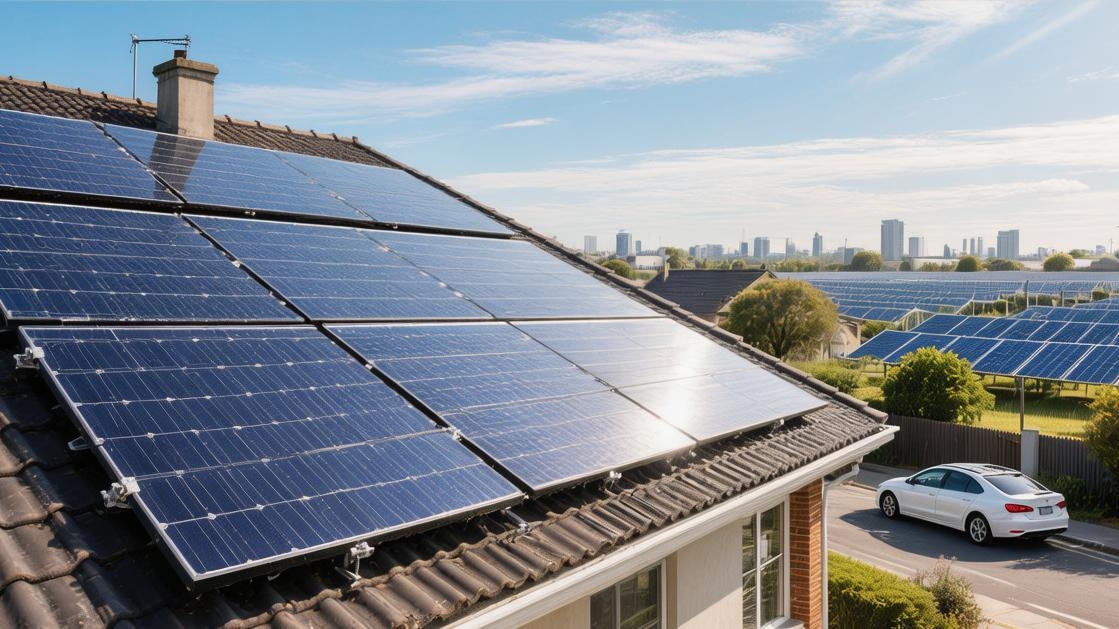
Residential Power Generation
Which panels to choose
Currently, the mass production efficiency of mainstream N-type TOPCon cells on the market has reached between 24.5% and 25.8%, which is about 1% to 2% higher than traditional P-type cells.
A standard size 550W PV panel measuring 2,278mm×1,134mm weighs approximately 28.5 kg. The front tempered glass is usually 3.2 mm thick and can withstand the impact of hail with a diameter of 25 mm at a speed of 23 m/s.
During the actual power generation process, the annual degradation rate of N-type modules is controlled within 0.4%, while older models are usually around 0.8%.
This means that at the end of the 25-year warranty period, the new modules can still maintain more than 87.4% of their initial power.
Considering a power density of about 210 W to 220 W per square meter, a 100-square-meter effective slope can accommodate about 45 modules, with a total installed capacity of over 24 kW.
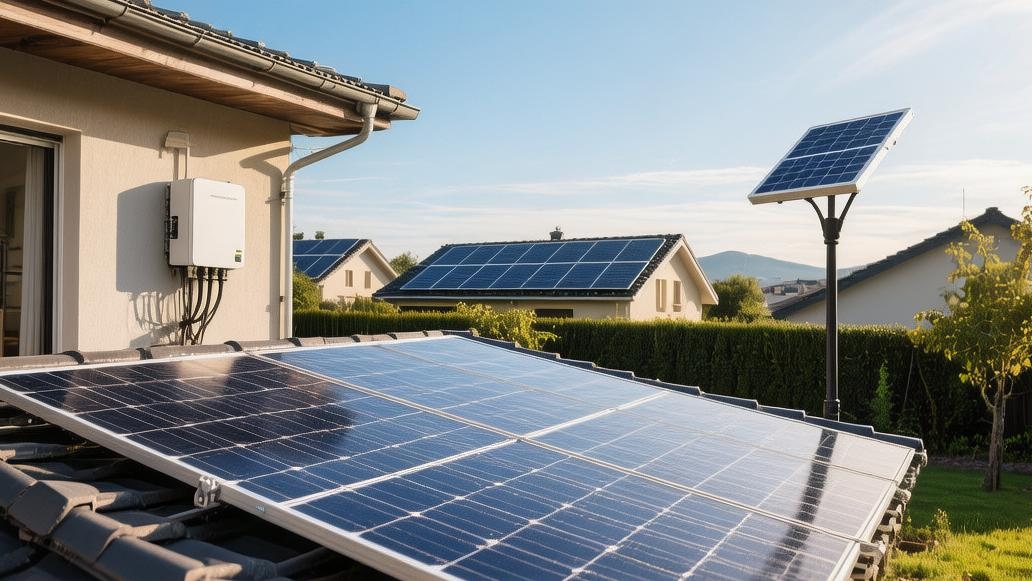
How to install on the roof
When installing brackets on the roof, an additional dead load of about 15 to 20 kg per square meter must be considered.
The oxide film thickness of stainless steel or aluminum alloy brackets should not be less than 15 μm to ensure a 30-year corrosion-resistant life in outdoor salt spray environments.
The installation tilt angle has a direct impact on power generation. In areas around 30 degrees north latitude, adjusting the panels to a tilt of 30 to 35 degrees results in an annual power generation about 12% to 15% higher than horizontal placement.
A maintenance passage of at least 50 cm must be left between each row of modules.
This is also to prevent the front row from shading the back row at noon on the winter solstice, because even if only 3% of the area is shaded, the output power of the entire string may drop by more than 20% due to the intervention of bypass diodes.
How to choose an inverter
The maximum conversion efficiency of household grid-tied inverters is generally above 98%, and the MPPT (Maximum Power Point Tracking) efficiency is as high as 99.9%.
For roofs with complex shading, choosing micro-inverters can optimize each panel independently. Although the cost per watt is about 0.5 to 0.8 yuan higher than string inverters, it can increase the total system power generation by 10% to 25% under complex lighting conditions.
The startup voltage of mainstream string inverters is usually between 120V and 180V, supporting an over-provisioning ratio of more than 1.5 times.
That is to say, a 10 kW inverter can be connected to 15 kW of PV panels to extend effective working time during weak light periods in the morning and evening.
The internal electrolytic capacitor lifespan is usually 10 to 12 years. Therefore, within the 25-year operation cycle of the system, a budget for one inverter replacement usually needs to be reserved. The current market price for a 10 kW inverter is approximately 3,500 to 6,000 yuan.
How much cell to store
Lithium Iron Phosphate (LFP) batteries have become the standard configuration for home energy storage, with an energy density of about 140Wh/kg to 160Wh/kg.
A typical 5kWh energy storage module can reach a Depth of Discharge (DoD) of 90% or even 95%, and can still maintain 80% capacity after 6000 cycles.
If a household's basic nighttime load (refrigerator, lights, router, etc.) is 0.5 kW and runs for 10 hours, a 10 kWh cell pack can provide about 1.8 days of backup power.
With the price of cells falling below 0.4 yuan per watt-hour, the Levelized Cost of Energy (LCOE) for energy storage systems has reached high economic viability.
In areas where the peak-to-valley electricity price difference exceeds 0.7 yuan, the investment recovery period for the energy storage part can be shortened to 6 to 8 years through the "charge by day, discharge at night" mode.
How long to break even
Taking a 10 kW system as an example, the total investment is about 35,000 to 45,000 yuan.
In an area with 1300 equivalent utilization hours per year, the annual power generation is about 13,000 kWh.
If the local electricity price is 0.6 yuan per kWh, the self-consumption ratio reaches 70%, and the surplus electricity grid-connection ratio is 30% (grid-connection price calculated at 0.4 yuan), the annual direct income is about 7,020 yuan.
Plus initial installation subsidies or generation subsidies in some areas, the comprehensive Internal Rate of Return (IRR) is usually between 12% and 15%.
Without considering loan interest, the initial investment can be recovered in 5.5 to 7 years.
In the remaining 18 to 20 years, the electricity generated by the system is almost pure profit, only requiring the deduction of small insurance premiums and professional cleaning fees every 3 years (about 200 yuan per time).
What to do if it breaks
The contact resistance of MC4 connectors should be less than 0.5 mΩ; improper installation can cause local temperatures to rise above 100°C, leading to melting.
Monitoring apps can display the current and voltage of each string of modules in real-time. If the voltage of a certain group is found to be more than 15% lower than the normal value, it is usually caused by bird droppings shading or the hot spot effect.
Cleaning is recommended once per quarter. In industrial areas with heavy dust, regular cleaning can recover 5% to 10% of power generation losses.
For cracks in the backsheet and glass, an infrared thermal imager is needed for detection. Areas with a temperature difference exceeding 20°C usually present a risk of micro-cracks.
Commercial and Industrial Power Use
Covering the factory roof
The load design of commercial and industrial roofs is the primary parameter for project startup, usually requiring the roof to withstand an additional weight of 15 kg to 25 kg per square meter.
To maximize space utilization, large-sized modules such as the 2,384mm×1,303mm specification have become mainstream, with single module power reaching 650W to 700W.
In large cold-chain logistics parks, the PV system not only provides electricity but its physical properties covering the roof can also reduce indoor temperature by 3°C to 5°C, thereby reducing the energy consumption load of air conditioning compressors by about 10%.
For flat roofs, the bracket system usually adopts a small tilt angle of 10 to 15 degrees to reduce wind load pressure on the building structure and ensure the system remains stable under extreme weather with maximum gust speeds of 60 m/s.
A typical 1MW commercial and industrial project usually contains about 1700 to 1850 high-power modules. The DC-to-AC ratio of the system is usually set between 1.2:1 and 1.4:1, ensuring that the inverter can maintain full-load operation even during weak light periods in the morning and evening.
Double-sided power generation
Currently, more and more industrial projects are adopting bifacial module technology, where both sides of the panel can generate electricity.
The back side can bring an additional 5% to 15% power generation gain by absorbing light reflected from the roof.
If the roof surface is coated with a high-reflectivity white waterproof coating (Albedo value greater than 0.6), the backside gain can even exceed 20%.
As the working voltage of commercial and industrial modules has increased to 1500V (DC side), this not only reduces DC cable line loss by about 0.7% but also reduces the number of combiner boxes and circuit breakers, bringing down the overall BOS (Balance of System) cost by about 0.02 dollars per watt.
Under this high-voltage state, the system's requirements for leakage protection and Arc Fault Circuit Interrupter (AFCI) are extremely high, with response times usually required to cut off the circuit within 2.5 seconds.
Large-scale inverters
Commercial and industrial systems usually select high-power string inverters of 100 kW to 300 kW, with a single device weight between 70 kg and 110 kg.
These devices are equipped with more than 10 MPPT (Maximum Power Point Tracking) controllers, ensuring that every string of modules operates at the optimal current and voltage point even if the factory roof has different orientations or local shading.
The maximum conversion efficiency of large inverters is usually 99.0%. Heat dissipation pressure is extreme during full-load operation; the built-in intelligent fan system will perform stepless speed regulation between 45°C and 65°C based on temperature sensors.
Current advanced monitoring platforms can achieve module-level fault warning with a current fluctuation monitoring accuracy of ±0.5%, capable of pushing precise positioning coordinates to maintenance personnel via the App within 30 seconds after a fault occurs.
Fast ROI
From a financial perspective, the Return on Investment (ROI) for commercial and industrial PV is very considerable.
Taking a 2 MW project as an example, the initial investment cost is usually between 0.45 and 0.65 dollars per watt, including modules, inverters, brackets, cables, and installation costs.
In industrial areas with high electricity prices, if the self-consumption ratio reaches over 90%, the project's dynamic payback period is usually shortened to 4.2 to 5.5 years.
In the following 20 to 25 years of operation, the maintenance cost (O&M) per kWh is only about 0.005 dollars.
When performing financial calculations, an annual module power degradation rate of 0.4% to 0.5% needs to be included. Even so, the total system output after 25 years can still maintain about 85% of the initial design. For manufacturing enterprises with huge power demands, this is equivalent to locking in a fixed electricity price as low as 0.04 dollars/kWh for the next 20 years, avoiding financial risks caused by fluctuations in fossil energy prices.
Maintenance is not difficult
Dust, exhaust fumes, or bird activity in industrial environments can cause dirt to form on the module surface, generating a hot spot effect that raises the local cell temperature to over 80°C, which can burn the backsheet in severe cases.
By using automatic cleaning robots, the cleaning cost per square meter can be controlled below 0.1 dollars, while the recovery of power generation can reach 8% to 12%.
An infrared thermal imaging scan every six months is necessary to identify micro-cracks or diode short circuits that are invisible to the naked eye.
Statistical data shows that timely replacement of damaged connectors and optimizing cleaning frequency can increase the system's annual equivalent utilization hours by more than 100 hours.
Peak shaving and valley filling
More and more factories are starting to build matching 1MW/2MWh-level lithium iron phosphate energy storage systems.
This combination allows enterprises to store cheap electricity during low-demand periods (usually late at night or when PV is surplus at noon) and release it during peak demand periods from 5 PM to 9 PM.
The cycle life of energy storage batteries is usually 6,000 to 8,000 times, with the DoD (Depth of Discharge) set at around 90%.
In this way, enterprises can effectively reduce "basic electricity charges" (charges based on maximum demand). Some high-energy-consuming factories can save an additional 50,000 dollars in electricity bills annually through this strategy.
Currently, the response speed of energy storage systems reaches the millisecond level, and they can also act as emergency backup power during sudden grid outages, avoiding losses of hundreds of thousands of dollars caused by production line shutdowns.
Off-Grid and Remote Power Supply
Usable without a grid
The core of an off-grid system lies in matching the cell to the load, usually adopting a 12V, 24V, or 48V DC architecture. 48V has become the standard voltage for medium and large systems above 5 kW because it can effectively reduce line current and decrease cable copper loss by about 60%.
The MPPT controller acts as the "heart" in off-grid systems, with tracking efficiency usually above 99.5%.
Compared to older PWM controllers, MPPT can improve power generation utilization by 20% to 30% in winter or cloudy weather.
In an area with sufficient sunlight, to support a small cabin consuming 5 kWh (units) of electricity per day, 1.5 kW to 2 kW of PV panels are usually required.
Considering reserves for rainy weather, the system must have "Days of Autonomy," usually set at 2.8 to 3.5 days.
Load Equipment | Power (W) | Daily Duration (h) | Daily Consumption (Wh) |
LED energy-saving lamps (5 units) | 50 | 6 | 300 |
Small DC refrigerator | 60 | 24 | 1440 |
Satellite internet/Router | 30 | 24 | 720 |
Laptop computer | 65 | 4 | 260 |
Water pump (pumping to tank) | 500 | 0.5 | 250 |
Total | -- | -- | 2,970 Wh (approx. 3 units of electricity) |
Use in the wilderness
In telecom signal towers or meteorological monitoring stations in remote areas, solar energy has replaced expensive diesel generators.
The power consumption of a standard 4G/5G base station is usually between 500W and 2000W.
If a diesel generator is used, the annual fuel, transportation, and maintenance costs could be as high as 12,000 dollars. In contrast, the initial installation budget for a 10 kW off-grid PV system is about 15,000 to 22,000 dollars, meaning all electricity output after 18 months of operation is net profit.
Signal tower systems usually adopt a 1:1.5 provision ratio, meaning 1,000W of load is equipped with 1,500W of PV panels to ensure the load can be powered and batteries charged even during weak light in the early morning.
When these systems are installed at altitudes above 3,000 meters, the voltage characteristics of PV panels change due to thinner air and lower temperatures; the Open Circuit Voltage (Voc) may rise by more than 10%.
Therefore, the selected inverters and controllers must have higher voltage ratings (usually 150 V or 250 V DC input) to prevent low-temperature high-voltage from burning the circuit.
How to choose batteries
Currently, Lithium Iron Phosphate (LiFePO4) batteries have fully replaced lead-acid batteries.
Although the initial purchase price of lithium batteries is 2.5 times that of lead-acid, their advantages in lifespan and efficiency are extremely significant.
The Depth of Discharge (DoD) for deep-cycle lead-acid batteries (AGM/GEL) is recommended not to exceed 50%, otherwise, the lifespan will quickly shorten to 300-500 cycles;
In contrast, lithium iron phosphate batteries can support 90% DoD, and cycle counts generally exceed 6000.
This means that in a 10-year operation cycle, lead-acid batteries need to be replaced at least 3 to 4 times, while lithium batteries can remain in service.
Furthermore, the charge-discharge efficiency of lithium batteries is as high as 95% or more, while lead-acid is only about 80%. This extra 15% loss in off-grid systems means you would need to buy 15% more PV panels to offset the heat waste.
Performance Index | Lithium Iron Phosphate (LFP) | Deep Cycle Lead-Acid (GEL) |
Cycle Life (80% DoD) | 6000+ times | 500-800 times |
Energy Density | 150 Wh/kg | 35 Wh/kg |
Charge-Discharge Efficiency | 95% - 98% | 80% - 85% |
Operating Temperature Range | -20°C to 60°C | 0°C to 40°C |
Maintenance Requirements | Maintenance-free | Requires periodic check of wiring/fluid levels |
Pumping water for farmland irrigation
In agricultural and pastoral areas lacking electricity, solar water lifting systems (PV water pumps) are core tools for solving irrigation.
These systems usually do not require expensive storage batteries; instead, energy is stored in water towers.
A 5.5 kW PV water pump system can drive a 7.5 hp three-phase asynchronous motor. Under a 40-meter head, the water output can reach 15 to 25 cubic meters per hour.
The Variable Frequency Drive (VFD) is the brain of the system; it adjusts the output frequency (usually hopping between 30 Hz and 50 Hz) to match fluctuations in sunlight intensity.
During high-intensity sunlight periods from 10 AM to 4 PM, the system runs at full speed at 50 Hz;
In the morning and evening, the system automatically down-clocks, ensuring that even with only 30% sunlight, a small amount of water can still be produced.
This mode saves 100% of fuel costs compared to diesel pumps, and since there is no reciprocating mechanical wear, the maintenance-free runtime of the motor usually exceeds 20,000 hours.
How to handle maintenance
In desert areas with high dust or areas near forests, dust accumulation on module surfaces can cause system output power to drop by 15% to 25%.
For off-grid systems, this loss can be fatal as it causes batteries to remain in a low state of charge (SOC below 20%) for long periods, leading to irreversible capacity degradation.
It is recommended to check the torque of connectors every two months.
Since off-grid systems have large charge-discharge currents during the day (usually between 50A and 100A), if MC4 connectors are not crimped tightly, the resulting contact resistance will cause local temperatures to quickly rise above 90°C, increasing fire risk.
Additionally, the dust filter of the inverter needs regular cleaning, because in high-temperature environments, for every 10°C rise in the internal temperature of the inverter, the lifespan of its electronic modules is halved.
Current intelligent off-grid inverters usually support Bluetooth or satellite communication modules, allowing users to view the cell voltage curve via a local App even in places with no cell signal, enabling timely discovery of abnormal voltage drops.