Top 3 Strategies to Enhance Energy Efficiency in Solar Installations
Optimizing the tilt angle can increase yield by 15%;
Installing optimizers improves low-light energy efficiency by 25%;
Regularly cleaning modules prevents a 30% loss due to dust accumulation.
Optimize Tilt Angle
Precision in Latitude and Longitude
At a geographical coordinate of 38 degrees North latitude, placing a 550 W PV module horizontally results in an annual radiation reception of only 1450 kWh per square meter. However, after adjusting to the optimal tilt angle of 33 degrees, this value rises to 1780 kWh per square meter, an efficiency increase of more than 22%.
The tilt angle of a PV array is typically set between the local latitude minus 5 to 10 degrees to obtain maximum power in summer, or increased by 10 to 15 degrees to balance the light deficit in winter.
For a 10 MW power station operating near 116 degrees East longitude, if the tilt error exceeds 5 degrees, the annual power generation revenue will shrink by 150,000 RMB, which is equivalent to a loss of 3% of the system's net profit.
· When the module tilt angle is adjusted from 15 degrees to 30 degrees, the reflection loss rate on the single-piece glass surface decreases from 4.2% to 2.8%.
· In areas at 40 degrees latitude, setting a fixed tilt of 35 degrees ensures that the minimum sunshine hours in December are not less than 2.5 hours.
· If a 5 kW residential power station adopts the 25-degree optimal tilt, its cumulative electricity bill savings over a 25-year life cycle will be 4,800 USD higher.
· According to the standard test irradiance of 1,000 W/m², every 1-degree deviation in tilt angle results in a 0.05 W drop in power output per watt.
Follow the Seasons
If adjustable brackets are used to manually switch angles four times a year in March, June, September, and December, the total annual output of the power station can be increased by 6.5% to 8%.
In June during the summer, lowering the bracket tilt to 15 degrees allows the solar direct angle to remain above 85 degrees, at which point the internal resistance loss of the monocrystalline silicon cells operates at a low level of 0.8 ohms.
By December in winter, pushing the angle up to 50 degrees can capture weak sunlight with an elevation angle of only 28 degrees, ensuring the inverter reaches a startup voltage of 250 V as early as 8:15 AM.
· The hardware cost of manual adjustable brackets is 15% higher than that of fixed brackets, but the extra 2,400 kWh generated within 3 years can offset this investment.
· Seasonal adjustment can compress the power generation loss from November to the following February from 40% to within 25%.
· For 12 modules connected in series, uniform angle adjustment reduces voltage mismatch between modules, controlling mismatch loss to around 0.2%.
· Under a 45-degree adjustment difference between winter and summer, the peak current of a single module can be stabilized within the rated range of 13.5 Amperes.
Don't Install Crooked
Keeping the azimuth at 180 degrees due South is the benchmark. If the azimuth deviates from due South by 15 degrees, the system's comprehensive annual power generation will drop by about 2.5% to 4%.
When the light intensity is 600 W/m² at 3 PM, the output of a panel tilted 30 degrees toward the Southeast will be 80 W lower than that of a panel facing due South.
Installers need to use electronic compasses with an accuracy within 0.1 degrees to ensure the parallelism error of each row of brackets is controlled within 5 mm, avoiding a 1.5% circulation loss caused by uneven local light reception.
· An azimuth 10 degrees East of South will cause the power generation peak to appear 40 minutes early, resulting in 15% of the electrical energy not being immediately consumed by self-consumption loads.
· In a 200-square-meter roof area, installing 40 pieces of 600W modules with consistent azimuth can reduce the cable routing length by 0.5%.
· Installing at a 45-degree deviation from due South will directly cause the system output power to drop below 20% of its rated value after 4 PM.
· Using 3D modeling software to simulate 365 days of shadow casting, azimuth optimization can avoid a 10% shading loss brought by surrounding 5-meter-high buildings.
Avoid Strong Winds
Increasing the angle significantly changes the stress structure of the bracket system. When the tilt angle increases from 20 degrees to 40 degrees, the wind load on the back increases by 35%.
In coastal areas where wind speeds reach 30 meters per second, a module at a 40-degree angle generates an upward pull of 1.8 kN per square meter, requiring the weight of the foundation ballast blocks to increase to over 60 kg.
To support a 35-degree high-angle array, the wall thickness of the aluminum bracket material needs to be strengthened from 2.0 mm to 2.5 mm, which increases the bracket cost by 85 RMB per kilowatt.
· For every 10-degree increase in angle, the shear strength requirement for the bracket base bolts increases by 12%.
· In a Category 15 typhoon environment, a module with a 30-degree tilt bears 2.4 times the pressure of a module with a 10-degree tilt.
· Using 6005-specification aluminum alloy brackets, they can withstand a snow load of 2.0 kPa at a 35-degree tilt without deformation.
· Increasing the row spacing to 3.5 meters can reduce long shadows generated by high-angle modules, avoiding a 12% shading loss for the rear row.
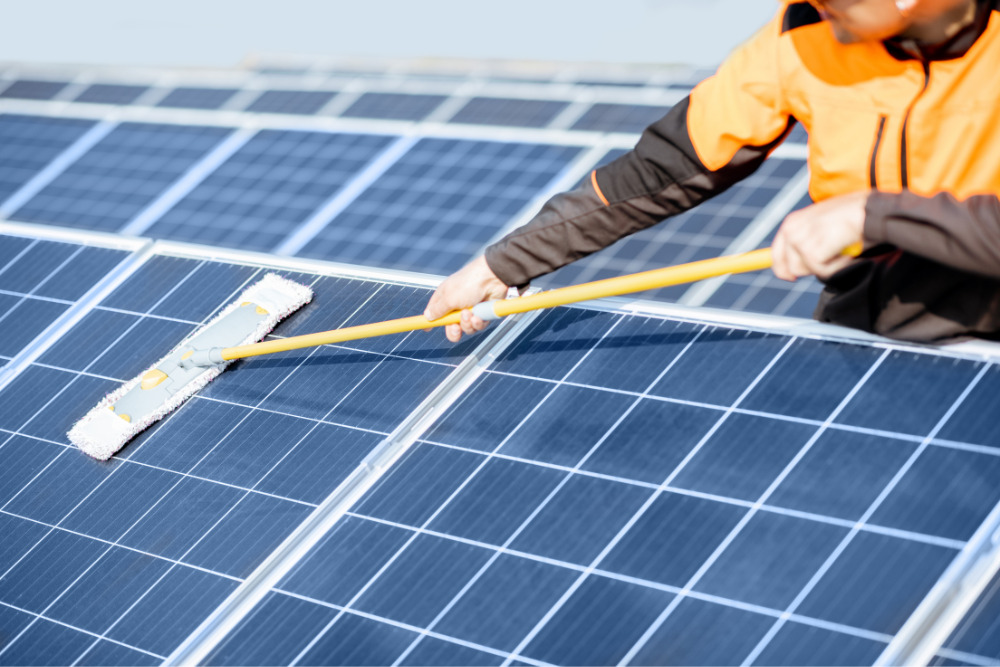
Clean It While You're At It
When the module tilt angle is greater than 25 degrees, more than 90% of the dust accumulation on the panel surface can be washed clean by natural rain with a rainfall of 5 mm.
If the tilt angle is set below 10 degrees, water stains and mud belts easily form at the bottom edge of the panel, shading the bottom cell busbars and leading to a "hot spot effect" power slump of 5% to 15% for the entire string.
Maintaining a 30-degree tilt can reduce electrostatic adsorption on the glass surface by 18%, reducing the 8% light blocking loss caused by 0.5 mm thick dust coverage.
· Natural wind flow at a 30-degree tilt can carry away 25% of the accumulated heat on the back of the module, controlling the operating temperature at around 45 degrees.
· For every 5-degree drop in operating temperature, the power temperature coefficient of monocrystalline silicon modules can recover 0.4% of efficiency loss.
· In arid regions, a 35-degree tilt results in 11% higher power generation than a 5-degree tilt after a 60-day rainless period.
· Tilt optimization combined with 3 mm thick ultra-white patterned glass can stabilize light transmittance at a high level of 93.5%.
Regular Cleaning
Dust Costs Money
In semi-arid regions with annual rainfall below 500 mm, an accumulation of 10 grams of dust per square meter on the surface of PV modules will cause the solar transmittance to drop by more than 12.5%.
When the dust thickness reaches 0.1 mm, the number of photons absorbed by the silicon wafer decreases by 15%, meaning the actual output power of a 600W module will drop below 510W.
For a project with an installed capacity of 1 MW, if cleaning is not performed for 60 consecutive days, the cumulative power generation loss will reach 18,000 kWh. At 0.1 USD per kWh, the direct economic loss is as high as 1,800 USD.
Experimental data shows that if a 2 cm wide mud belt accumulates on the lower edge of the module, it will induce current mismatch, causing the output current of a string of 20 modules to plummet from 13 Amperes to 9 Amperes, resulting in 30% of the power being converted into heat within the internal resistance.
This hot spot effect caused by shading can cause local cell temperatures to rise by 30 degrees Celsius within 10 minutes. Long-term operation will cause the EVA film used for encapsulation to have a 5% yellowing rate, shortening the module's service life by more than 5 years.
Near industrial areas, particulate matter with a diameter of less than 2.5 microns (PM2.5) in the air carries acidic or alkaline substances, which will erode the 3 mm thick tempered glass surface in an environment with 85% relative humidity, increasing the light scattering rate by 3.5%.
Pick Your Timing
Cleaning operations must strictly avoid the high-radiation period from 11 AM to 3 PM, as the module surface temperature is usually between 55 and 75 degrees Celsius at this time.
If 20-degree Celsius cold water is sprayed at this time, the glass will withstand an instantaneous temperature difference stress of more than 40 degrees Celsius, increasing the probability of micro-cracks in the 3.2 mm thick tempered glass by 25%.
The optimal cleaning window is before 7 AM or after 6 PM, when the difference between the module operating temperature and the ambient temperature is less than 10 degrees Celsius, pushing the risk of glass bursting down to below 0.01%.
Under conditions of 25 degrees Celsius ambient temperature and 2 meters per second wind speed, morning cleaning allows the module to maintain a 98.5% rated photoelectric conversion efficiency during the next 4 hours of peak power generation.
For systems with an installation tilt of less than 15 degrees, the self-cleaning ability of rainwater can only carry away 40% of coarse dust particles, while the remaining 60% of fine dust will adsorb in the depressions of the glass surface.
Adopting manual cleaning once a month can keep the annual operating efficiency of the system at around 96% of the design value, whereas this index for systems completely dependent on precipitation is usually only 88%.
In coastal areas with high salt spray, rinsing salt accumulation every 14 days can prevent pitting corrosion deeper than 0.1 mm on the aluminum alloy frame.
Water Must Not Be Hard
The total dissolved solids (TDS) content of the cleaning water must be controlled within 100 ppm.
If well water with a TDS exceeding 300 ppm is used, a 0.05 mm thick calcium and magnesium residue layer will be left on the glass after the water evaporates.
These white spots produce a significant shading effect, reducing the short-circuit current of individual cells by 2% to 5% and forming irreversible chemical scaling within 3 years.
Using deionized water or filtered water with an osmotic pressure of less than 0.5 MPa ensures that no water stains are left on the surface after drying.
Flushing pressure is strictly prohibited from exceeding 0.7 MPa. Excessively high water pressure will seep into the backsheet through the module frame gaps, causing the insulation resistance of a 1500V system to drop from 500 MΩ to below 2 MΩ, triggering inverter leakage protection.
Select soft nylon brush heads with a bristle diameter of around 0.1 mm to ensure that after 1000 reciprocating wipes, the wear of the Anti-Reflective Coating (ARC), which is about 120 nm thick, is less than 10 nm.
It is strictly forbidden to use acidic or strong alkaline cleaners, because solutions with a pH less than 5 or greater than 9 will destroy the hydrophilicity of the glass surface within 30 minutes, increasing the subsequent dust accumulation rate by 20%.
Tool Requirements
When using professional semi-automatic cleaning robots, the pressure of the tracks on the module surface must be less than 0.02 kg/cm² to prevent micro-cracks in the 180-micron thick silicon wafers.
For large-sized modules of 2 meters by 1 meter, a single cleaning cycle should be completed within 90 seconds to ensure a work efficiency of more than 40 modules per hour.
If manual brush cleaning is used, the push-pull force should be constant between 5 and 10 Newtons to avoid local point stress.
The sensor accuracy of automated cleaning equipment needs to reach 0.5 cm to prevent mechanical collisions when crossing the 2 cm gaps between modules, which could damage the anodic oxidation layer of the frame.
For large arrays with a layout length exceeding 100 meters, deploying a fouling monitoring system with a sampling frequency of once per minute can automatically trigger an alarm when the Performance Ratio (PR) drops by 3%.
Compared to traditional manual inspections, this data-driven decision-making method can reduce ineffective cleaning by 40% while lowering life-cycle maintenance costs by 15%.
In areas with significant wind and sand, using nano-coatings with electrostatic repulsion functions can reduce the adhesion of fine particles by 35%, extending the cleaning cycle by 20 to 30 days.
Calculate ROI
In a 50 kW commercial and industrial project, the total annual budget for six professional cleanings is approximately 450 USD, with a single cost per module of less than 0.2 USD.
Through these six cleanings, the annual power generation can be increased from 72,000 kWh to 79,200 kWh. The extra 7,200 kWh, calculated at an electricity price of 0.12 USD, brings an additional revenue of 864 USD.
After deducting the cleaning cost, the net profit increases by 414 USD, which means investing 1 USD in maintenance can yield about 1.92 USD in electricity return.
During the 25-year operation period, keeping the modules clean can narrow the DC-side voltage fluctuation range inside the inverter by 10%, reducing the number of thermal stress cycles of the power transistors by 15%, indirectly lowering equipment repair risks by more than 500 USD.
For large-scale 10 MW ground-mounted power stations, introducing drone thermal imaging scanning linked with automatic cleaning robots can reduce the O&M cost per watt from 0.01 USD to 0.007 USD per year.
The optimized cleaning plan can increase the Internal Rate of Return (IRR) of the power station by 0.8 percentage points, shortening the original 7.2-year investment recovery period to 6.5 years.
By precisely controlling the water-to-dust ratio and cleaning frequency, the annual equivalent utilization hours of the power station can be stabilized at more than 1450 hours, much higher than the industry average of 1,320 hours.
Use High-Efficiency Inverters
Identify Conversion Rate
As the hub of the PV system, the maximum conversion efficiency of an inverter usually fluctuates between 97.5% and 99%.
Don't underestimate this 1.5% difference; in a 50 kW commercial project, if the inverter efficiency increases by 1%, it can generate an extra 750 kWh per year, and the cumulative increase in power generation over a 25-year cycle will reach 18,750 kWh.
We should focus more on "Euro Efficiency," which is a weighted average that considers the performance under different light intensities throughout the day.
High-efficiency inverters can maintain a conversion capability of over 95% in the early morning when the load rate is only 10%, whereas low-end models often fall below 85% at low loads.
Performance Parameter | Standard Inverter | High-Efficiency Inverter | Impact of Efficiency Difference |
Max Conversion Efficiency | 97.20% | 99.00% | 1.8% direct power gain |
Euro Weighted Efficiency | 96.50% | 98.60% | 5% more power in low light |
MPPT Static Efficiency | 99.00% | 99.95% | 0.95% improvement in tracking accuracy |
Night Standby Loss | 5W to 10W | Less than 1W | Saves approx. 40 kWh/year in base consumption |
Watch the Trackers
The reaction speed and accuracy of Maximum Power Point Tracking (MPPT) directly determine the output of the modules in cloudy weather.
High-efficiency inverters are usually equipped with 2 to 4 independent MPPT channels, and the dynamic tracking efficiency of each channel should reach more than 99.9%.
For a 10 kW household system with complex roof orientations, using dual MPPTs to manage modules on the East and West slopes separately can avoid a 10% to 15% voltage mismatch loss caused by different orientations.
The MPPT voltage range is equally important. For example, operating within an ultra-wide range of 160V to 1000V means it can start 30 minutes earlier and shut down 20 minutes later than traditional models, adding nearly one hour of effective power generation time daily.
MPPT Technical Detail | Quantified Parameter | Actual Operating Gain |
Tracking Sampling Frequency | Once every 0.5 s | Captures 20% transient fluctuations from clouds |
Min Startup Voltage | 80V to 120V | Grid-ties at 150 W/m² on rainy days |
Max Input Current | 15A to 20A per channel | Perfectly matches high-current modules (600W) |
DC/AC Ratio Support | Over 1.5 times | Compensates for 15% power degradation after 25 years |
Control Working Temperature
If the junction temperature of the power transistors (IGBT) inside a high-end inverter can be reduced from 90 degrees to 75 degrees Celsius at full load, the failure rate of electronic modules will drop by about 50%.
High-efficiency models usually adopt large-area aluminum alloy cooling fins combined with intelligent stepless speed control fans to ensure that "derating" protection is not triggered even in high ambient temperatures of 45 degrees Celsius.
Once an inverter starts power-limited operation due to poor heat dissipation, the output current is forced to shrink by 20% to 30%, resulting in a loss of over 5 kWh in electricity revenue per day during summer peak periods.
Cooling and Temp Control | Specification Detail | Impact on System Life |
Full-load Temp Rise Control | Less than 30°C | Extends film capacitor life to 15 years |
Derating Start Point | 50°C Ambient Temp | Avoids a 25% power slump at summer noon |
Protection Rating | IP66 Dust/Waterproof | Maintains 0.5 MΩ insulation at 95% humidity |
Heatsink Area | 200 cm² per kW | Reduces failure rate from thermal stress by 2% |
Reduce Harmonic Loss
Total Harmonic Distortion (THD) must be controlled within 3%. If this value exceeds 5%, it will increase transformer losses within the power station by 1.5% and may interfere with the operating frequency of precision appliances in the home.
By adopting a three-level topology and high-frequency sampling technology, high-efficiency inverters can further reduce line losses during power transmission by 0.5%.
Additionally, the leakage current protection threshold on the DC side should be accurate to 30 mA, ensuring the safety of the 1000 V high-voltage system while avoiding unintended shutdowns caused by false alarms.
Power Quality and Safety | Technical Requirement | Long-term Financial Impact |
Output Harmonics (THD) | Less than 2% | Reduces extra 10% heat loss in home appliances |
Power Factor Adjustment | 0.8 leading to 0.8 lagging | Avoids grid fines for insufficient reactive compensation |
DC Switch Life | 10,000 load breaks | Reduces replacement frequency by 15% over 25 years |
Insulation Monitoring | 0.1 MΩ accuracy | Warns of backsheet damage 48 hours in advance |