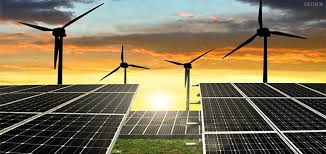
What are Driving the Future of Renewable Energy on Water Surfaces | 3 Innovations
Floating photovoltaics and floating wind turbines utilize water-cooling effects to increase power generation efficiency by approximately 15%. Combined with deep-sea hybrid energy technologies growing at an annual rate of over 30%, these systems are effectively addressing land resource bottlenecks by significantly reducing the Levelized Cost of Electricity (LCOE), becoming the core driving force for the global sustainable development of "blue energy."
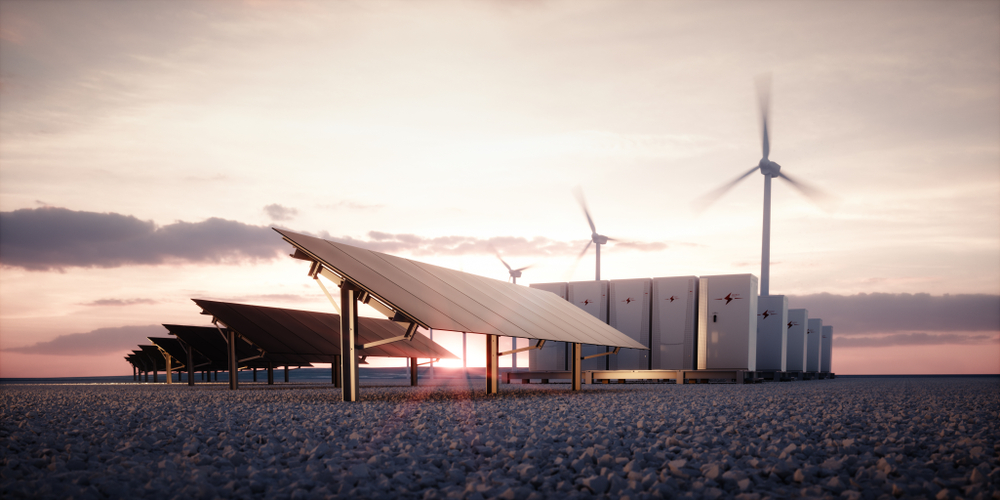
Floating Photovoltaics (FPV)
Cost Savings on Water Surfaces
In 2024, land leasing and purchasing costs for global terrestrial photovoltaics accounted for 18% to 25% of total investment. In contrast, Floating Photovoltaics (FPV) reduce this cost to below 3% by covering unused reservoirs, ponds, or irrigation channels.
There are approximately 265,000 square kilometers of reservoir area globally. Installing power generation equipment on just 1% of this water surface would result in an installed capacity potential of 400 GW, enough to support an annual clean energy output of 520 TWh.
In land-scarce regions like Southeast Asia, each hectare of water surface can carry an installed capacity of 1.2 MW to 1.5 MW. Within the same 50-hectare area, the output per unit area of a floating site is 12% higher than that of a terrestrial site.
In deep-water areas exceeding 10 meters, a floating layout avoids complex terrestrial earthworks, reducing preliminary leveling costs by approximately 15%.
Region Type | Land Cost Proportion | Installation Density (MW/Hectare) | Site Leveling Fee (RMB/W) |
Barren Mountains/Slopes | 15% - 20% | 0.8 - 1.0 | 0.35 - 0.60 |
Plain Farmland | 25% - 30% | 1.0 - 1.2 | 0.15 - 0.25 |
Reservoir Surface | 1% - 3% | 1.2 - 1.5 | 0.02 - 0.05 |
Cooling for Power Generation
Water bodies provide a natural cooling effect on PV modules. Measured data shows that the backplane temperature of modules in a water environment is 5°C to 12°C lower than that of similar terrestrial modules.
The power temperature coefficient of PV cells is typically around -0.35%/°C. For every 10°C decrease in temperature, real-time output power increases by 3.5%.
Combined with the physical characteristics of open water and minimal shading, the integrated system efficiency (PR value) of floating power stations remains between 82.5% and 85% year-round, which is about 10% higher than terrestrial stations.
Furthermore, covering 30% of a reservoir's area can reduce water evaporation by 40% to 60%, with annual evaporation reduction reaching 1,100 to 1,400 liters per square meter.
This water retention provides an indirect economic benefit of approximately $5,000 per hectare for agricultural irrigation in arid regions.
Environmental Parameter | Terrestrial Station Data | Floating Station Data | Gain Percentage |
Average Module Temp | 55°C - 65°C | 42°C - 50°C | 20% Cooling |
System PR Value | 75% - 78% | 82% - 85% | 8% - 10% Increase |
Annual Generation Hours | 1100h | 1,250 h | 13.6% Increase |
Floating Body Parameters
Mainstream floating bodies use High-Density Polyethylene (HDPE) material, ensuring that strength loss remains below 20% over a 25-year operating period through 10,000 hours of accelerated aging tests.
The specifications for a single large buoy are typically 1,200 mm × 800 mm × 400 mm, with a self-weight maintained at 10 kg to 12 kg and a maximum load capacity of 150 kg to 200 kg.
The wall thickness of the buoy is between 3.5 mm and 5.5 mm, filled with air or closed-cell foam to ensure a safety buoyancy reserve of over 0.8 even if a 0.5-square-meter area is damaged by a local impact.
The installation site uses pin-type connections; a four-person team can complete the assembly of 200 kW of floating bodies every 8 hours, which is 30% faster than traditional fixed brackets.
Module installation tilt angles are usually set between 5 and 15 degrees to balance wind load resistance with drainage efficiency.
Performance Dimension | Technical Index Data | Industry Standard Value | Expected Lifespan |
Tensile Strength | 22 MPa - 25 MPa | > 20 MPa | 25 Years |
UV Resistance Rating | UV20 - UV25 | > UV15 | 25 Years |
Env. Stress Cracking | > 1000h | > 500 h | 25 Years |
Recycling Rate | 98.5% | > 95% | Lifetime |
Anchoring Tension
Floating arrays are fixed via a prestressed anchoring system designed to withstand maximum wind speeds of 55 m/s, capable of resisting super typhoons of level 16 or higher.
Anchor chains use 316L stainless steel or high-molecular-weight polyethylene fiber ropes, with single rope breaking tension design values typically between 250 kN and 400 kN.
In reservoir areas where water levels fluctuate by more than 15 meters, the system is equipped with gravity anchors and pulley balance blocks to control the horizontal displacement deviation of the array on the water surface within 0.3 meters.
Bottom anchoring blocks use 4 to 8-ton prefabricated concrete modules. Depending on the underwater geological conditions, 12 to 20 anchoring points are required per megawatt.
The cost of the anchoring system accounts for about 5% to 8% of the total EPC cost, but its failure rate is controlled below 0.01% per year.
Anchoring Module | Specifications | Material Requirements | Safety Factor |
Anchoring Rope | Dia. 28mm - 32mm | High-strength Polyester/SS | 3.5x |
Sink Anchor Weight | 5000kg - 8000kg | C30 Reinforced Concrete | 2.0x |
Dynamic Connectors | M20 - M24 Bolts | Dacromet Coating Grade 8.8 | 4.0x |
Financial Feasibility
The initial investment per watt (CAPEX) for floating PV currently ranges between 3.2 and 4.2 RMB. Although this is about 0.3 to 0.5 RMB higher than terrestrial stations, the Levelized Cost of Electricity (LCOE) is lower due to power generation gains.
Over a 25-year lifecycle, the operation and maintenance cost (OPEX) per watt is approximately 0.04 to 0.06 RMB, primarily used for water surface debris cleaning and anchoring inspections.
A 100 MW floating power station can generate 130 million kWh annually. At a feed-in tariff of 0.4 RMB/kWh, annual revenue reaches 52 million RMB.
The Internal Rate of Return (IRR) typically falls within the 9% to 13% range, which is more attractive compared to the approximately 8% for terrestrial projects.
The project payback period is usually between 6.8 and 7.5 years. After 10 years of operation, the secondary recycling value of the floating material is about 10% of the initial purchase price.
Economic Indicator | Terrestrial Project Data | Floating Project Data | Margin Benefit |
CAPEX (RMB/W) | 2.8 - 3.5 | 3.2 - 4.2 | + 0.5 (Investment) |
LCOE (RMB/kWh) | 0.32 | 0.28 | - 0.04 (Output) |
Internal Rate of Return | 8.5% | 11.2% | + 2.7% |
Payback Period (Years) | 8.2 | 7.1 | - 1.1 Years |
Using 210mm large-size double-glass modules with 1500V high-voltage systems can further reduce line losses by 1.5% and increase total power generation contribution by over 6.5% throughout the 25-year operation period.
Deep-sea Floating Wind
Powerful Sea Breezes
Over 80% of global offshore wind energy resources are distributed in sea areas with water depths exceeding 60 meters. In these regions, average wind speeds typically range from 9.5 m/s to 12 m/s, which is about 15% to 25% higher than in nearshore areas.
Because deep-sea areas are free from terrain friction and terrestrial building interference, wind energy flow is highly stable, with turbulence intensity remaining below 0.08.
The annual utilization hours of wind turbines can easily exceed 4,500 hours, which is about 2,000 hours higher than onshore wind power.
From a global resource perspective, the exploitable potential of deep-sea wind power exceeds 80,000 TWh, enough to cover more than three times current global electricity demand.
In sea areas with water depths of 100 to 500 meters, the wind power density can reach 1,000 to 1,500 Watts per square meter.
Regional Dimension | Water Depth (m) | Avg Wind Speed (m/s) | Power Density (W/㎡) | Annual Utilization (h) |
Nearshore Fixed | 20 - 50 | 7.5 - 9.0 | 400 - 800 | 3000 - 3500 |
Deep-sea Floating | 60 - 500 | 9.5 - 12.0 | 1000 - 1500 | 4500 - 5200 |
Onshore Plains | 0 | 5.5 - 7.0 | 200 - 400 | 2000 - 2500 |
Stability in the Waves
Deep-sea floating platforms are primarily divided into three mainstream technical routes: Spar, Semi-submersible (Semi-sub), and Tension Leg Platform (TLP).
A semi-submersible platform consists of three to four steel buoys with diameters of approximately 10 to 15 meters. Total steel usage is typically between 2,500 and 4,000 tons, with a draft depth of 15 to 25 meters.
These platforms can be assembled in port and then towed to the designated sea area by tugboats at speeds of 3 to 5 knots, saving on expensive deep-sea crane ship rental fees.
Spar platforms increase the draft depth to 80 or even 120 meters through center-of-gravity adjustment, using hundreds of tons of ballast at the bottom to ensure the center of gravity is far below the center of buoyancy. This keeps the pitch angle variation within 3 degrees even when facing 20-meter giant waves.
Platform Type | Steel Usage (Tons) | Draft Depth (m) | Construction Ease | Displacement Control |
Semi-submersible | 3000 - 4500 | 15 - 25 | Very High (Quay Assembly) | Good |
Spar | 2000 - 3500 | 80 - 120 | Moderate (Deep Water) | Excellent |
Tension Leg (TLP) | 1500 - 2500 | 30 - 45 | High (Vertical Anchor) | Outstanding |
Longer Blades
A 15 MW floating wind turbine typically has a rotor diameter between 230 and 260 meters, with a swept area exceeding 50,000 square meters, equivalent to the size of 7 football fields.
A single blade's length exceeds 115 meters and weighs approximately 50 to 65 tons, with the maximum linear velocity at the blade tip reaching over 80 m/s.
At rated wind speeds, one rotation of such a turbine generates enough electricity for an electric vehicle to travel about 50 kilometers.
To adapt to the dynamic swaying of the floating platform, tower heights are usually set at 130 to 150 meters above the water surface, using high-strength carbon fiber reinforcements to reduce overall weight, maintaining the nacelle mass at 600 to 800 tons.
Module Param | 10MW Class | 15MW Class | 20MW Class | Performance Gain |
Rotor Diameter (m) | 190 - 200 | 230 - 240 | 260 - 280 | Swept Area +40% |
Tower Height (m) | 110 - 120 | 135 - 145 | 160 - 170 | Wind Speed Gain +8% |
Swept Area (㎡) | 30,000 | 53,000 | 70,000 | Generation +50% |
Nacelle Weight (T) | 450 - 500 | 650 - 750 | 900 - 1000 | Power Density Opt. |
Robust Mooring
Anchor chain diameters are typically between 120 mm and 180 mm, with a weight per meter exceeding 300 kg and a breaking load requirement of over 15,000 kN.
Seabed anchoring uses gravity anchors, suction piles, or drag anchors depending on geological conditions, with suction piles reaching up to 8 meters in diameter and penetrating 20 to 30 meters into the seabed.
Dynamic cables are another technical challenge, as they must withstand periodic bending and stretching caused by ocean currents.
Currently, 66 kV or 132 kV three-core Cross-Linked Polyethylene (XLPE) cables are externally wrapped with multiple layers of steel wire armor and double-layer lead sheaths to ensure no insulation breakdown under extreme pressures at 500 meters depth, with a design life of up to 30 years.
Mooring Module | Key Parameters | Material Grade | Maint. Cycle (Years) |
Anchor Chain/Rigging | Dia. 140 - 160mm | R4/R5 High-strength Steel | 5 |
Suction Pile | Dia. 6 - 9 m | Q355 Structural Steel | 10 |
Dynamic Cable | 66 kV / 132 kV | XLPE Insulation / Steel Armor | 2 - 3 (Inspection) |
Connecting Shackle | Load 2000 t + | High-alloy Forged Steel | 5 |
Financial Outlook
The current CAPEX for floating wind power is approximately $4,000 to $5,500 per kilowatt. Although higher than the $2,500 for fixed offshore wind, costs are falling rapidly.
By 2030, with large-scale production and the maturity of 18MW+ models, CAPEX is expected to drop below $2,500 per kilowatt.
The LCOE is currently between $120 and $180 per MWh, with future expectations to drop to $50 to $70 per MWh.
For a 500 MW deep-sea project, annual revenue can exceed $180 million. The IRR can be maintained between 10% and 14% with partial subsidies.
Meanwhile, the decommissioning cost of floating structures is only 5% of the initial construction cost, and over 90% of steel and composite materials can be recycled, providing a residual value 15% higher than fixed foundations.
Wave Energy Converters (WEC)
Powerful Waves
Wave energy has an extremely high energy density; the average kinetic energy output per square meter of sea surface is over 20 times that of wind energy for the same area.
In the "Roaring Forties" and "Furious Fifties" of the Southern Hemisphere, the average annual power per meter of wave front can reach 70 kW to 100 kW. Just one kilometer of coastline can generate approximately 70 MW to 100 MW of raw energy.
Wave frequencies are typically between 0.05 Hz and 0.2 Hz, with amplitude fluctuations ranging from 1 to 5 meters. These low-frequency, high-torque physical characteristics provide enormous mechanical potential for energy capture.
Compared to wind energy, waves have better continuity, with power fluctuations within a 24-hour period usually controlled within 20%, far superior to the drastic day-night cycles of solar power.
· The globally exploitable wave energy potential is approximately 2TW to 3TW annually, equivalent to 16,000 TWh to 24,000 TWh of power supply.
· The density of water is approximately 1,025 kg/m³, more than 800 times that of air, making wave energy flow density far exceed that of wind at the same volume.
· The predictability of wave energy is very high, with a 48-hour forecast error rate below 5%, which is beneficial for grid dispatching.
· In premium sea areas like the North Atlantic, the instantaneous peak power of winter waves can exceed 200 kW per meter of wave front.
Durable Machinery
Point absorber devices typically have buoy diameters between 8 and 12 meters, with draft depths of over 20 meters, generating power by capturing vertical heave motion.
Attenuator devices, such as snake-like structures, can reach total lengths of 150 to 180 meters, composed of four cylindrical sections about 4 meters in diameter, working by driving hydraulic pumps through relative rotation between segments.
A conversion device with a single-unit capacity of 750 kW typically weighs between 400 and 600 tons, with ballast mass accounting for more than 45% of the total weight.
The system is designed to survive extreme wave heights of over 25 meters and complex current impacts of over 3 m/s, with structural redundancy typically set at 2.5 times or more.
· The displacement of a single float is set based on the average wave height of the sea area, usually fluctuating between 300 and 800 cubic meters.
· The load capacity of connecting hinges must reach over 5,000 kN to handle instantaneous impact loads during storms.
· Internal counterweights usually use high-density concrete or scrap steel grit, with costs controlled between 500 and 800 RMB per ton.
· Due to high deep-sea operational risks, these devices are usually designed for modular assembly, compressing the offshore installation period of a single unit to within 72 hours.
Efficient Power Conversion
Hydraulic system operating pressures are usually set between 200 bar and 350 bar, using accumulators to balance power fluctuations and convert unstable mechanical energy into rotational energy at a constant speed.
The comprehensive conversion efficiency of this hydraulic transmission can reach 75% to 85%.
For linear motor systems using seawater with permanent magnet flux density requirements of over 1.2 Tesla, an electromagnetic conversion efficiency of over 90% can be maintained even in low-speed reciprocating motions of 0.5 m/s.
Frequency fluctuations of the AC output from a single device are adjusted via converters, eventually connecting to deep-sea combiner boxes at 11 kV or 33 kV, with power transmission losses controlled within 1.5%.
· Accumulator capacity is typically designed to be 1.5 times the system peak flow to smooth wave period pulses of 5 to 15 seconds.
· Hydraulic oil operating temperatures are controlled between 40°C and 60°C, using external seawater circulation for heat exchange cooling.
· Inverter response speeds must reach the millisecond level to ensure total harmonic distortion (THD) of output voltage remains below 3%.
· Underwater transformer efficiency is usually over 98.5%, with shell structures designed to withstand 30 years of hydrostatic pressure.
Corrosion Resistance
The salt spray concentration in deep-sea environments is more than 10 times that on land. Device shells must use high-grade anti-corrosion coatings, typically sprayed to a thickness of over 450 microns.
Fasteners and seals exposed to seawater are uniformly made of 316L stainless steel or duplex steel, with yield strengths exceeding 450 MPa.
The sealing rating must reach IP68 and possess the capability to withstand static pressure at 50 meters depth (0.5 MPa) for 24 hours without leakage.
Underwater cable connectors use wet-mate technology, allowing for connection while energized. The Mean Time Between Failures (MTBF) for a single mating cycle is designed to be over 10,000 hours.
Comprehensive hull cleaning and anti-fouling recoating performed every five years can extend the effective service life of the equipment to over 25 years, with O&M costs accounting for 12% to 18% of annual revenue.
· Anti-corrosion coatings must pass over 3,000 hours of salt spray testing to ensure the coating peeling rate is below 1% during service.
· Sacrificial anode protection blocks are arranged at a density of 4 to 6 units per 100 square meters, primarily made of aluminum alloy.
· The friction coefficient of dynamic seals must be below 0.05 to reduce mechanical energy loss and heat generation during reciprocating motion.
· Underwater inspections are typically executed by Remotely Operated Vehicles (ROV), with a single inspection costing about 2% of the annual budget.
Economic Analysis
The current LCOE for wave energy is approximately $0.3 to $0.5 per kWh, placing it in the early commercialization cost bracket. Costs are expected to drop at a rate of 15% per year as global installed capacity surpasses 1GW.
A typical 20MW wave energy station has an initial CAPEX of approximately $60 million to $80 million.
At sites with an average annual wave power of 40 kW/m, the lifecycle IRR can reach 8.5% to 11%. Average equipment availability has improved from early levels of 65% to over 88%.
Energy output per hectare of sea area is 3.5 times higher than that of similar-scale offshore PV.
· The investment cost per watt is currently between 30 and 50 RMB, with mechanical structures accounting for about 60% of costs.
· The project payback period is usually 10 to 12 years, with a long-term goal to shorten it to under 8 years.
· Residual value recovery of equipment is as high as 90%, primarily due to the reuse value of steel and hydraulic modules.
· The output rate per unit area of a wave energy station is approximately 50 MW to 80 MW per square kilometer, 10 times that of onshore wind.