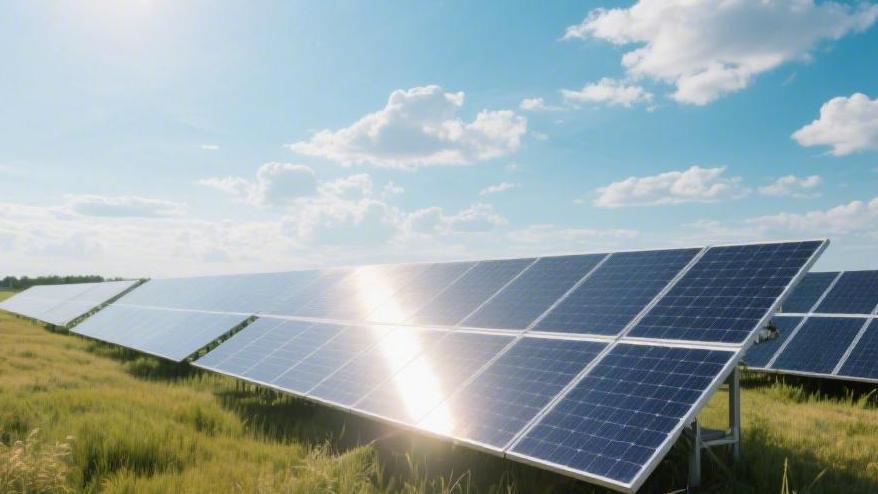
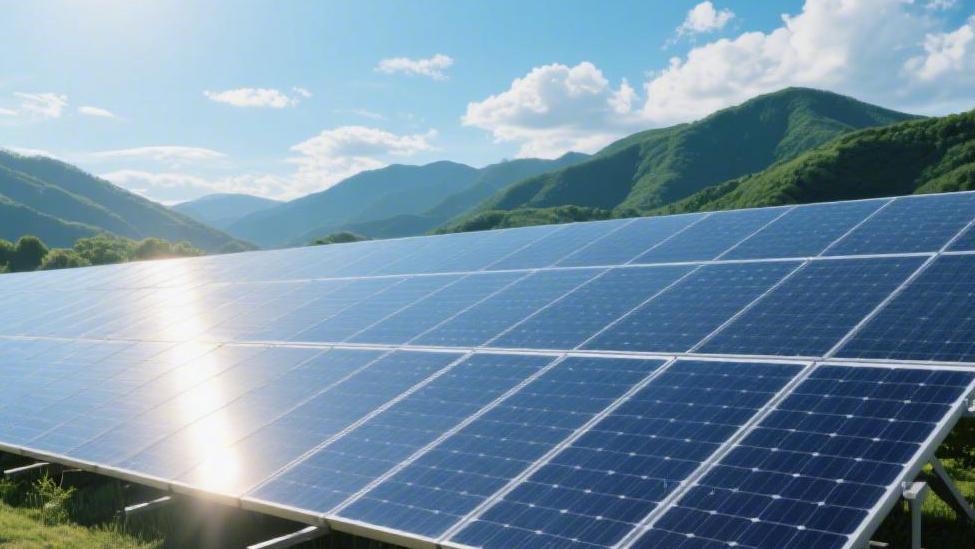
How do solar panels reduce greenhouse gas emissions
Solar panels utilize the photovoltaic effect to convert light directly into electricity.
Every kilowatt-hour of electricity generated reduces carbon dioxide emissions by approximately 0.9 kg compared to coal-fired power.
By replacing fossil fuels, this zero-emission model effectively cuts greenhouse gas emissions at the source.
Reduce Fossil Fuel Use
Replacing Coal
Thermal power plants emit an average of 850 to 1,050 grams of carbon dioxide per kilowatt-hour (1 kWh). In contrast, a standard photovoltaic system—accounting for the entire lifecycle, including silicon mining, module manufacturing, logistics, and 25 years of operation and maintenance—has a calculated emission of only 25 to 48 grams per kWh. The carbon intensity of photovoltaic power is more than 95% lower than that of coal power.
Take a centralized photovoltaic power station with an installed capacity of 100 MW as an example. Assuming an annual utilization of 1,300 hours, the station produces 130 million kWh of electricity annually. If this entire output replaces coal power, it can save approximately 42,000 tons of standard coal per year. Based on the calculation that 1 ton of standard coal produces 2.62 tons of $CO_$2, a single 100 MW station contributes to an annual $CO_$2 reduction of 110,000 tons. Over its 25-year design life, the project can cumulatively reduce greenhouse gas emissions by 2.75 million tons.
Furthermore, the substitution of fossil fuels by photovoltaics is reflected in the reduction of indirect emissions of other greenhouse gases. Methane leakage during coal mining (methane's greenhouse effect is more than 25 times that of $CO_$2), as well as sulfur dioxide (approx. 1.8 g/kWh) and nitrogen oxides (approx. 1.6 g/kWh) produced by coal combustion, will decrease significantly as the proportion of photovoltaics increases.
Currently, the conversion efficiency of monocrystalline modules has exceeded 22.5%. On the same 100 square meters of land, the clean power generated by modern photovoltaic modules is nearly 40% higher than it was 10 years ago, indirectly accelerating the decommissioning of fossil fuel units.
· Substitution Efficiency: The electricity generated by a 1 kW photovoltaic array annually is equivalent to the carbon sequestration capacity of approximately 15 mature trees.
· Emission Reduction Precision: Compared to Combined Cycle Gas Turbine (CCGT) generation, which emits about 400-500 g/kWh, the reduction advantage of photovoltaics remains about 10-fold.
· Energy Return on Investment (EROI): The EROI of modern photovoltaic systems is typically between 20:1 and 30:1, meaning the energy produced over its lifetime is 20 to 30 times the energy consumed to manufacture it.
Reducing Losses
When the power grid transmits electricity generated from fossil fuels, the line loss rate due to resistive heating is typically between 5% and 8%. In remote areas, this figure may even exceed 10%. To provide 100 units of electricity to an end-user, a thermal power plant must burn fuel to produce 110 units, with the extra 10 units turning entirely into additional carbon emissions. Distributed photovoltaics (such as rooftop solar) coincide the generation end with the consumption end, shortening line lengths from hundreds of kilometers to a few meters, keeping AC conversion losses within 3%, and improving overall system efficiency by about 7 percentage points.
If an industrial park installs 5 MW of rooftop solar with an annual generation of about 6.5 million kWh, its self-consumption ratio is usually as high as 80%. This directly reduces about 455,000 kWh of electricity loss caused by long-distance transmission. Based on the current average grid emission factor of 0.57 kg $CO_$2/kWh, the detail of "reducing losses" alone can result in an additional reduction of 260 tons of carbon dioxide annually.
· Transformer Loss: Traditional grids require 3-4 levels of voltage transformation, with a total loss of about 2%; distributed photovoltaics only require one level or direct grid connection.
· Peak Load Matching: The output curve of photovoltaics overlaps by up to 85% with the peak of summer air conditioning cooling (11:00-15:00), reducing incomplete combustion emissions from thermal power plants operating under high loads.
· Power Factor Improvement: Modern photovoltaic inverters are equipped with reactive power compensation, which can maintain the system's power factor above 0.95, further optimizing grid operation efficiency.
Lowering Energy Consumption
On the manufacturing side of photovoltaic modules, the energy consumption for producing 1 ton of high-purity polysilicon has dropped from 150,000 kWh in the past to about 55,000 kWh today. As production increasingly moves to clean energy bases with abundant wind and solar resources (such as Northwest China), the "carbon debt" payback period for manufacturing the panels themselves has been shortened to 1.18 years.
During the 30-year mechanical life of a module, more than 28.8 years are spent making purely negative carbon contributions. Additionally, the operational phase of photovoltaic generation requires almost no water (only twice-yearly cleaning, consuming about 10 cubic meters per megawatt), whereas coal-fired power plants consume about 2 liters of cooling water for every kilowatt-hour generated. This reduction in industrial water usage lowers secondary energy consumption and carbon emissions from water treatment and pumping.
· Silicon Wafer Thickness: Silicon wafers have been thinned from 180 microns to the current 130-150 microns, reducing production energy consumption per wafer by about 20%.
· Degradation Rate: The first-year degradation of mainstream PERC modules is controlled within 2%, with subsequent annual degradation of about 0.45-0.55%, ensuring the long-term stability of emission reductions.
· Recycling Benefits: 90% of the glass and 95% of metals like silver and aluminum in decommissioned modules can be recycled. The energy consumption for recycled aluminum is only 5% of that for primary aluminum production, forming a closed-loop low-carbon cycle.
Low Lifecycle Carbon Footprint
Calculating the Total Account
The carbon dioxide equivalent emissions of photovoltaic modules throughout their lifecycle are approximately between 20 and 50 grams per kWh. In comparison, coal-fired power emits about 1,000 grams of $CO_$2 per kWh, and natural gas emits about 450 grams. Approximately 70% to 80% of the total emissions of a photovoltaic system are concentrated in the manufacturing stage, primarily from the electricity consumed during the purification of polysilicon and the production of modules.
Carbon emissions from the logistics and transportation stage typically account for 5% to 10%, while the operation and maintenance stage—lasting 25 to 30 years—accounts for less than 5%. The lifecycle carbon intensity of current mainstream 182mm or 210mm monocrystalline modules is about 20 to 50 times lower than that of traditional coal power. If a 5 kW home photovoltaic system generates 125,000 kWh over its lifecycle, its total carbon emissions will be approximately 3.1 to 6.2 tons, while the same amount of electricity from thermal power would produce 125 tons of $CO_$2.
· Emission Intensity Comparison: Photovoltaics (20-50 g/kWh), Onshore Wind (11-15 g/kWh), Nuclear (12 g/kWh), Coal (820-1,050 g/kWh).
· Stage Distribution: Polysilicon purification (45%), wafer processing (15%), cell manufacturing (12%), module packaging (8%), system modules and installation (20%).
· Footprint per Unit Capacity: The $CO_$2 emissions produced per 1 Watt of photovoltaic module have dropped from 1.5 kg a decade ago to about 0.6 kg today.
Efficient Manufacturing
The most energy-intensive process in manufacturing solar panels is the reduction and purification of polysilicon, which requires heating industrial silicon to over 1400°C. In the past, using the modified Siemens process to produce 1 kg of polysilicon required 120 to 150 kWh of electricity; advanced processes today have compressed this value to 45 to 55 kWh, an energy consumption reduction of over 60%. Meanwhile, the thickness of silicon wafers has been reduced from 180 microns to 130-150 microns, reducing silicon material consumption per wafer by about 25%, which simultaneously lowers carbon emissions from upstream mining and smelting.
In the manufacturing of cell electrodes, silver paste consumption has also dropped from 110 mg per cell to below 80 mg. Since the mining and smelting of silver is a high-energy process, this reduction in material consumption indirectly reduces the "embodied carbon" of the module. Modern module factories increase the proportion of clean energy in the production process to over 30% by deploying rooftop solar and waste heat recovery systems.
· Purification Efficiency: The output per single reduction furnace has increased from 3-5 tons in the early stages to over 15 tons today, reducing unit energy consumption by about 15%.
· Material Reduction: The weight of aluminum frames has been optimized from 2.5 kg/㎡ to 1.8kg/㎡, reducing the carbon footprint of aluminum materials by about 28%.
· Energy Payback Time (EPBT): Under global average sunlight conditions, photovoltaic modules only need to run for 1.2 to 1.4 years to produce electricity equal to the energy consumed during their entire manufacturing process.
Long-term Usage
The physical lifespan of photovoltaic modules is usually over 25 to 30 years, allowing their initial "carbon debt" to be paid off in a very short time. The first-year degradation rate of mainstream PERC cells is 2%, with the subsequent annual rate controlled between 0.45% and 0.55%. Even in the 25th year, modules can still maintain more than 84% of their initial power.
Over a 30-year operating period, the clean electricity generated by a photovoltaic system is 20 to 30 times its manufacturing energy consumption. This high Energy Return on Investment (EROI) is the technical foundation for achieving net reductions in greenhouse gases. If the cleaning frequency in operation and maintenance is set to once per quarter, the annual electricity consumption for cleaning a 1MW system with high-pressure water guns is less than 500 kWh. Compared to its annual output of 1.3 million kWh, the carbon input on the operational side is almost negligible.
· Power Guarantee: A 25-year linear power warranty ensures the long-term stability of the emission reduction contribution.
· Inverter Efficiency: The conversion efficiency of string inverters reaches over 98.5%, minimizing energy loss during the DC-to-AC conversion.
· Carbon Return Rate: Assuming the module carbon footprint is 30 g/kWh and coal power is 1,000 g/kWh, the carbon return rate for every kWh generated by photovoltaics is 33.3 times.
Recycling and Reselling
Resource recovery after module disposal is the final closed loop in reducing the lifecycle carbon footprint. About 90% of the weight of a photovoltaic module comes from glass, aluminum frames, and polymers, for which recycling technologies for glass and aluminum are already very mature. Through pyrolysis or chemical treatment, more than 95% of silver, aluminum, and semiconductor materials can be recovered from decommissioned modules.
The energy consumption for recycling one ton of aluminum is only about 5% of the energy consumed in primary aluminum production. This recycling of secondary resources can offset 10% to 15% of the initial carbon footprint of the module. As a global recycling system is established, it is expected that by 2030, carbon reductions through recycling will account for a significant portion of the photovoltaic industry's total output.
· Recycling Rate Data: Aluminum frames (100%), glass (over 90%), silver and copper (over 95%), silicon wafers (approx. 85% reusable).
· Carbon Offset Potential: Every ton of decommissioned modules recycled is equivalent to reducing total carbon emissions by approximately 1.2 tons.
· Supply Chain Benefits: The economic return from recycling precious metals like aluminum and silver can cover more than 60% of dismantling costs, lowering the financial threshold for environmental treatment.
Decentralizing the Grid
Current centralized power grids rely on high-voltage lines of 500 kV and above for long-distance transmission. For every 100 kilometers of transmission distance, magnetic field losses and resistive heat losses increase by approximately 1.2% to 2.1%. The average loss rate of the global power grid is maintained at around 7.5%, meaning more than 1.5 trillion kWh of electricity is wasted annually during transit worldwide, equivalent to over 850 million tons of $CO_$2 emissions.
Distributed rooftop photovoltaic systems connect via the 400V low-voltage side, delivering power directly to loads within a 50-meter range, reducing the transmission loss rate to less than 0.3%. For a small factory with an annual electricity consumption of 12,000 kWh, installing a 200 kW photovoltaic array can reduce external power purchases by 85%. By avoiding 960 kWh of annual grid loss from long-distance transmission, it equates to an additional annual reduction of 0.55 tons of carbon dioxide.
Reducing Electricity Loss in Transit
As electricity travels long distances, the process of stepping voltage up and down in transformers produces about 2% in iron and copper losses. The traditional "Power Plant - Step-up Station - High-voltage Line - Step-down Station - Distribution Network" model involves energy dissipation at every level of conversion. The decentralized layout achieved by photovoltaic generation eliminates more than three levels of voltage conversion.
Data shows that for every 1% reduction in grid loss in a ten-million-kilowatt regional grid, 300,000 tons of standard coal can be saved annually. The efficiency of inverters in distributed systems currently generally reaches over 98.5%, and the output current quality can maintain a power factor of 0.99. This high-precision power conversion reduces the displacement of reactive power on the grid and improves the energy transmission efficiency of the entire line.
Performance Parameter | Centralized Coal Grid | Distributed PV Microgrid | Optimization Margin |
Average Transmission Loss | 6.5% - 9.2% | 0.25% - 0.7% | Loss reduced by over 90% |
$CO_$2 Emission Intensity | 900 - 1050g/kWh | 25 - 48 g/kWh | Reduction ratio ~95% |
System Voltage Fluctuation | ±5.0% | ±1.5% | Stability improved by 70% |
Fault Switching Response | 100 - 300ms | 10 - 20 ms | 10x faster response |
Facility Land Use | 15 - 20 acres/MW | 0 acres (using rooftops) | 100% land saving |
Reducing Coal at Peak Times
From 14:00 to 16:00 in the afternoon is the peak electricity consumption period for most cities globally, during which air conditioning loads account for about 40% to 60% of the total load. To fill this power gap, the grid must start gas turbines or old coal-fired units. Decentralized grid architecture is becoming a major player in reducing the carbon footprint of the power system, changing the linear logic of "power plant generates, long-distance transmission, end-user consumes" by mounting generation equipment directly above or next to the electrical load.
Proximity to the User
In the traditional centralized power supply model, after electricity is generated at a large plant, it must pass through step-up transformers, high-voltage transmission lines, multi-level step-down transformers, and a complex distribution network to reach the user. On this physical path spanning hundreds or even thousands of kilometers, Joule loss ($I^2R$) due to wire resistance heating is inevitable. The global average grid line loss rate is typically maintained between 6% and 9%. To provide a household with 1,000 kWh, a distant thermal power plant must generate an extra 60 to 90 kWh to offset losses, with every unit of this extra electricity increasing carbon dioxide emissions.
If distributed rooftop photovoltaics are adopted, the transmission distance is shortened from hundreds of kilometers to dozens of meters. The system integrates directly into the 400V or 10 kV low-voltage end, almost eliminating the energy consumption of high-voltage transmission segments. By moving the source of generation to the consumption end, distributed systems suppress energy loss rates during transmission to an extremely low level of 1% to 2%.
Taking a small industrial zone with an annual consumption of 1 million kWh as an example, by deploying a 2 MW distributed photovoltaic system to achieve 50% self-sufficiency, approximately 30,000 kWh of extra generation demand due to line loss can be saved annually. Based on the average global grid carbon emission intensity of 0.5 kg $CO_$2/kWh, avoiding transmission loss alone allows the industrial zone to reduce emissions by an additional 15 tons of carbon dioxide annually.
Loss Item | Traditional Centralized Supply (Loss Rate) | Distributed PV Supply (Loss Rate) |
High-voltage Step-up | 0.5% - 1.0% | 0 (No step-up required) |
Long-distance Lines | 3.0% - 5.0% | 0.1% - 0.5% (Very short) |
Multi-level Step-down | 1.5% - 2.5% | 0.5% - 1.0% (Single stage) |
Terminal Distribution | 1.0% - 1.5% | 0.4% - 0.8% |
Total Loss | 6.0% - 10.0% | 1.0% - 2.3% |
Peak Shaving
The greenhouse gas emission intensity of a power system is not fixed; it fluctuates sharply with changes in electricity load. During the peak consumption period from 11:00 to 15:00, the grid often needs to start backup "peaking" units (usually small gas turbines or old coal units) that are less efficient and have extremely high carbon emissions. The carbon emissions per kWh of these peaking units are more than 20% higher than those of base-load units. The output curve of distributed photovoltaics almost perfectly overlaps with the peak cooling electricity demand of the commercial and industrial sectors in summer. This natural matching allows the grid to receive the most timely supplement when electricity is most scarce.
When thousands of distributed rooftops output at full power in the afternoon, the overall load pressure on the grid drops significantly, thereby avoiding the start-up frequency of high-pollution backup power sources. Research data shows that in areas where the penetration of distributed photovoltaics reaches 20%, the grid's dependence on fossil fuel peaking units in the afternoon is reduced by about 40%.
An office building with 100 kW of solar can not only support more than 60% of its own air conditioning load during a summer afternoon but also feed excess power back to the surrounding grid. This "peak shaving" behavior does more than just save money; more importantly, it eliminates the most carbon-intensive portion of the electricity supply, causing the average carbon content per unit of electricity to drop to its lowest point of the day when demand is highest.
Time Period Indicator | Pure Thermal Power Stage | PV Integrated Stage |
Typical Load (MW) | 800 (Peak) | 800 (Peak) |
Peaking Unit Output | 150 MW (High Emission) | 0 - 20 MW (Extremely Low) |
Carbon Intensity | 850 g $CO_$2/kWh | 520 g $CO_$2/kWh |
Frequency Deviation | High Fluctuation | More stable via Inverters |
Self-Balancing
Decentralized photovoltaic systems are often paired with Cell Energy Storage Systems (BESS) to form microgrids, a combination that further increases the depth and precision of emission reductions. A typical home system with 5 kW of solar and 10 kWh of storage can increase its self-consumption rate from 30% for pure solar to over 70%. During the strongest midday sunlight, excess clean electricity is stored in lithium batteries instead of being wasted; in the evening, after sunset during the secondary peak of electricity consumption, the batteries begin to discharge, accurately replacing the grid's heaviest reliance on fossil fuels at night.
From the perspective of hardware assets, decentralization also means fewer substation expansions and cable laying. Manufacturing one ton of electrolytic aluminum for conductors or one ton of transformer steel emits large amounts of carbon dioxide. Because distributed photovoltaics solve energy needs locally, the cycle for grid upgrades can be extended from 5 years to over 10 years. This slowing of infrastructure construction reduces the consumption of high-carbon industrial materials like cement and steel. A community with microgrid capabilities can achieve more than 90% energy independence, improving the physical utilization efficiency of heavy grid equipment by 30% and reducing unnecessary energy loss caused by equipment redundancy and no-load operation.
Community Microgrid Parameter | Value | Emission Reduction Explanation |
PV Installation Ratio | 1.2 : 1 (Installed/Load) | Ensures sufficient output even on cloudy days |
Storage Cycle Efficiency | 90% - 95% | Extremely low energy storage loss |
Demand Response Speed | < 20 ms | Reduces energy consumed by grid regulation |
Transformer Heat Loss Reduction | 15% - 25% | Lower current leads to cooler, more efficient operation |
Through this fragmented and distributed layout, solar panels are no longer just simple generation tools, but intelligent regulators distributed at the ends of the power consumption chain. This approach eliminates the carbon cost of transmission distance, dissolves the foundation for high-pollution peaking plants, and optimizes the resource intensity of heavy grid infrastructure, thereby compressing the carbon footprint of the power industry at both the micro and macro levels simultaneously.