Photovoltaic Cell Maintenance: 5 Routine Checks for Longevity
Maintain PV longevity: quarterly dust cleaning cuts resistance 20%, tighten terminals to 1.2Nm against oxidation, monitor inverters for >45°C alerts, trim shade-causing weeds below 30cm, and monthly test output deviation staying under 5% of rated value.
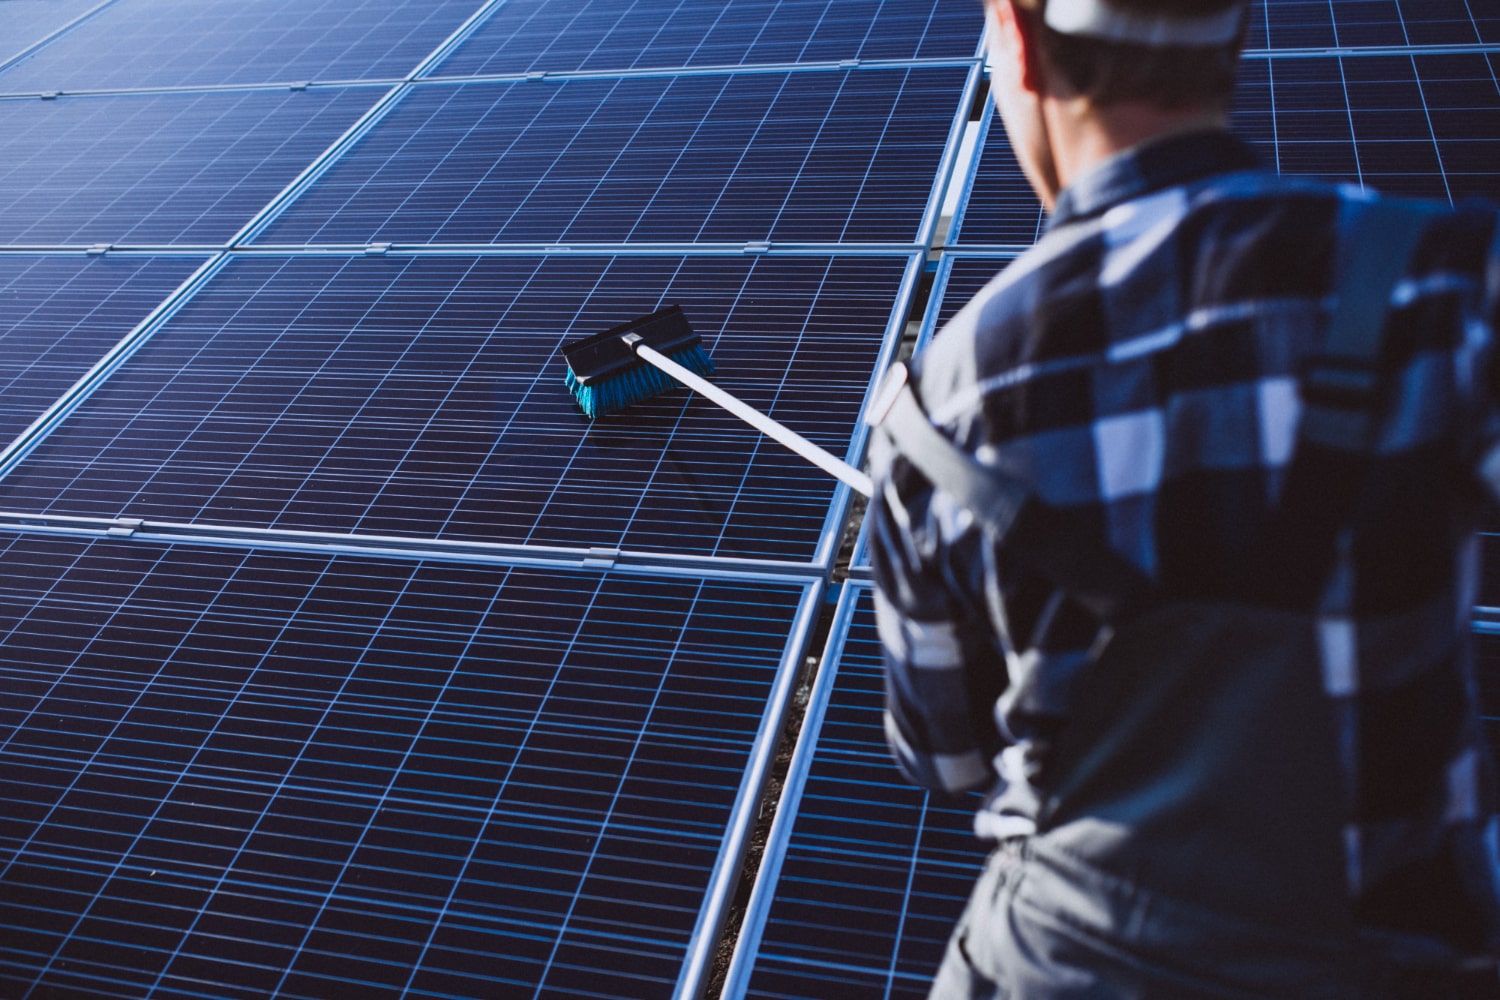
Cleaning Panel Surface
Research from the National Renewable Energy Laboratory (NREL) shows that soiling—the accumulation of dirt, pollen, and bird droppings—can reduce panel efficiency by 5% on average, and by over 20% in arid or high-pollution environments. For a typical 6 kW residential system, a 5% loss equals nearly 30 kWh of lost production per month, which translates directly into higher electricity bills.
· Remove light-blocking contaminants like dust, pollen, and organic stains.
· Prevent permanent physical damage to the anti-reflective glass coating.
· Use the correct materials and methods to avoid reducing the panel's lifespan.
Over time, this can lead to a permanent 2-3% decrease in efficiency even when the panel is clean. The only tools you need are a soft, non-abrasive sponge or a brush with plastic bristles and a mild, soap-free cleaning solution. A few drops of dish soap in a 5-gallon (19-liter) bucket of water is sufficient; excess soap can leave a film that also attracts dust.Timing and technique are equally important for safety and effectiveness. Always clean your panels early in the morning, in the evening, or on a cool, overcast day. Spraying cold water on panels that are hot to the touch (above 77°F or 25°C) can cause thermal shock and crack the tempered glass.
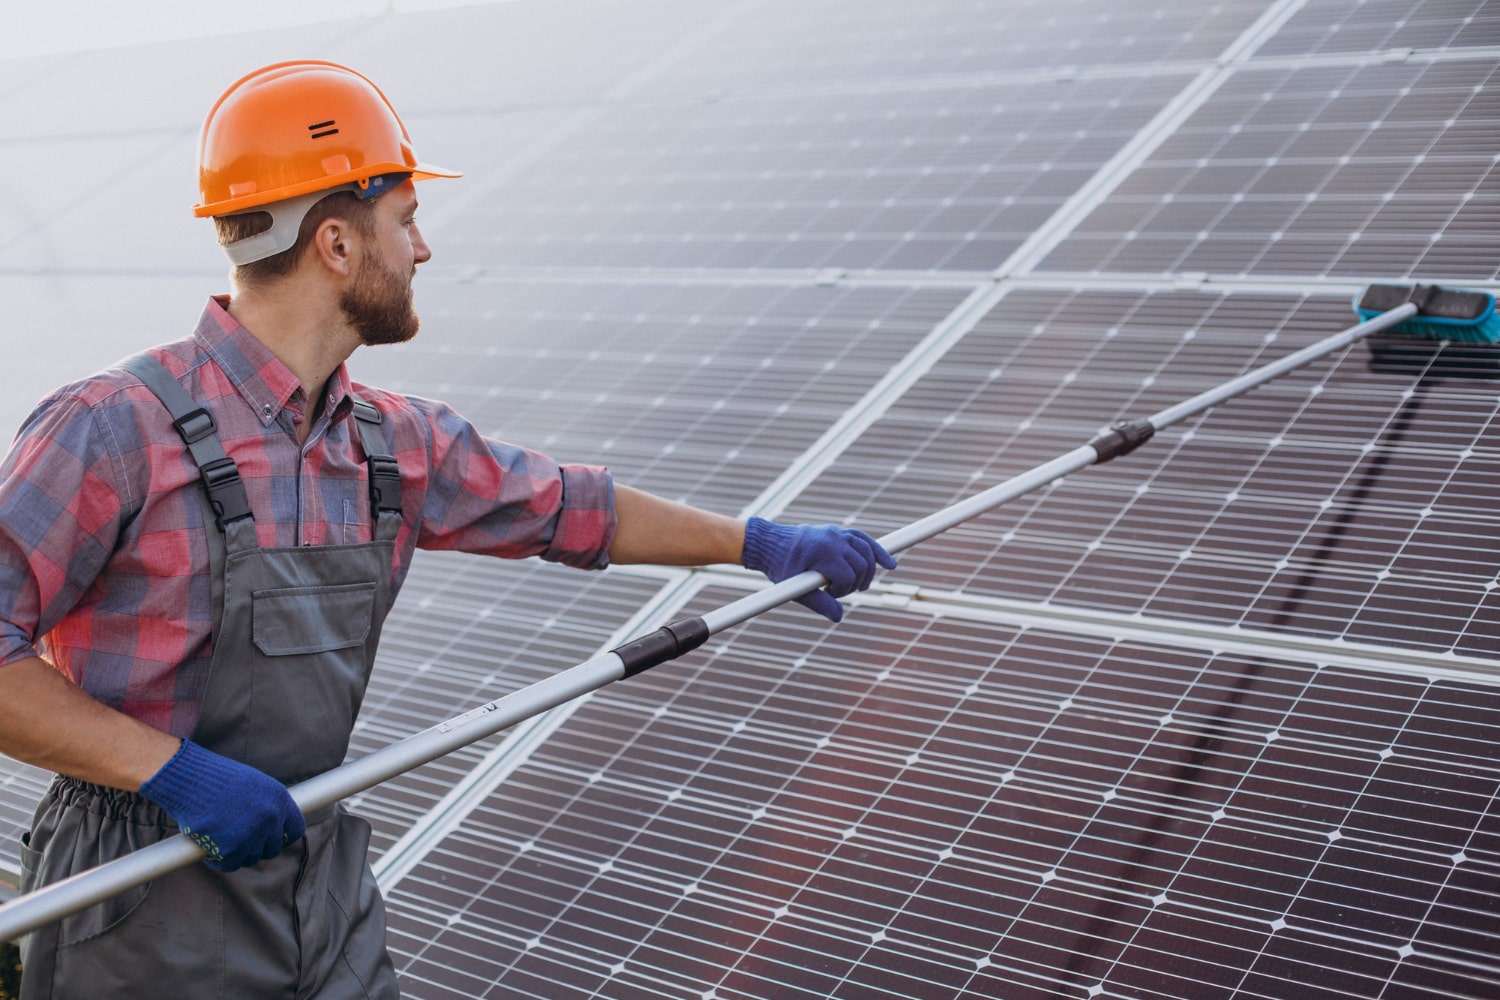
For ground-mounted arrays or easily accessible single-story roofs, a hose with a fan-spray nozzle attached to a telescopic pole is often all that is needed. This method uses approximately 2 to 5 gallons of water per panel for a thorough clean.Systems in areas with low rainfall (less than 20 inches or 50 cm annually) or high pollen/dust levels may require cleaning every 3 to 6 months. Panels installed at a 15-degree tilt or greater benefit from more effective rainwater self-cleaning and may only need an annual service. A simple visual inspection every season is the best guide. If you can see a distinct film of dirt or bird droppings covering more than 5% of a panel's surface, it's time to clean.
Checking for Cracks or Hot Spots
A single microcrack, often invisible to the naked eye, can reduce a panel's power output by 1-3%. More critically, these cracks create resistance, causing specific cell areas to overheat. These hot spots can reach temperatures exceeding 70°C (158°F), far above the normal operating temperature of 45-50°C (113-122°F). This thermal stress permanently degrades the silicon cells and the ethylene-vinyl acetate (EVA) encapsulation layer at a rate of ~1.5% to 3% per year in the affected area, compared to the typical 0.5% annual degradation for a healthy panel. Left unchecked, a significant hot spot can lead to a >20% power loss in the panel and, in extreme cases, pose a fire risk. Proactive inspection focuses on identifying two key issues:
· Visible physical damage: including hairline cracks, snail trails, and shattered glass.
· Invisible thermal anomalies: which are hotspots indicating internal cell damage.
The most accessible method for a homeowner is a simple visual inspection, best performed in the early morning or late afternoon when the sun is low. The low-angle sunlight creates shadows that make fine cracks more visible. Put on gloves to avoid touching the hot glass and carefully examine each panel. Look for hairline cracks, often appearing as thin, irregular lines. Another common visual indicator is "snail trails," which are dark, wispy discoloration patterns that develop over microcracks after 6-18 months of thermal cycling. These trails are caused by moisture ingress and silver oxidation. If you find a panel with a crack that casts a shadow wider than 2 millimeters, it is likely already causing a measurable performance drop.
For context, a crack affecting just 8% of a cell's surface area can reduce that cell's current output by over 50%.For a definitive diagnosis of problems that are invisible to the eye, you need a thermal imaging camera. These devices detect the infrared radiation emitted by overheated cells. A healthy panel will show a relatively uniform temperature distribution, with variations of less than ±5°C (9°F) across its surface. A faulty cell with high resistance will appear as a bright yellow, orange, or red spot—a hot spot—significantly hotter than the surrounding cells. The most critical time to perform a thermal inspection is when the panels are under a load of at least 700 W/m² of solar irradiance, typically around solar noon on a clear day. The temperature differential (ΔT) between a hot spot and the healthy cells is the key metric. A ΔT of 10-15°C (18-27°F) indicates moderate degradation, while a ΔT exceeding 20°C (36°F) signifies serious damage that requires immediate attention.
Inspection Method | Required Tool | Best Time for Inspection | Key Metric to Measure | Detection Capability |
Basic Visual Check | Eyesight (safety gloves) | Early morning / Late afternoon | Crack width > 2 mm | Major cracks, snail trails, glass breakage |
Advanced Thermal Scan | Thermal Imaging Camera | Solar noon (High irradiance) | Temperature differential (ΔT) > 10°C | Internal cracks, faulty bypass diodes, cell defects |
Upon confirming a significant crack or hot spot, your action plan depends on the severity. For a minor crack without visible hot spots, the performance impact may be minimal (<3% power loss for that panel), and monitoring may be sufficient. However, for any defect causing a hot spot, the bypass diodes within the panel's junction box become critical. A modern panel typically has 3 bypass diodes, each protecting a substring of about 20 cells. If one substring fails, the corresponding diode activates, but you lose one-third of the panel's power output (~33%).
The cost of a professional thermal inspection service ranges from 250 to 500 for a typical residential array. Weigh this one-time cost against the potential 15-30% annual energy loss from a single faulty panel, which could represent 50−150 in lost savings per year, making the inspection a sound investment within a 2-3 year payback period. For a panel with severe damage, replacement is often the only option, with current costs for a 400W panel ranging from 200 to 400, plus 300to600 for professional installation.
Monitoring for Shading from Growth
In reality, for older string inverter systems, shading as little as 10% of one panel's surface can slash the power output of the entire string by 30 to 40%. This is because the current is limited by the performance of the weakest panel in the series. Even with modern module-level power electronics (MLPEs) like microinverters or power optimizers, which mitigate this string-level loss, a shaded panel itself can experience a localized power loss exceeding 90%. For instance, a single branch casting a shadow measuring just 6 inches (15 cm) wide and 3 feet (1 meter) long on a panel during peak sun hours can cause that specific panel to lose over 50% of its potential energy generation for that period.
The impact of shading is not linear and varies dramatically based on the vegetation type, growth rate, and time of year. A fast-growing species like a willow or poplar tree can grow 4 to 6 feet (1.2 to 1.8 meters) per year, potentially casting new shadows on your array within a single season. Deciduous trees pose a unique challenge: while they may provide beneficial shade in the summer, their bare branches in winter, when the sun is at a lower 25-degree angle in the sky, can still create unexpected shadows that fall directly on panels. You need to monitor not just the current clearance but project the growth over the next 6 to 12 months. The critical measurement is the lowest point of the sun's path during the winter solstice (around December 21st in the Northern Hemisphere).
A clear line of sight to the horizon at that time ensures maximum production on the shortest days of the year. For a typical 6 kW system, a 20% production dip in winter due to unexpected shading could mean a loss of roughly 6-8 kWh per day, equating to 1.00−1.50 daily at average electricity rates.Establishing a precise monitoring and maintenance schedule is key to mitigating losses. The most effective tool is your system's own production data, reviewed through its monitoring platform. Set a baseline for expected production on a clear day for each month. A deviation of more than 10-15% from this baseline on a sunny day is a strong indicator of a new issue, with shading being a prime suspect. Physically inspect the array's sightlines during the two hours before and after solar noon (approximately 10 AM to 2 PM standard time) at least once per season. Pay close attention to the southern skyline (in the Northern Hemisphere) for any obstructions. For trees that are on your property, the solution is straightforward trimming. The cost for professional tree trimming to clear a solar array typically ranges from 300to800, a one-time expense that can protect 150−300 of annual energy production, yielding a full return on investment in 2 to 3 years.
The most critical action is to create and maintain a "solar window"—a clearance zone extending at least 10 feet (3 meters) beyond the physical dimensions of your array in all directions. This buffer accounts for the sun's 15-degree daily arc and 47-degree seasonal variation in the sky, preventing early morning, late afternoon, and low-angle winter sun from being blocked.
Ensuring Mounts and Wiring are Secure
A racking system must resist wind uplift forces that can exceed 40 pounds per square foot (190 kg/m²) during a 90 mph (145 km/h) wind event. More insidiously, thermal expansion and contraction from daily temperature swings of 30-40°C (54-72°F) can cause metal fasteners to loosen by a few millimeter over 5-7 years. On the electrical side, a loose DC connection with a resistance of just 0.1 ohms—barely measurable with a standard multimeter—can dissipate over 40 watts of power as heat at peak output, creating a potential fire hazard and eroding energy production. The following table outlines the critical modules to assess.
Inspection Area | Key Modules to Check | Recommended Frequency | Critical Parameter / Tool | Associated Risk |
Structural Mounts | Rails, L-brackets, lag bolts, mid-clamps, end-clamps | Biennially (Every 2 years) | Torque wrench (e.g., 25-30 ft-lbs for lag bolts) | Physical collapse, panel damage |
Electrical Connections | MC4 connectors, junction boxes, inverter terminals | Annually | Infrared thermometer (check for >10°C ΔT) | Arc faults, fire, power loss |
Conduit & Cabling | Cable jackets, conduit integrity, wire chafing points | Annually | Visual inspection for UV damage or animal bites | Short circuits, ground faults |
For roof-mounted systems, check the flashings around the stanchions for any signs of water intrusion or corrosion. Using a calibrated torque wrench, verify the tightness of a sample of lag bolts or structural screws, which typically require a torque between 25 and 35 foot-pounds (34-47 Nm), as specified by the racking manufacturer. A bolt that has loosened by just 15% can reduce its clamping force by over 30%, significantly compromising its holding strength. Next, inspect the mid-clamps and end-clamps that secure the panels to the aluminum rails. These should be snug, with a typical torque specification of 15-20 in-lbs (1.7-2.3 Nm). A loose clamp allows the panel to move 1-3 millimeters laterally, which, over tens of thousands of thermal cycles, can abrade the panel frame and create noise.
For ground-mounted systems, also check for corrosion at the base of the posts, especially if the galvanized coating has been compromised, which can reduce the steel's lifespan by 40-50% in a corrosive environment.The electrical connections represent the highest immediate risk and require careful, safe inspection. The primary goal is to identify loose terminals or damaged connectors that create high resistance. The safest way to do this without direct electrical contact is by using an infrared (IR) thermometer gun or thermal camera. Perform the scan during a period of high output, ideally when the system is producing at least 80% of its rated power.
Reviewing Your System's Energy Output
A well-functioning, 6-kilowatt (kW) system in a sunny climate should generate between 750 and 900 kilowatt-hours (kWh) per month on average. However, a 5% deviation from expected output can be an early warning of issues like shading, soiling, or module failure. Modern monitoring platforms provide granular data, allowing you to track performance in real-time. The key is to move beyond just looking at the total daily energy and learn to analyze the shape of the production curve on a clear day.
Data Point to Review | Monitoring Frequency | Normal Range / Pattern | Investigation Threshold |
Daily Energy (kWh) | Daily / Weekly | Consistent with seasonal expectations (e.g., ±15% of last year's same-month data) | A consistent drop of >10% for 3+ consecutive sunny days |
Peak Power (kW) | On clear, sunny days | Should reach 80-90% of the system's DC rating (e.g., ~5.2 kW for a 6.0 kW system) | Peak power consistently below 80% of the system's rated capacity |
Performance Ratio (PR) | Monthly | Typically between 75%-85% (varies by system and location) | A drop of more than 5 percentage points from the system's baseline PR |
The first and most critical step is to establish a performance baseline for your system, which is typically its output during the first 12 months of operation. This baseline accounts for your specific location, panel orientation, and inverter efficiency. After this first year, you can expect a gradual degradation in output; high-quality panels typically degrade at a rate of 0.3% to 0.5% per year. This means a 6 kW system might produce about 30-40 kWh less in its second year than in its first. The most practical way to monitor this is by using the system's own Performance Ratio (PR), a metric calculated as the ratio of the actual energy produced to the theoretical maximum possible under ideal conditions. If your monitoring app doesn't show PR directly, you can approximate it by comparing your system's actual daily kWh output to the estimated production provided by a tool like PVWatts Calculator.
A sustained drop in PR of more than 5% (e.g., from 82% to 77%) is a strong signal that the system's efficiency has decreased due to dirt, shading, or an equipment issue.When analyzing data, you must differentiate between seasonal variations and genuine performance issues. Production will naturally be 40-60% lower in December and January compared to June and July in the Northern Hemisphere due to shorter days and a lower sun angle. Therefore, the most accurate comparison is to look at the same month year-over-year. For example, if your system produced 920 kWh in July of last year but only 820 kWh this July—a 10.9% decrease—and the weather was similarly sunny, you have a clear indicator of a problem.
A curve with sharp, erratic dips and spikes, especially during peak production hours, can indicate shading from new growth, faulty Maximum Power Point Tracking (MPPT), or connection problems. Many modern inverters will log error codes for events like arc faults or ground faults, which you can cross-reference with these production dips.Taking action based on the data is the final step.