What time of day are solar panels most efficient
Solar panels operate at peak efficiency during the solar noon window, typically between 11:00 AM and 2:00 PM, when the sun reaches its highest point and sunlight strikes the photovoltaic cells perpendicularly, minimizing reflection.
During this prime timeframe, solar irradiance often hits 1,000 watts per square meter, allowing a standard residential array to generate approximately 40% to 50% of its total daily energy output within just three hours.
However, true peak performance occurs when high solar intensity combines with cooler air temperatures, as silicon cells experience a power loss of roughly 0.35% to 0.40% for every degree Celsius the panel temperature rises above 25°C, meaning a clear spring day often yields higher instantaneous power than a scorching summer afternoon.
Golden Time
Golden Four Hours
The power generation curve of most photovoltaic systems follows a normal distribution (bell curve), and the core production capacity is actually compressed into the short 4 hours from 10 AM to 2 PM.
Within this time window, the so-called "Solar Noon" is the absolute peak point for energy burst.
At this time, the sun is at the highest point in the sky, and the path of light through the atmosphere is the shortest, reaching the physical "Air Mass AM1.5" standard.
Field monitoring data shows that the cumulative irradiation during these four hours can typically reach 4.5 kWh to 6.5 kWh per square meter, accounting for 65% to 75% of the total daily power generation.
If you install a standard 6.6 kW household system, the AC output power of the inverter during this period will maintain a high range of 5,000W to 5,500W for a long time, delivering more than 5 kWh of electricity per hour to the grid or household loads, while the remaining 20 hours combined might only contribute the remaining 30% of production.
For tracking bracket systems (Trackers), this 4-hour plateau period will be wider, and the utilization rate can be further increased by 15% to 25%.
Secrets of Full Load
On a clear summer day at noon, the solar power density received at the Earth's surface will be infinitely close to the 1000 W/m² defined by Standard Test Conditions (STC).
A module with a nominal power of 400W has a current (Imp) of approximately 10A to 11A and an operating voltage (Vmp) between 38V and 41V.
Only during these few hours at noon can the actual current truly reach the full load state of 10 A.
In contrast, the irradiance at 9 AM might only be 600 W/m². At this time, the output current of the same module will linearly decay to about 6A, and the power will instantly drop to 240W, which is only 60% of the rated value.
During this period, the spectral distribution is also most complete, with the highest proportion of visible light with wavelengths between 380 nm and 780 nm.
The spectral response of silicon-based cells to this part of the spectrum is in the peak range of 0.9 to 1.0, and the External Quantum Efficiency (EQE) reaches its limit.
Peak Clipping and Valley Filling
During the golden hours, you will often see a "flattened" power curve on the monitoring app; this is the "clipping" phenomenon of the inverter.
For cost-effectiveness, installers usually configure the total DC module power to be larger than the inverter's AC rated power. A common DC/AC ratio is 1.2:1 to 1.3:1.
For example, if 6.6 kW of modules are connected to a 5 kW inverter, at 12 PM, the DC power generated by the modules might reach 5,800 W, but the inverter can only output 5,000 W. The excess 800 W of energy is forcibly discarded and dissipated as heat.
Although it seems like a waste, this configuration allows the system's voltage and power to reach the inverter's high-efficiency operating zone faster during off-peak hours such as 9 AM and 3 PM, which can actually increase the total annual power generation by 3% to 5%.
As long as the clipping loss is controlled within 1% to 2% of the annual total production, this design is economically worthwhile.
Orientation Matters
South Orientation is Supreme
When installing a photovoltaic system in the Northern Hemisphere, finding the "True South" azimuth (Azimuth 180°) is the physical law for obtaining the maximum annual power generation.
Measured data shows that when the panel azimuth is set to 180 degrees, the total Global Horizontal Irradiance (GHI) received by the system throughout the year reaches 100% of the theoretical peak.
Once the azimuth shifts toward the East (90°) or West (270°), the total power generation typically drops by 15% to 20%.
For a standard 10 kW system with an annual output of 12,000 kWh, a 20% loss simply due to incorrect orientation means 2,400 fewer units of electricity generated each year.
Calculated at an average electricity price of $0.15/kWh, the cumulative economic loss over a 25-year system life cycle would be as high as $9,000.
It is worth noting that there is a Magnetic Declination between the "Magnetic South" indicated by a compass and the "True South" on a map. In some high-latitude areas, the deviation can reach 15 to 20 degrees.
This error must be corrected during installation; otherwise, it will unintentionally cause an efficiency loss of 3% to 5%.
Reference values for annual power generation efficiency at different orientations (Northern Hemisphere):
· True South (180°): 100% (Baseline)
· Southeast/Southwest (135/225): 95% - 96%
· True East/True West (90°/270°): 80% - 85%
· True North (0°): <60% (Usually not recommended for installation)
Accurate Angle Calculation
The Tilt Angle of the panels mainly depends on the local latitude. Generally speaking, setting the tilt angle to be equal to the local latitude value can achieve the best balance for the whole year. For example, in Los Angeles at 34 degrees north latitude, a 34-degree tilt angle can ensure that the total radiation received throughout the year is maximized.
If pursuing extreme seasonal optimization, the optimal tilt angle for winter should be "latitude + 15 degrees" to capture the low-angle winter sun; for summer, it should be adjusted to "latitude - 15 degrees" to adapt to the high sun overhead.
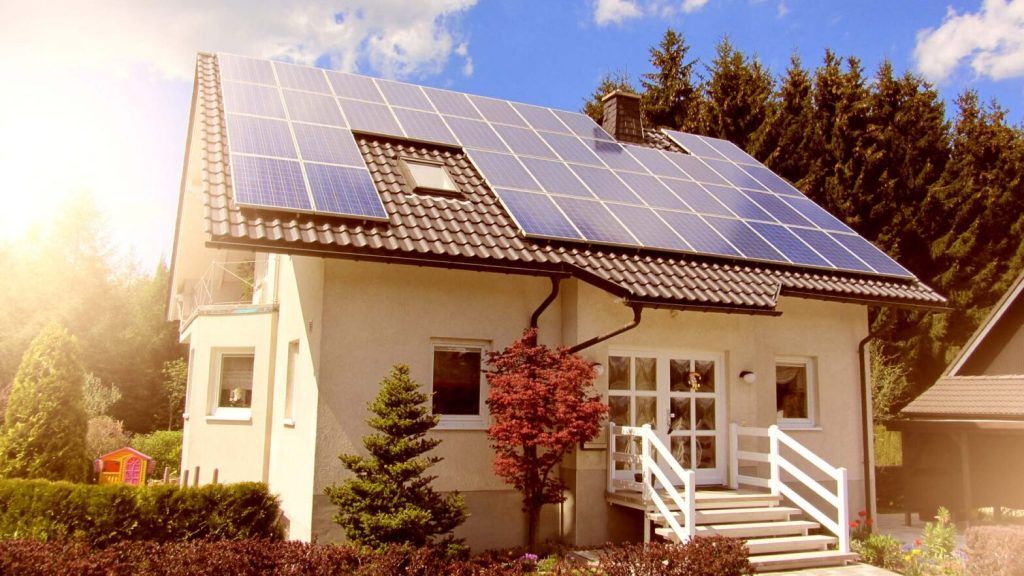
However, in most residential rooftop projects, adjusting the bracket angle is unrealistic, and "Flush Mount" is usually adopted, where the tilt angle depends on the roof slope, generally 15 to 25 degrees (corresponding to a 4/12 to 6/12 roof pitch).
Although this angle is shallower than the optimal latitude angle and prone to Soiling Loss, its performance at noon in summer is actually better than that of high-tilt systems.
Data shows that for regions below 40 degrees latitude, changes in the tilt angle between 15 and 40 degrees generally limit the impact on total annual power generation to within 5%. This small physical loss is well within the acceptable engineering error range.
East-West Shift
With the popularization of "Time-of-Use (TOU)" electricity pricing policies, simply pursuing total power generation is no longer the only financial formula.
Many power companies set expensive Peak Rates between 4 PM and 9 PM, with rates potentially as high as $0.50/kWh, while the rate during the noon period is only $0.20/kWh.
Although the total daily output of West-facing panels is 15% lower than that of South-facing ones, their peak power generation is delayed until 3 PM to 6 PM, which perfectly covers the high-priced electricity periods.
By building an "East-West Array," for example, facing 50% of the panels East and 50% West, although the peak power at noon is sacrificed, the power generation window throughout the day is greatly widened, increasing the power generation at 8 AM and 6 PM by more than 20% respectively.
This layout also reduces the instantaneous load pressure on the inverter, allowing the use of a smaller capacity inverter (increasing the DC/AC ratio to 1.4 or even 1.5), thereby saving initial equipment investment costs.
Chasing the Sun
Fixed bracket systems can never solve the problem of "Incident Angle Modifier (IAM) loss." When the angle between sunlight and the glass surface exceeds 60 degrees, the reflectivity rises sharply.
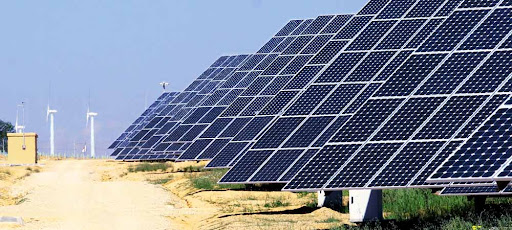
The "Single-Axis Tracker" commonly used in ground power stations drives modules to rotate from east to west through a motor, always keeping the panels perpendicular to the sun's rays, which can keep the incident angle within the optimal range of 0 to 10 degrees.
Compared with fixed south-facing systems, the annual power generation of a single-axis tracking system can be increased by 25% to 35%.
In summer, a tracking system can reach 80% of full power output as early as 7 AM and maintain the high power state until 6 PM, forming a wide "square wave" generation curve instead of the traditional "bell" curve.
Although the mechanical maintenance costs (O&M) of a tracking system are $0.01 to $0.02 higher per watt, and the land area needs to be increased by 40% to avoid inter-row shading (Backtracking Algorithm), in areas where land costs are low and solar resources are abundant (DNI > 2000 kWh/m²/y), its Levelized Cost of Energy (LCOE) is often lower than that of fixed brackets.
Temperature
Worse When Hotter
The power temperature coefficient of most P-type monocrystalline PERC cells is between -0.35%/°C and -0.40%/°C.
The baseline temperature for the STC standard is 25°C, but this is an ideal state that is almost impossible to maintain in real-world operation.
When the outdoor ambient temperature reaches 30°C, the operating temperature of dark, heat-absorbing panels under direct sunlight is usually 25°C to 35°C higher than the ambient air temperature.
On a summer afternoon, the internal temperature of a module can easily soar to 65°C. Subtracting the baseline 25°C from 65°C, the temperature difference is 40°C.
If the coefficient is -0.35%/C, then the total power loss is 40 multiplied by 0.35%, which equals 14%.
A panel with a nominal power of 400 W has its upper limit physically locked at 344 W just due to heating.
This 56 W of power is not blocked by clouds; it is directly lost in the form of heat energy. For an 8 kW system consisting of 20 modules, this thermal loss instantly devours 1.12 kW of capacity, losing more than 1 unit of electricity per hour.
The temperature coefficient of open-circuit voltage (Voc) is usually worse than the power coefficient, reaching about -0.28%/°C.
When the cell temperature rises from 25°C to 75°C (common conditions in Arizona or inland Australia), the original 40 V open-circuit voltage will drop by 5.6 V to 34.4 V.
If your inverter's minimum MPPT working voltage window is set at 200V, and the 6 modules originally connected in series can provide 240V at room temperature, the total voltage at high temperatures might drop to 206V, hovering on the edge of the inverter shutting down.
Once the voltage drops below the lower limit, the output power of the entire string of modules drops to zero, and the efficiency loss is 100%.
Leave Enough Gap
According to data models from Sandia National Laboratories, modules installed with an Open Rack ground mount generally have an operating temperature only about 20°C higher than the ambient temperature due to smooth air circulation at the backplane.
However, if it is a Flush Mount installation close to the roof, and the gap between the back of the panel and the roof tiles is less than 3 inches (about 7.6 cm), hot air will be trapped at the back, forming a heat island effect, causing the module operating temperature to be 35°C or even 45°C higher than the environment.
Measured data shows that increasing the installation gap from 2 inches to 6 inches (about 15 cm) can use the Stack Effect to let natural wind carry away heat from the back, reducing the average cell operating temperature by 10°C to 15°C.
This 15°C temperature difference can directly recover about 5.25% of power generation efficiency.
In a system with a 25-year life cycle, this 5% efficiency improvement means an extra 15,000 kWh of electricity (for a 10 kW system).
At $0.15/kWh, this physical modification of adjusting the installation height alone can create an additional $2,250 in value.
In addition, dark roofs (such as asphalt shingles) absorb more thermal radiation than light-colored roofs (such as white TPO membranes), further heating the module backplane.
On a black asphalt shingle roof, without a sufficient air convection layer, the local air temperature behind the backplane can exceed 80°C at noon.
This long-term high-temperature baking not only reduces immediate power but also accelerates the yellowing of EVA film and backplane aging, shortening the module's original expected lifespan of 25 years to 18 or 20 years.
Installation Type | Airflow | Average Temperature Rise (ΔT) | July Noon Cell Temperature (Air 35°C) | Efficiency Loss (Coefficient -0.35%) |
Ground Dual-Axis Tracking | Excellent (Ventilated on all sides) | +18°C | 53°C | -9.8% |
Ground Fixed Bracket | Good (Open back) | +22°C | 57°C | -11.2% |
Roof Bracket (Gap > 15 cm) | Fair (Natural convection) | +28°C | 63°C | -13.3% |
Roof Bracket (Gap < 8 cm) | Poor (Heat accumulation) | +38°C | 73°C | -16.8% |
Building Integrated PV (BIPV) | Very Poor (No ventilation) | +45°C | 80°C | -19.2% |
Choose Materials by Coefficient
If you live in Nevada, the Middle East, or any place where the average annual temperature exceeds 25°C, the most important parameter when purchasing modules is not conversion efficiency, but the temperature coefficient.
Traditional P-type polycrystalline modules have the worst temperature coefficient, about -0.40%/°C to -0.43%/°C. Currently, mainstream N-type TOPCon cell technology has optimized this value to around -0.30%/°C.
The best performers are Heterojunction (HJT) technology, whose temperature coefficient can be as low as -0.26%/°C or even -0.24%/°C.
Under high-temperature conditions of 65°C (40°C temperature rise), the power loss of HJT modules is only 10.4%, while ordinary PERC modules lose as much as 14%.
With the same nominal 400W, the actual output of HJT modules at high temperatures is 14.4W higher than PERC.
For a 10 kW system, this seemingly small difference in coefficient can bring nearly 400 W of additional power output during high-temperature periods.
Although the price per watt of high-end HJT or IBC (Interdigitated Back Contact) modules may be $0.05 to $0.10 more expensive than ordinary modules, in high-temperature regions, this premium can usually be recovered within 4 to 5 years through the extra electricity generated in summer.
Especially when electricity prices are at peak TOU rates (which is usually also when temperatures are highest and air conditioning loads are greatest from 2 PM to 5 PM), modules with good high-temperature performance can provide the most critical power support, avoiding the purchase of expensive peak power from the grid.
Stronger When Frozen
When the ambient temperature drops to -10°C, the module operating temperature might only be 5°C to 10°C, which is lower than the STC standard of 25°C.
According to physical formulas, the module will enter an "overclocked" state at this time. If it is extreme cold weather of -20°C, with a temperature difference of -45°C (relative to the 25°C baseline), the power will increase by about 15%. A 400W panel might instantly output as much as 460W.
This brings an invisible risk to system design: voltage expansion. At low temperatures, open-circuit voltage (Voc) will rise significantly.
If sufficient low-temperature voltage margin (Temperature Correction Factor) is not reserved when designing the number of series connections, the string voltage might exceed the inverter's maximum input voltage (e.g., 1000V or 600V) at the extreme cold moment of sunrise.
NEC (National Electrical Code) strictly requires calculating the maximum system voltage based on local historical minimum temperature records.
For example, for a string of 12 modules, the sum of Voc at room temperature is 540 V, but at -25°C, the voltage may soar to 650 V.
If the inverter's voltage upper limit is only 600V, this single voltage overload could burn out the inverter's DC input capacitor or IGBT module, resulting in thousands of dollars in equipment damage.
Therefore, when designing systems in cold regions, a voltage correction factor of 1.15 or 1.20 must be used. It is better to have one fewer panel in series to ensure the voltage does not exceed the limit at minus 30°C.