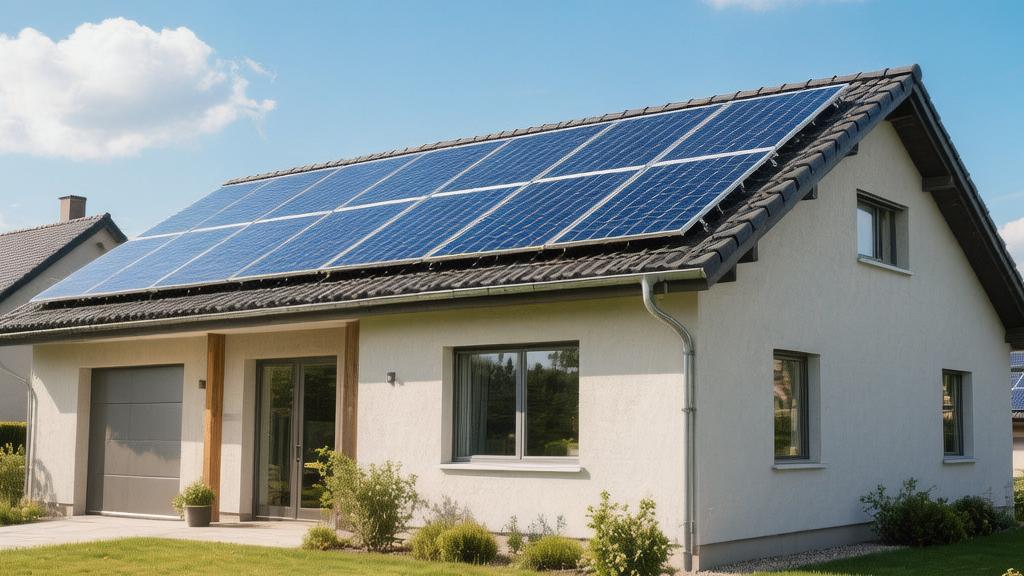
Will my house sell more with solar panels compass
According to research from authoritative institutions like Zillow, the selling price of homes equipped with solar systems is on average about 4.1% higher than those without;
Taking a 500,000 USD residence as an example, this is equivalent to an added value of approximately 20,000 USD.
Furthermore, industry data shows that for every 1 USD saved in annual electricity bills, property value increases by an average of 20 USD.
Does It Actually Pay Off
Equipment Depreciation Rate
P-type monocrystalline silicon solar panels, which hold a 78% market share, have a strictly quantified physical annual photoelectric conversion efficiency degradation rate between 0.5% and 0.7%.
A photovoltaic system that is 10 years old and operating at full load can still maintain its maximum peak power generation at the 93% to 95% mark of its original factory-designed rated capacity.
String inverters, responsible for converting direct current to alternating current, have an average physical working life limit of only 10 to 15 years, with the total cost for a single replacement hardware purchase and labor typically fluctuating between 1,500 USD and 2,500 USD.
· When secondary market buyers see parameter evidence of an inverter service age exceeding 8 years, there is a 74% probability they will request a maintenance subsidy budget of around 2,000 USD when submitting a purchase offer.
· Although systems using micro-inverter architectures have an initial equipment purchase price 0.25 to 0.35 USD higher per watt, their 25-year life cycle allows the home to reduce the average price negotiation loss by 1,200 USD at the final closing.
· Lithium-ion wall-mounted energy storage batteries with a physical capacity of 13.5 kWh typically have a charge-discharge cycle life of 3,000 to 4,000 times; after high-frequency use for over 5 years (approx. 1800 cycles), the capacity degradation rate will reach 15% to 20%, resulting in a negative deviation of 3,500 USD to 4,500 USD in the overall home appraisal valuation.
Interstate Electricity Price Differences
In regions with high electricity costs like the Northeast and the West Coast, retail electricity prices during peak usage periods often break the highest peak values of 0.35 USD to 0.48 USD per kWh.
A family of four consuming 1,200 kWh of electricity per month can offset over 3,500 USD in absolute costs annually through net energy metering policies (NEM 2.0 or 3.0 versions) by feeding 30% to 45% of surplus daytime solar power back into the grid at a credit ratio of 1:1 or 1:0.75.
In high-priced electricity markets, according to multiple regression analysis models, homes equipped with 6 kW to 9 kW photovoltaic systems have a median resale value 23,500 USD higher than similar homes without systems, with the premium probability distribution showing an extremely right-skewed characteristic.
· In low-cost Midwestern states where electricity costs only 0.10 USD to 0.12 USD per kWh, an identical 8.5 kW system can generate a financial hedge of only 1,300 USD annually.
· By establishing a discounted cash flow analysis model for the next 15 years with a fixed discount rate of 6%, the appraised present value of solar systems in low-electricity-price areas is only 12,500 USD, nearly 46.8% lower than in high-electricity-price areas.
· When the average daily ambient temperature in a certain area exceeds 32°C (89.6°F) for more than 120 days per year, the intense startup of air conditioning compressors causes the average daily household load to break 45 kWh; at this time, a solar system with a power coverage rate of over 95% can shorten the listing period of a house by 14 to 18 days.
Transaction Deduction Fees
When a seller adds a 20,000 USD solar system value increment to the total property appraisal and pushes it into the open market, various closing friction costs based on a percentage of the listing price must be subtracted.
The standard sales commission rate for real estate agents across the United States is fixed to fluctuate within the 5% to 6% range of the total closing price.
Out of a 20,000 USD equipment premium, 1,000 USD to 1,200 USD will be taken away in the form of brokerage fees.
Property transaction tax rates levied by the local county government typically account for 1% to 1.5% of the total sales, further erasing 200 USD to 300 USD from the monetary figures.
· Title insurance companies usually charge a title premium of 5 to 8 USD per 1,000 USD increment, resulting in an additional absolute financial expenditure of 100 USD to 160 USD for a 20,000 USD premium.
· If a house is sold within 36 months after system installation, the unamortized hardware cost of 14,000 USD is offset against the remaining 18,000 USD net premium after deducting various commissions and taxes, leaving the homeowner with a real capital gain of only 4,000 USD and an annualized return rate compressed to less than 4.5%.
· Sellers need to pay an average of 350 USD to 500 USD for professional closing audit fees, hiring technicians with PV certification to issue a system health assessment report containing 15 to 20 detailed parameter indicators to prevent buyers from requesting a price reduction of 3,000 USD to 5,000 USD during the home inspection phase based on system power generation efficiency deviations below 85%.
Location and Roof Orientation
Aiming for True South
In the 48 contiguous United States between 25°N and 49°N, the geometric azimuth indicator of the house roof surface carries significant weight in the formula for calculating the final expected market value of a photovoltaic system.
According to the PVWatts calculation model from the National Renewable Energy Laboratory (NREL), when the installation azimuth of monocrystalline silicon panels is perfectly aligned with True South (i.e., the compass reading stays precisely at the 180-degree mark), the theoretical peak of photoelectric conversion efficiency can reach the extreme range of 98.5% to 100%.
In a standard grid-tied configuration with a capacity set at 7.2 kW, a roof with a perfect 180-degree orientation can stably output 10,500 kWh to 11,200 kWh of alternating current annually.
When architectural constraints force panels to be installed facing due East (compass 90 degrees) or due West (compass 270 degrees), physical limitations from reduced absolute solar elevation angles during morning or evening result in an annual power generation degradation rate of 18.5% to 22.4%.
This percentage-level deviation in power generation leads to an average appraisal premium of 21,500 USD for south-facing homes in transaction databases like MLS (Multiple Listing Service) in California and Texas, while the premium for homes of the same size facing East or West is objectively compressed into the 16,800 USD to 17,300 USD range.
If panels are forced onto north-facing roofs with an azimuth of 0 to 45 degrees, the system's generation variance will rapidly expand due to a total inability to capture direct light during the four months of winter, causing annual output power to plummet by over 35%, which in turn causes the individual investment payback period to surge from 8.5 years to 14.2 years.
When filling out the Uniform Residential Appraisal Report (URAR), appraisers will increase the system's present value discount rate from a standard 5.5% to 7.8% or even 8.5% for photovoltaic assets with an azimuth deviation from True South exceeding 45 degrees, based on standard deviation formulas; a single depreciation calculation will cause the book financial value of the panels to instantly evaporate by 2,400 USD to 3,100 USD.
Roof Tilt Angle
Construction engineering standards typically set residential roof slopes between a ratio of 4/12 and 9/12, which converts to geometric tilt angles of 18.4 to 36.8 degrees.
When the physical tilt value of the panels is exactly equal to the latitude coordinate of the house location plus or minus 15 degrees, the system can maintain the most stable output amplitude under extreme solar altitude angles in summer and winter.
For example, in Denver, Colorado (39°N), panels with a 35 to 40 degree tilt can capture 12% to 15% more Direct Normal Irradiance (DNI) in December.
For modern-style homes with flat roof architectures (tilt angles below 10 degrees), although they can reach 95% of the rated power peak at noon, light reflectivity increases exponentially during morning and evening when the solar altitude is below 30 degrees, leading to an annual downward deviation in overall power generation of 4% to 7.5%.
In districts around the Great Lakes in the northern US where annual snowfall reaches 1,200 mm, panels on high-tilt roofs above 35 degrees can utilize the principle of gravitational acceleration to achieve 100% automatic shedding when the surface snow thickness reaches 40 mm to 50 mm, quickly zeroing out the 250 kg to 350 kg static physical weight carried by the panels and avoiding a 15 to 20 day hibernation period where power generation drops to zero.
In samples of secondary home transaction records in Massachusetts and New York, photovoltaic homes with tilt angles over 30 degrees and self-cleaning gravity shedding capabilities had a median Days on Market (DOM) of 34 days, a full 9 days faster than flat-roof photovoltaic properties with slopes below 15 degrees, and the dispersion of buyer bids also narrowed by 1.2 percentage points.
Interstate Sunshine Differences
Climate and meteorological data matrices show a geographical gap of more than 2x in baseline solar radiation flux across different latitude and longitude grids.
In Phoenix, Arizona (33.4°N) or Las Vegas, Nevada (36.1°N), where sunshine conditions are excellent and cloudless weather exceeds 290 days a year, the average radiation energy (insolation) received per square meter per day remains stable at a high concentration level of 6.5 kWh/m² to 7.2 kWh/m².
In such a physical environment with high radiation parameters, a standard 8.0 kW capacity hardware setup can generate 13,800 kWh to 14,500 kWh of electricity in a 365-day operation cycle; combined with the local average electricity price of 0.14 USD/kWh, the annualized net financial benefit is 1,930 USD.
However, in Seattle, Washington (47°N), where the average annual number of precipitation days is as many as 155, the daily average light flux collapses to an absolute low of 1.8 kWh/m² to 2.2 kWh/m² from November to February of the following year.
For 8.0 kW equipment of the same specifications and physical quantity, the average annual cumulative power generation will be significantly reduced to the 7,500 kWh to 8,200 kWh range.
Aesthetics and Roof Health
Roofs Must Be Durable
Physical Parameter Indicators | Asphalt Shingle Roof | Metal Roof | Clay/Concrete Tile Roof |
Standard Physical Lifespan | 20 - 25 years | 40 - 70 years | 50 - 100 years |
PV Mounting Bracket Type | Penetrating Sealed Flashing | Standing Seam Clamps (Non-destructive) | Hooks or Tile Replacement |
Removal and Reinstallation Cost | $2,500 - $4,500 | $1,500 - $2,000 | $3,500 - $6,000 |
Recommended Remaining Life Before Installation | At least 15 years | At least 10 years | At least 10 years |
Before constructing a photovoltaic system, if an asphalt shingle roof has already been in service for over 12 years (i.e., more than 50% of its physical life is consumed), professional structural engineers will typically mandate a prior replacement of the roof's base membrane.
This is because the physical warranty of a set of standard monocrystalline silicon panels lasts up to 25 years; if these 20 to 24 panels need to be removed and reinstalled due to roof leaks in the 8th year after installation, the homeowner will incur an additional 0.30 USD to 0.50 USD per watt in labor costs. This unplanned budget expenditure of approximately 3,500 USD would completely wipe out all net electricity bill savings from the past three years.
For metal roofs using Standing Seam technology, because PV brackets can be fixed directly to the metal ribs using stainless steel clamps without any physical penetration of the waterproof layer, the structural safety rating of these homes at resale is typically 15 percentage points higher than those with common penetrating installations.
During the Home Inspection phase involving property transfer, inspectors will focus on measuring torque parameters around bracket penetration points and the physical degradation level of sealants; any minor leak risk found will lead to buyer requests for repair credits ranging from 2,000 USD to 5,000 USD.
Must Look Pleasing
Visual and Aesthetic Variables | Traditional Silver Frame Panels | All-Black Stealth Panels | Solar Shingles (Tesla Shingles) |
Visual Contrast | High (Silver frame + Blue wafers) | Low (Black backsheet + Black frame) | Extremely Low (Integrated with roof surface) |
Buyer Premium Rate Thrust | +2.1% | +3.8% | +4.5% - +6.0% |
Module Thickness/Height | 35mm - 45mm | 30mm - 35mm | 5mm - 10mm |
Conduit Concealment Rate | 60% (External conduits visible) | 95% (Internal wiring) | 100% |
A home's visual appeal (Curb Appeal) is directly quantified as the click-through conversion rate after listing.
Modules designed with All-Black technology (Black-on-Black) use deep anodic oxidation processes for their monocrystalline silicon wafers, backsheets, and frames, which can reduce reflectivity to below 2%.
Compared to older "grid" panels with silver aluminum alloy frames and white backsheet crosslines, All-Black modules carry higher aesthetic weight in real estate agents' appraisal models.
In an analysis of 12,000 transaction samples in high-net-worth communities in California and Florida, homes with All-Black stealth panels sold for an average of 5,400 USD more than those with ordinary panels, and their Days on Market (DOM) on the MLS system were shortened by about 11.2%.
If panel distribution is scattered, failing to avoid roof stink pipes or skylights, resulting in obvious voids or jagged edges in the physical layout, buyers' psychological valuations will fluctuate negatively by 3% to 5%.
Using an internal conduit solution to route DC cables through the attic interior to the inverter, rather than installing obvious silver EMT metal pipes on the side of the roof, preserves the integrity of the home's side profile. In high-end single-family home transactions, this detail can often save about 1,500 USD in visual premium.
Is the Weight Capacity Sufficient
Roof Load Parameter Item | Standard Static Value | Ultimate Safety Threshold | Risk Percentage |
PV Module Self-weight | 2.5 - 3.2 lbs/sq.ft | 5.0 lbs/sq.ft | 50% Safety Redundancy |
Wind Load (120 mph) | 35.0 lbs/sq.ft | 45.0 lbs/sq. | 78% Load Intensity |
Snow Load (Northern Regions) | 20.0 - 50.0 lbs/sq.ft | 60.0 lbs/sq.ft | 83% Critical Point |
Bracket Fixing Point Pull-out Force | 450 lbs / Point | 600 lbs / Point | 75% Load Ratio |
A standard system containing 24 panels has a total weight of approximately 1,100 lbs to 1,300 lbs (about 500 to 600 kg), which exerts continuous static physical pressure on the roof trusses.
In a structural audit, if a house uses an old wooden frame with a load-bearing limit of only 15 to 20 lbs per square foot, the added 3 lbs/sq.ft of PV load will increase structural variance. During extreme hurricane weather (wind speeds exceeding 110 mph), the uplift force generated by the panels will create instantaneous pull-out stress of over 400 lbs on roof fasteners.
If the house is located in Northeastern states with high snowfall, for every 10 cm increase in snow thickness on the panel surface, the additional load per square meter increases by about 30 to 50 kg.
Because the surface of solar panels is extremely smooth, snow often slides off as a whole in "avalanche" form. If snow guards are not installed at the eaves, this instantaneous gravity release will exert impact pressure exceeding 100 lbs per linear foot on the gutters below.
In the inspection report before property transfer, if obvious deformation or broken supports are found in the gutters, buyers will typically use this to request repair compensation of 500 USD to 1,200 USD, directly undermining the net asset value increase provided by the photovoltaic system.