Do solar panels get less efficient over time
Yes, solar panel efficiency does indeed decrease over time; this natural aging process is known as "degradation."
According to data from the National Renewable Energy Laboratory (NREL), the average annual efficiency loss for high-quality panels is only 0.5%.
Even after 25 years of continuous use in the sun and wind, they can still maintain over 85% of their initial power generation capacity.
LID
In the first 24 to 72 hours after a photovoltaic module is installed and first exposed to light, the conversion efficiency exhibits a steep downward curve of 1% to 3%.
The industry typically uses the parameter of "initial light-induced degradation rate" to quantify this physical process.
After standard P-type monocrystalline silicon modules accumulate a solar radiation dose of 50 kWh/m², the median drop in their maximum output power usually stabilizes at around 2.5%.
Suppose a rooftop is installed with 20 panels with a rated power of 400 W, reaching a total installed capacity of 8,000 W.
After the first two weeks of the solar cycle, the system's actual peak output power will permanently decrease by a range of approximately 160W to 240W. Boron-Oxygen Reaction
During the Czochralski growth process stage, where temperatures exceed 800°C, a residual concentration of approximately 10^17 to 10^18 oxygen atoms per cubic centimeter remains in the silicon ingot.
· When the panel surface receives a photon flux exceeding 200 W/m², a large number of photo-generated electron loads are produced inside the silicon wafer.
· Positively charged boron ions and free interstitial oxygen atoms, excited by photon energy, undergo bonding reactions tens of thousands of times per second.
· This newly formed boron-oxygen complex captures about 0.1% to 0.5% of the free electrons that should have flowed into the wires, leading to a 1.5% to 2% reduction in the short-circuit current parameter.
· Measured at a standard test temperature of 25°C and an irradiance of 1,000 W/m², the percentage drop in open-circuit voltage typically remains within the 0.4% to 0.6% range.
Gallium Doping
Although the oxygen content of gallium-doped silicon wafers remains at a mass concentration of 15 ppm, the probability of gallium atoms and oxygen atoms combining to create electron traps is less than one-thousandth of the boron-oxygen reaction.
For monocrystalline silicon panels using the gallium-doping process, the upper limit of the power degradation rate in the first year is strictly limited to within 2%, and the subsequent annualized power reduction rate over 24 cycles can be compressed to an average of 0.45%.
Calculated at a feed-in tariff of 0.12 USD per kWh, a 10 kW system can generate an incremental monetary gain of approximately 800 USD to 1200 USD over a 25-year life cycle due to the reduced power loss from gallium-doping technology.
N-type is more stable
The silicon substrate of N-type TOPCon or heterojunction panels does not contain the concentration conditions required for boron-oxygen complex generation, so their tested LID indicators often approach the theoretical limit of 0%.
· A sample statistics report covering 50 megawatt-level power stations shows that within the first 1,000 hours of operation, the output power fluctuation range of N-type modules is controlled within a very narrow standard deviation of 0.5%.
· Compared to the 2% reduction in the first year for P-type modules, the maximum first-year power degradation rate for N-type modules is only 1%.
· Over a 30-year service life cycle, the cumulative power generation ROI of N-type panels is 3% to 5% higher than that of traditional P-type panels.
· Although the initial purchase budget per watt for N-type panels is 0.02 USD to 0.04 USD higher, the median internal rate of return (IRR) for long-term investment increases by about 0.8% when calculating the Levelized Cost of Energy (LCOE).
Recovery Testing
In a laboratory environment, by applying a combined pressure of 200°C ambient temperature and forward bias current, the physical process of boron-oxygen complexation can be reversed, causing the panel's conversion efficiency to show a certain percentage of recovery.
In actual outdoor natural temperature ranges, during summer cycles with surface temperatures of 50 to 65 degrees, the panel itself will produce a small self-repair margin of 0.1% to 0.2% in efficiency.
Output flow data monitored continuously for 18 months indicates that LID is an irreversible function curve with a logarithmic distribution, with 90% of the power drop concentrated within the first 300 hours.
After the first six months of natural sunlight exposure, the regression slope of the power curve tends to flatten out. Subsequent degradation variables over time are mainly taken over by aging caused by UV rays and fatigue from mechanical stress, no longer solely affected by the boron-oxygen concentration ratio.
When planning commercial rooftop projects with a total capacity exceeding 50 kW, engineers usually reserve an extra 3% to 5% of installed capacity margin at the DC load end of the inverter to hedge against the probability of voltage deviation from rated specifications caused by the 2.5% initial degradation in the first month.
Thermal Cycling
Over a 25-year outdoor exposure cycle, photovoltaic modules experience intense daily temperature fluctuations from sunrise to sunset, a phenomenon known in engineering as thermal cycling.
The surface temperature of a standard monocrystalline panel can soar to 65°C or even 75°C on a summer afternoon, while at night, the temperature can drop to 10°C or even below zero. This daily temperature difference of over 50°C causes materials with different thermal expansion coefficients inside the module to frequently shift.
Over the full life cycle of a system, a panel must withstand approximately 9125 of these physical stress shocks from alternating heat and cold.
According to the IEC 61,215 international standard, qualified modules must pass at least 200 extreme cycle tests from -40°C to 85°C in a simulation lab, and the power degradation rate after testing must be controlled within a 5% threshold.
Thermal Expansion and Contraction
The thermal expansion coefficient of tempered glass is approximately 9×10⁻⁶/K, while that of a monocrystalline silicon wafer is only 2.6×10⁻⁶/K. This means that when the temperature rises by 50 degrees, the elongation of the glass is more than 3.4 times that of the silicon wafer for the same length.
This displacement difference creates shear stress of up to several megapascals (MPa) at the interface between the silicon wafer and the adhesive film.
If the lamination pressure deviation in the encapsulation process exceeds 10%, or if the cross-linking degree of the EVA film is lower than the 75% standard, internal stress cannot be effectively released, thereby inducing geometric deformation at the microscale on the silicon wafer edges.
· During the first 3 to 5 annual cycles of module operation, this mechanical stress leads to a linear power reduction of about 0.2%.
· If ambient humidity remains above 85%, thermal cycling will accelerate moisture penetration into the encapsulation layer, causing the peel strength to drop from a standard 50 N/cm to below 20N/cm.
· When the interlayer adhesion drops by more than 60%, obvious yellowing or delamination occurs at the edges of the cell, which increases the panel's leakage current parameters by 15% to 20%.
Material Mismatch
The busbars connecting the cells are usually composed of flat copper wires coated with a tin-lead alloy layer. The thermal expansion coefficient of copper is as high as 16.5×10⁻⁶/K, which is a huge physical mismatch with the 2.6×10⁻⁶/K of silicon wafers.
In high-temperature states during the day, the ribbons expand due to heat, and at night, they contract violently. This reciprocating push-pull force acts directly on the brittle silicon wafers, which are only 160 to 180 microns thick.
· High-frequency thermal cycling leads to an increase in contact resistance at the solder joints from an initial 0.01 ohms to 0.1 ohms or even higher.
· According to Joule's Law, a 10-fold increase in resistance causes local heat generation at the solder joint to rise at a squared rate, leading to hotspots with temperatures exceeding 100°C.
· Local current density in hotspot areas can be 25% higher than in normal areas. This not only burns the backsheet but also obstructs the output current of the entire cell string, with power loss rates often jumping directly to over 10%.
Solder Joint Fatigue
After undergoing 500 standard thermal cycles, micro-fractures appear inside low-quality solder alloys, leading to a reduction in conductive cross-sectional area of about 30%.
If 3% of the solder joints in a 5 kW home system develop fatigue cracks, the internal resistance of the entire system increases by about 2 to 3 ohms, leading to a power heat loss of about 150 W to 200 W during peak current output.
· Panels using Multi-Busbar (MBB) technology reduce the cross-sectional size and stress intensity of a single ribbon by increasing the number of ribbons from 5 to 9 or even 16.
· MBB technology can reduce the mechanical stress on solder joints by about 40%, allowing the power degradation rate to remain within a high-precision range of 1.5% even after 600 super-standard thermal cycles.
· Using a low-temperature solder paste process can reduce the welding temperature from 300°C to below 200°C, reducing the pre-stress of the silicon wafer during cooling by 25%, thereby extending the effective power generation life by about 5 to 8 years.
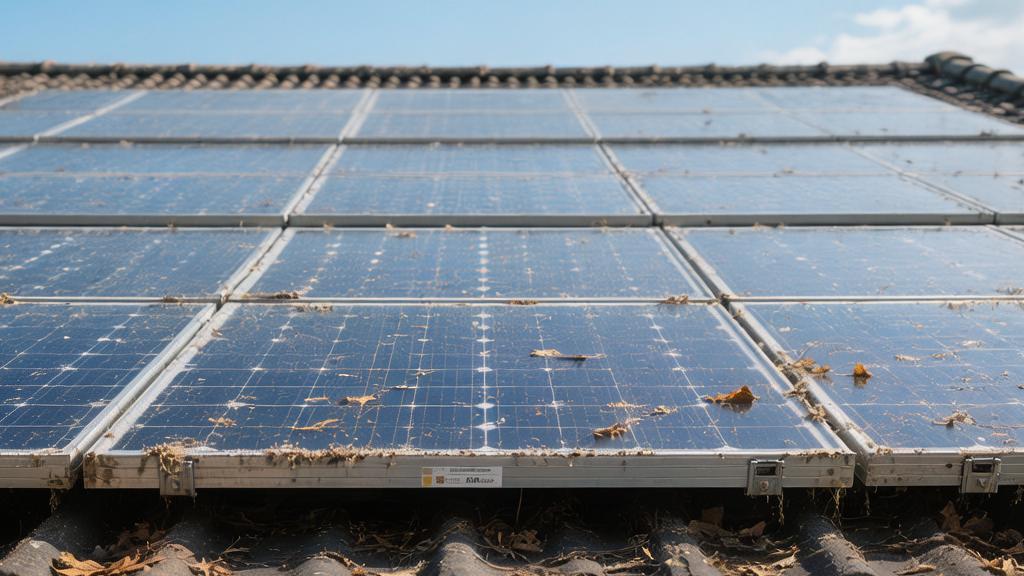
Weathering
Once solar panels are fixed on a roof or ground mount, they will spend 8,760 hours every year for the next 25 to 30 years in a completely unobstructed outdoor environment.
According to long-term tracking samples from the U.S. Department of Energy's Renewable Energy Test Center, the annual degradation rate fluctuation range for a module with a nominal power of 400 W caused by environmental weathering is typically between 0.15% and 0.35%.
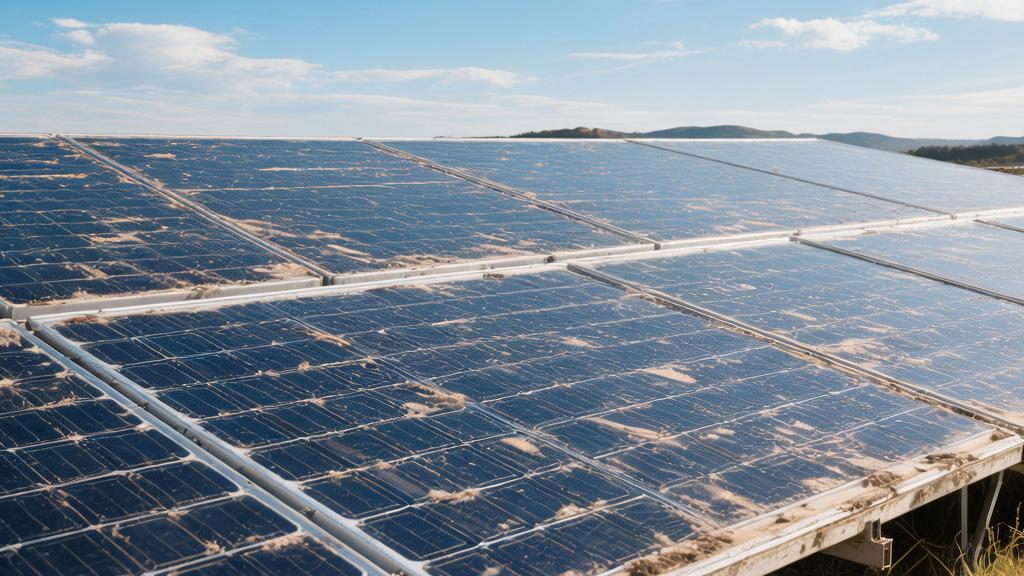
In arid regions with frequent wind and sand, the median short-circuit current in the 10th year of use will drop by about 3.2% compared to the original factory parameters due to physical wear of the anti-reflective coating.
Intense UV Exposure
Ultraviolet (UV) spectra with wavelengths between 280 nm and 400 nm account for only 5% to 7% of total solar radiation energy, yet they carry high-energy photons sufficient to destroy the chemical bonds of high-molecular polymers.
After the high-transmittance EVA encapsulation film on the front of the module continuously absorbs a cumulative UV dose of 100 kWh/m², its internal molecular chains undergo photochemical degradation reactions.
In high-irradiation areas like Arizona, where annual sunshine exceeds 2000 hours, strong UV rays will cause the originally transparent EVA film to undergo visible yellowing after 5 to 8 years of operation.
This yellowing leads to an annual decline of 0.08% to 0.12% in the film's transmittance for the visible light band of 300 nm to 600 nm.
For every 1 percentage point decrease in the absolute value of transmittance, the number of effective photons reaching the silicon wafer surface decreases proportionally, leading to a decrease in the maximum output power of the entire panel by about 0.8% to 1%.
Backsheet materials also suffer secondary damage from UV reflection.
For fluoropolymer backsheets typically 0.3 mm thick, after undergoing 15,000 hours of high-intensity UV aging tests, their elongation at break will drop significantly from an original 150% to below 50%.
Once the backsheet becomes brittle or even develops micro-cracks, its insulation resistance to a 1000V DC system voltage will plummet from an initial several hundred gigaohms to a few megaohms, greatly increasing the probability of leakage current.
Moisture Ingress
When ambient relative humidity stays above 80% for long periods, water vapor molecules penetrate into the module through microscopic pores in the backsheet or edge gaps in the frame silicone at a rate of several milligrams per square meter per day.
Although the water vapor transmission rate of high-quality polyvinylidene fluoride (PVDF) backsheets is strictly limited to below 1.5 g/m² per day, significant moisture still accumulates on the cell surface under the pressure of 20 years of humidity.
When this solution contacts the silver grid lines, which are only about 10 microns thick, electrochemical corrosion occurs, leading to a continuous reduction in the cross-sectional area of the conductive silver mesh.
Statistical data for a photovoltaic array in service for 15 years shows that moisture corrosion causes the internal series resistance of cells to increase by an average of 0.05 ohms to 0.1 ohms.
Under peak sunshine intensity, this tiny resistance increment converts into extra ohmic heat loss, shrinking the actual power generation of a single module by 4W to 7W.
In strings with system voltages exceeding 600 V, positively charged sodium ions migrate toward the P-N junction on the surface of the cell through conductive channels formed by moisture and the anti-reflective coating.
In 85/85 accelerated aging tests (85°C and 85% relative humidity), if the module does not adopt anti-permeation processes, its output power can drop as high as 30% or more within just 96 hours.
Wind and Sand Abrasion
Under weather conditions with gust speeds reaching 130 km/h, a single solar panel surface installed on a 30-degree tilt mount must withstand dynamic wind pressure as high as 2400 Pascals.
This huge thrust, equivalent to a weight of 240 kg per square meter, causes reciprocating physical deformation of several millimeters to a dozen millimeters in the center of the panel.
High-frequency amplitude bending is prone to tearing micro-cracks exceeding 100 microns in hidden parts of the monocrystalline silicon wafer.
Strong winds are often accompanied by sand particles with diameters of 0.1 mm to 0.5 mm.
When these sand grains hit the anti-reflective coating on the panel surface at a speed of 20 m/s, they produce a physical wear effect similar to sandblasting.
After 10 years of wind and sand erosion, the microscopic roughness of the tempered glass surface increases significantly, causing the light reflectivity to slowly climb from an extremely low factory value of 3% to 4.5% or even 5.5%.
This 1.5 percentage point reflectivity deviation corresponds to an implicit annual degradation rate of about 0.05% in panel conversion efficiency.
Hail Damage
When hailstones larger than 25 mm and weighing over 7.5 g hit a solar panel at a terminal velocity of 23 m/s, the instantaneous mechanical impact force is as high as dozens of Newtons.
Although 3.2 mm thick ultra-clear patterned tempered glass can withstand most regular hail impacts without breaking, the shock waves will penetrate the glass layer and cause star-shaped dark cracks in the fragile silicon wafer below.
To more clearly quantify the impact of weathering, the following table shows the expected damage probability and loss specifications for standard module parameters due to different meteorological factors:
Meteorological Damage Factor | Cycle | Involved Physical Parameter | Quantified Data Deviation | Expected Power Reduction Rate |
High-dose UV Radiation | 10-year Cumulative | EVA Transmittance | Reduction of 0.8% - 1.2% | 0.7% - 1.0% |
Continuous High-humidity Ingress | 15-year Cumulative | Series Resistance | Increase of 0.05Ω - 0.1Ω | 1.5% - 2.5% |
Extreme Wind/Sand Abrasion | 10-year Cumulative | Surface Reflectivity | Increase of 1.5% - 2.5% | 0.8% - 1.5% |
Long-term Dynamic Wind Pressure | 20-year Cumulative | Wafer Micro-crack Area | Increase of 3% - 5% | 1.0% - 2.0% |
When performing initial financial calculations, if the installation site is located in a dusty area with annual rainfall below 400 mm and frequent winds, the engineering budget usually sets the cleaning frequency for the modules to 4 times per year for the first five years.
Using fully automatic waterless cleaning robots, priced between 2000 USD and 5000 USD per unit, dust can be removed from the surface at night using rotating soft brushes.
The cleaning flow of a single robot per hour can cover an installed capacity of approximately 1.5 MW.