How to Prevent Mono Silicon Power Loss | Shading Avoidance, Surface Cleaning, Wiring Inspection
Increase yields by 5%-15% through regular surface dust cleaning, strictly control local shading to prevent a 30% power drop, and monitor line impedance to reduce internal losses, ensuring monocrystalline silicon maintains a conversion efficiency of over 20%.
Shading Avoidance
Test data indicates that when only 3% of the array area is covered by shadows, the entire string's voltage output will suffer a loss of over 30% due to the intervention of bypass diodes, limited by the high current density characteristics of monocrystalline silicon.
Local shading not only causes multi-peak phenomena in the I-V curve, reducing the MPPT efficiency of the inverter, but also turns shaded solar cells into loads that consume energy, creating persistent high-temperature hotspots.
Diode Operation Logic
When a certain monocrystalline silicon cell is shaded by fallen leaves, bird droppings, or shadows, the internal resistance of the cell rises rapidly, and the photogenerated current drops significantly.
At this time, other unshaded cells in the string continue to produce rated current. This current is forced to pass through the high-resistance shaded cell, causing electrical energy to be released there in the form of thermal energy.
Without the intervention of a bypass diode, the temperature of the shaded cell can exceed 150 degrees Celsius in a short time. This phenomenon is known as a hotspot in power station operation and maintenance.
To prevent such permanent physical damage, monocrystalline silicon modules are usually configured with three Schottky diodes in the junction box, connected in parallel across three different cell sub-strings.
Under normal light conditions, the voltage generated by the cells puts the diode in a reverse bias state.
In this state, the leakage current of the diode is extremely small, typically less than 2 microamps at 25 degrees Celsius, consuming almost no system energy.
When shading occurs and causes the voltage of the shaded sub-string to drop to a negative value and reach the diode's turn-on threshold (typically 0.4V to 0.6V), the diode switches to a forward conduction state.
Operating State | Bias Type | Voltage Performance | Current Flow | Energy Loss |
Normal Light | Reverse Bias | Cells output positive voltage | Flows through all series cells | Microamp-level leakage current only |
Local Shading | Forward Conduction | Sub-string voltage becomes negative | Bypasses shaded cell sub-string | Diode forward voltage drop loss |
Severe Overload | Continuous Conduction | Long-term negative pressure environment | Bypass circuit carries full current | Significant junction box temp rise |
The Schottky diodes commonly used in monocrystalline silicon modules have a forward voltage drop of approximately 0.55V at 15A, meaning that when a sub-string is bypassed, the diode generates about 8.25W of heat.
If the heat dissipation design of the junction box is poor, the rise in internal temperature will further reduce the reverse breakdown voltage of the diode and increase leakage current, which may lead to thermal runaway in extreme cases.
When designing high-voltage string systems of 1000V or 1500V, the diodes of each module must have the surge capacity to withstand more than twice the system's rated current.
For high-efficiency monocrystalline silicon PERC modules, since the single-cell voltage output is approximately 0.6V to 0.7V, a sub-string with 20 cells will result in a system voltage loss of about 12V to 14V when bypassed.
Shading Ratio (within sub-string) | Bypass Diode Status | Module Voltage Change | Current Retention | Est. Power Loss |
0% | Off | Rated Output | 100% | 0% |
5% (1 cell shaded) | On | Drops ~33.3% | 100% | ~34% |
40% (multiple cells shaded) | On | Drops ~33.3% | 100% | ~35% |
Cross-sub-string Shading | Multiple On | Drops ~66.6% | 100% | ~68% |
In monocrystalline silicon modules using half-cut cell technology, the internal circuit logic changes.
Half-cut modules split standard cells in half and adopt an upper-lower parallel structure.
Even if the lower half of the module is completely shaded, the current can still pass through the parallel path of the upper half. In this case, the corresponding bypass diode may not need to open immediately or may only bear a small shunt pressure.
This design reduces bypass loss from the traditional 33.3% to approximately 16%.
However, the reliability of diodes faces challenges during long-term operation, as frequent switching can lead to fatigue of internal semiconductor materials.
In desert power plants with an ambient temperature of 40 degrees Celsius, the junction temperature of a diode in a conduction state may climb to over 125 degrees Celsius.
Pre-layout Simulation
This simulation is based on 8,760 hours of annual meteorological data. By importing typical meteorological year files in TMY3 or Meteonorm format, it is possible to accurately replicate the sun's trajectory throughout the four seasons.
Monocrystalline silicon modules are highly sensitive to shadows. During the simulation process, a detailed 3D shading scene must be established, modeling obstacles such as buildings, trees, utility poles, and lightning rods within a 50-meter range of the array at a 1:1 scale.
Even the shadow of an exhaust pipe with a diameter of only 5 cm can cast a shadow over 3 meters long under the low-angle sunlight of the winter solstice, spanning multiple cell strings and causing an instantaneous power drop of more than 15% during that period.
Through simulation calculations, designers can obtain quantitative indicators for IAM (Incidence Angle Modifier) losses and near-shading losses, ensuring that the annual shading loss rate is controlled within 2%.
· Meteorological Data Access: Obtain high-precision GHI (Global Horizontal Irradiation) and DNI (Direct Normal Irradiation) data from NASA or SolarGIS as the underlying support for simulation calculations.
· Horizon Analysis: For power plants in mountainous or hilly areas, path files generated by surveying instruments are imported into the software to simulate the shading of sunlight by distant mountains in the early morning or evening.
· 3D Model Verification: Convert CAD design drawings into 3D scenes, setting the height, tilt angle, and row spacing of each bracket array parametrically.
· Shading Loss Animation: Run shadow time-step simulations to observe whether shadows will touch the module edges during the window of 9:00 to 15:00 on the winter solstice, when solar energy is most concentrated.
Finding a balance between land utilization and power generation performance is usually reflected in the setting of GCR (Ground Coverage Ratio).
For monocrystalline silicon arrays, the calculation of GCR needs to consider the difference in solar altitude angles caused by latitude. In areas at 35 degrees north latitude, to ensure no mutual shading occurs on the winter solstice, the net distance between arrays usually needs to be more than 2.5 times the height of the module rack.
If the spacing is reduced to save land, although the installed capacity increases, the front array's shading of the bottom cells of the rear array will trigger bypass diode conduction due to the series characteristics of monocrystalline silicon.
This causes the rear module's actual output voltage to drop significantly even if 80% of its area is in the sun.
Simulation results usually demonstrate the mismatch losses caused by such unreasonable layouts through multi-peak performance in I-V curves.
By adjusting the tilt of the brackets—for example, lowering a fixed bracket from 35 degrees to 30 degrees—the amount of light received per unit area is reduced, but the shadow length can be effectively shortened.
Metric | Technical Recommendation | Impact on Mono-Si Systems |
Row Spacing Coefficient | 2.2 - 2.8 (Depends on latitude) | Prevents sub-string level voltage loss from low-angle sun |
GCR Value | Between 0.35 - 0.55 | Determines annual total power revenue per unit of land |
Tilt Deviation | Within ± 2 degrees | Affects reflection loss and dust accumulation speed |
Array Ground Clearance | 0.5m - 1.2m | Avoids burying bottom cells in vegetation or snow |
Cells inside a monocrystalline silicon module are usually arranged vertically and divided into three sub-strings.
If landscape installation is adopted, when the shadow spreads upward from the bottom of the array, it will first completely shade the bottom-most cell sub-string.
At this point, the bypass diode activates, and the module can still retain 67% of its output power.
In contrast, if a Portrait installation is used, the shadow will sweep across the bottom of all three sub-strings simultaneously, causing all three diodes to conduct, and the module's output power will rapidly drop to zero.
The "Module Layout" function in simulation software can quantify this difference in electrical performance.
In actual cases, for flat roof projects with parapet wall shading, adopting a landscape layout with optimized row spacing can result in approximately 4.5% higher annual power generation than a vertical layout.
· Linear Shading Loss: Simply calculates the ratio between the shaded area and power, usually used for preliminary estimation.
· Electrical Mismatch Calculation: Delves into the cell level to simulate current flow in shaded branches; this is the most accurate simulation scheme for monocrystalline silicon systems.
· Hotspot Risk Identification: Identifies high-risk layout positions during the design stage by simulating temperature rise trends in long-term shaded areas.
· Bifaciality Simulation: For bifacial monocrystalline silicon modules, calculates the contribution ratio of ground albedo and array height to total gain.
Simulation Output | Typical Range | Feedback Result |
Near-shading Loss Rate | 1.5% - 3.5% | Determines if current spacing is acceptable |
IAM Loss | 2.0% - 3.0% | Evaluates anti-reflective coating performance under oblique light |
Mismatch Loss | 1.0% - 2.5% | Reflects module consistency and layout logic quality |
Annual Utilization Hours | 1,200 - 1,800 hours | Used for financial models to calculate ROI period |
After completing the basic layout, the simulation process should also include redundancy analysis for extreme weather.
For example, adding a snow depth parameter to the simulation to observe the drop in string current when the bottom modules are covered by snow.
For monocrystalline silicon power plants equipped with Trackers, simulation complexity increases further, requiring the execution of Back-tracking algorithms.
This algorithm actively avoids shading of the rear array by the front array in the morning and evening by fine-tuning the bracket angle. Although some incidence angle gain is sacrificed, more severe shading mismatch is avoided.
This dynamic simulation can increase the annual power generation of monocrystalline silicon modules by another 3% to 8% by adjusting the rotation limits of the trackers.
Module-level Optimization
The introduction of Module-Level Power Electronics (MLPE) is the current technical means to solve this problem.
It moves the Maximum Power Point Tracking (MPPT) function from the centralized inverter down to each independent monocrystalline silicon module.
By installing a DC optimizer on the back of each panel, the system can adjust the ratio of current and voltage in real time.
This ensures that even if one module's current drops due to local shading, it will not drag down the current level of the entire circuit.
Data monitoring shows that in residential rooftop environments with complex shading, this optimization method can increase annual power generation by 5% to 22% compared to traditional schemes and reduce system mismatch loss to below 0.5%.
Power optimizers use DC-DC conversion technology to achieve voltage step-up or step-down adjustment, actively reducing the output voltage when the module current is limited to achieve string current uniformity.
This logic ensures that every monocrystalline silicon module can operate at the peak of its power curve within its own physical environment, no longer subject to the "barrel effect" (the weak link limiting the whole).
DC optimizers usually employ efficient Buck-Boost topology circuits, with peak conversion efficiencies typically reaching over 99.5%.
When a monocrystalline silicon module is shaded, causing the photogenerated current to drop from 10A to 4A, the optimizer automatically enters buck mode, halving the module's output voltage so that the output current matches the string's 10A standard.
This dynamic impedance matching technology gives designers higher freedom in array placement, allowing monocrystalline silicon modules to be installed on roofs with different orientations and slopes, and even allowing modules of different power ratings to run mixed in the same string.
For large ground-mounted power plants, although the initial investment cost of MLPE increases by about $0.05 to $0.10 per watt, it provides module-level monitoring capabilities.
Micro-inverters go a step further by converting DC power directly to AC at the module end, completely eliminating high-voltage DC arcing risks and voltage mismatch.
Each module is independently connected to the AC grid in parallel, meaning the failure or complete shading of a single module has almost zero impact on the power of the rest of the system.
Micro-inverter schemes show longer service lives in monocrystalline silicon system applications, with design standards typically requiring a 25-year operating cycle, matching the power warranty period of monocrystalline silicon modules.
Since a micro-inverter processes only 300W to 500W of power, its thermal management pressure is much lower than that of string inverters, resulting in a lower risk of power derating in high-temperature environments.
In low-light environments (such as early morning or evening), the startup voltage of micro-inverters is extremely low, usually between 16V and 22V, extending the effective daily working time of the monocrystalline silicon system.
At the same time, the module-level AC solution naturally complies with the rapid shutdown requirements in international electrical safety codes (such as NEC 2017/2020), capable of reducing the array voltage to below 80V within 30 seconds in an emergency, ensuring the safety of the building assets.
Half-cut cell technology implements passive defense optimization against shading from a hardware level by changing the physical circuit connections within the module.
This technology divides standard cells in half and splits the module into upper and lower parallel regions, showing significant performance advantages during horizontal shading.
Since current and resistance loss have a square relationship, cutting the cells in half halves the current through each busbar, reducing internal thermal loss to one-fourth. This brings an additional power gain of about 5W to 10W to the module.
In terms of shading optimization, when the lower half of a half-cut module is completely covered by shadow, the internal parallel structure allows the upper half to continue outputting at 50% of the rated power, rather than dropping to zero like a full-cell module due to bypass diode triggering.
This optimization of circuit logic not only improves the stability of high-density arrays with high land utilization but also slows down the thermal-induced degradation rate of monocrystalline silicon materials by lowering operating temperatures.
Advances in smart junction boxes and integrated chip technology have led to the miniaturization and integration of module-level optimization devices, reducing failure points in external connectors.
Through power line carrier communication or wireless protocols, the system can report current, voltage, and backsheet temperature data for every single monocrystalline silicon panel at minute-level frequencies.
In large-scale monocrystalline silicon power plants exceeding 10 MW, O&M teams can use cloud algorithms to conduct cross-comparisons of data from tens of thousands of modules, automatically identifying individuals with abnormal performance degradation.
For example, when a module's output voltage is consistently 3% lower than the string average for a long time, the system will automatically issue an alert pointing to possible micro-cracks or a soft bypass diode breakdown failure.
Through this preventive maintenance, the long-term downside risk of the power plant is effectively controlled.
In financial model calculations, although MLPE increases initial capital expenditure (CAPEX), the premium is typically recovered within 5 to 8 years through power generation gains and reduced operating expenses (OPEX), contributing higher net cash flow over the remaining lifespan.
Surface Cleaning
Regular cleaning can improve the power generation efficiency of monocrystalline silicon modules by about 3% to 25%.
Studies show that when surface dust density reaches 1 gram per square meter, the output power of the PV array drops by about 4%.
Removing surface attachments is not only about maintaining light intake but also about preventing physical damage to the cell structure caused by local overheating, ensuring that the annual energy yield meets expectations.
Quantifying Particle Impact
When suspended particles adhere to the cover glass due to gravity, electrostatic attraction, or Brownian motion, the light penetration path undergoes physical shifts.
Physical experimental data shows that when the surface particle deposition density reaches 1 gram per square meter, the light transmittance of PV glass typically drops by about 3.8% to 4.2%.
This shielding is not simple light intensity attenuation; it involves a comprehensive effect of forward scattering and backward reflection.
Fine particles with a diameter below 2.5 microns have a larger specific surface area and a more pronounced scattering effect on short-wavelength light.
The table below shows the specific quantitative impact of different deposition densities on the electrical parameters of monocrystalline silicon modules:
Particle Density (g/㎡) | Glass Transmittance Loss (%) | Isc Drop (%) | Pmax Degradation (%) |
0.5 | 2.1 | 1.8 | 1.7 |
1.0 | 4.1 | 3.7 | 3.5 |
2.0 | 8.5 | 7.9 | 7.6 |
5.0 | 19.2 | 18.1 | 17.8 |
10.0 | 34.0 | 31.5 | 30.2 |
The chemical composition and physical form of particles affect power output through different mechanisms.
In arid desert areas, particles consist mainly of silicon dioxide and calcium carbonate. These are relatively transparent but have high hardness, easily causing microscopic wear on the anti-reflective coating under wind action.
In contrast, particles in industrial areas are rich in carbon black, sulfates, and nitrates, with light absorption coefficients 3 to 5 times that of ordinary dust.
The power loss caused by carbon black particles is more than 2.5 times that of dust at the same mass concentration.
This is because carbon-based particles have strong absorption across the entire spectrum from 400 nm to 1100 nm, converting a large number of photons into heat before they reach the silicon wafer junction.
The particle layer also changes the module's heat exchange coefficient in addition to blocking light.
Monocrystalline silicon cell electrical output is highly sensitive to temperature; for every 1 degree Celsius increase, output power drops by about 0.35% to 0.45%.
1. Heat Conduction Obstruction: Dry dust has very low thermal conductivity, usually between 0.1 and 0.3 W/(m·K). This layer acts like an insulating blanket, preventing internal heat from dissipating into the air.
2. Temperature Rise Quantification: A dust load of 1 g/㎡ can cause cell temperature to rise by 1.5 to 2.2 degrees Celsius under rated operation.
3. Superposition Effect: Optical loss from shading and electrical efficiency drop from temperature rise produce a superposition effect. Experiments show that under 30°C ambient temp and 1,000 W/㎡ irradiance, a module with 5 g/㎡ of dust operates at over 6°C higher than a clean one.
Different particle size distributions have distinct interference characteristics on electrical parameters.
At low wind speeds, PM10 and finer particles are more likely to cling to the glass surface via Van der Waals forces.
The filling effect of these fine particles in microscopic glass pits produces quasi-permanent shading that is difficult to remove even with moderate rainfall.
Particle Diameter (μm) | Main Scattering Type | Impact on Short-wave (400-600 nm) | Impact on Long-wave (800-1100 nm) |
< 2.5 | Rayleigh / Mie | Extremely High: Causes spectral shift | Medium |
2.5 to 10 | Mie | High: Significantly reduces transparency | Medium |
> 10 | Geometric Optics | Medium: Acts like a physical barrier | High: Overall transmittance drop |
This non-uniformity in size distribution causes current mismatch between cells.
When one module in a string is heavily soiled, its current output is limited, forcing the entire string to align with the lowest current value.
This phenomenon leads to a shift in the inverter's Maximum Power Point Tracking (MPPT) range in actual operation, causing the system's Performance Ratio (PR) to slide.
Particle morphology also induces severe local thermophysical phenomena. Non-uniformly deposited particles, such as bird droppings, sticky pollen, or heavy dust accumulation, form opaque areas.
In this state, the shaded cell changes from a source to a load, consuming electricity generated by other cells in the same circuit.
This consumption causes local current density to increase sharply, generating intense Joule heat.
According to infrared thermal imaging, hotspots induced by non-uniform particle distribution can cause local temperatures to soar to over 85 degrees Celsius within five minutes.
This sustained high temperature accelerates back sheet yellowing and EVA degradation, leading to permanent loss of transmittance and causing silicon wafer micro-cracks over long cycles.
From the perspective of electrical parameter changes, dust primarily affects short-circuit current (Isc), while the impact on open-circuit voltage (Voc) is relatively small.
However, as dust concentration increases, the Fill Factor (FF) of the module decreases due to the increasing relative share of series resistance.
When power loss exceeds 5%, the additional power drop caused by increased resistive losses grows exponentially.
Professional Tool Selection
The outermost layer of a monocrystalline silicon module is typically covered with an Anti-Reflective Coating (ARC) with a thickness between 100nm and 150nm, primarily composed of silicon nitride or titanium dioxide.
When selecting cleaning tools, the primary consideration is to avoid physical abrasion of this ultra-thin coating.
Micro-scratches from physical friction change the refractive index of the glass surface, increasing reflection loss and reducing the number of photons reaching the interior of the cell.
Regarding material selection, bristle hardness is a rigid indicator.
High-quality professional PV brushes typically use modified polyethylene fiber or Nylon 66, with fiber diameters strictly controlled between 0.05 mm and 0.08 mm.
Under 400 W/㎡ irradiance, using a common industrial hard brush with a 0.2 mm diameter after three cleanings increases surface microscopic roughness by about 15%, causing a permanent 0.5% drop in efficiency. Using a 0.06 mm fine fiber brush 50 times under the same frequency results in a transmittance loss of less than 0.1%.
If untreated tap water or high-hardness groundwater is used, calcium, magnesium, and sodium carbonates or sulfates will precipitate on the glass surface after evaporation.
These white spots not only cause local shading but also react with acidic gases in the air to form harder-to-remove chemical scale layers.
Technical specifications suggest that Total Dissolved Solids (TDS) in cleaning water should be below 75 mg/L. Data shows that when TDS reaches 200 mg/L, residue after a single cleaning causes Isc to drop by 0.3% to 0.6%. If TDS exceeds 500 mg/L, long-term mineral accumulation leads to non-uniform heating.
Water pressure control is vital for protecting the module's mechanical structure.
During spray cleaning, the pressure at the nozzle must be maintained within a reasonable range.
Excessive pressure can destroy the silicone sealant at the frame, causing water to penetrate the backsheet and laminate, leading to insulation resistance drops or PID phenomena.
Spray equipment pressure should be adjusted between 0.3 and 0.6 MPa, with flow rates maintained at 5 to 8 liters per minute. When pressure exceeds 1.5 MPa, the impact is enough to expand existing micro-cracks in cells, increasing internal resistance by 2% to 5%, thereby creating unnecessary energy losses in the circuit.
For large power plants, automated robots are tools to improve maintenance efficiency.
Robot weight distribution and driving mechanisms must match the weight-bearing capacity of monocrystalline modules.
Most modules are designed for a load of 5400 Pa, but this refers to uniform static pressure; the local dynamic pressure of a moving robot is completely different.
To deal with sticky contaminants like grease or resin, certified professional neutral cleaners can be used.
The pH value of these cleaners must be between 6.5 and 8.5. Using agents containing hydrofluoric acid or strong alkalis is strictly prohibited.
Optimal Operating Window
Under full sun, the surface temperature of the module is usually 25 to 35 degrees Celsius higher than the ambient temperature.
If the ambient air temperature is 30°C, the module surface might reach 65°C.
If cleaning water at approximately 20°C is sprayed onto the glass at this time, the instantaneous 45°C temperature difference creates massive thermal stress.
While PV glass is tempered, its ability to withstand instantaneous temperature differences is usually limited to within 30 degrees Celsius.
Frequent excessive thermal cycles cause microscopic cracks in the glass and the peeling of the ARC, leading to transmittance drops within the first 5 years of the operating cycle.
According to measured data, the relationship between monocrystalline silicon power output, surface temperature, and cleaning timing exhibits the following physical characteristics:
· When solar irradiance exceeds 300 W/㎡, all spray cleaning is prohibited, as the module heating rate is extremely fast and water loss increases sharply.
· 6 AM to 9 AM is the first ideal window. Air humidity is higher, and surface dust is often moist due to dew, reducing friction and the probability of scratches during cleaning.
· 5 PM to 8 PM is the second window. In this period, the solar altitude angle decreases, irradiance drops below 200 W/㎡, the module has begun to dissipate heat, and surface temperature falls below 40°C, keeping water loss and thermal stress risks controlled.
· Night work avoids thermal stress but is limited by visibility for observing stubborn stains, and high humidity might prolong frame water accumulation, increasing PID risks.
At wind speeds exceeding 4 m/s, sprayed water mist undergoes severe physical drift, reducing water utilization by over 40%.
Fast-moving air accelerates evaporation, causing water droplets to dry on the glass before they can carry away particles, forming hard-to-clean scale spots.
If wind speed exceeds 10 m/s, all cleaning on high or inclined surfaces must stop, as lateral wind creates unstable aerodynamic loads on robots or manual poles, increasing the probability of module impact.
In extremely arid environments with relative humidity below 30%, electrostatic charges easily build up on the glass surface. These charges firmly attract fine particles from the air, forming an electrostatic adhesion layer.
Rainy weather cannot completely replace manual cleaning. Light rain (less than 5 mm) often only moistens dust, turning it into mud that accumulates at the aluminum frame at the bottom.
When the rain evaporates, this sludge solidifies into hard shading strips, creating current bottlenecks for bottom cells.
Only when rainfall exceeds 10 mm and lasts for more than 30 minutes does natural rain provide a significant flushing effect.
O&M teams should inspect within 24 hours after heavy rain, using the moist state to quickly clear accumulation at the frame. This weather-based window adjustment can reduce annual maintenance costs by about 15%.
When inverter feedback shows a deviation between actual system power and theoretical value (based on irradiance sensors) exceeding a 3% to 5% threshold for more than 3 clear days, it indicates dust levels have reached the treatment standard.
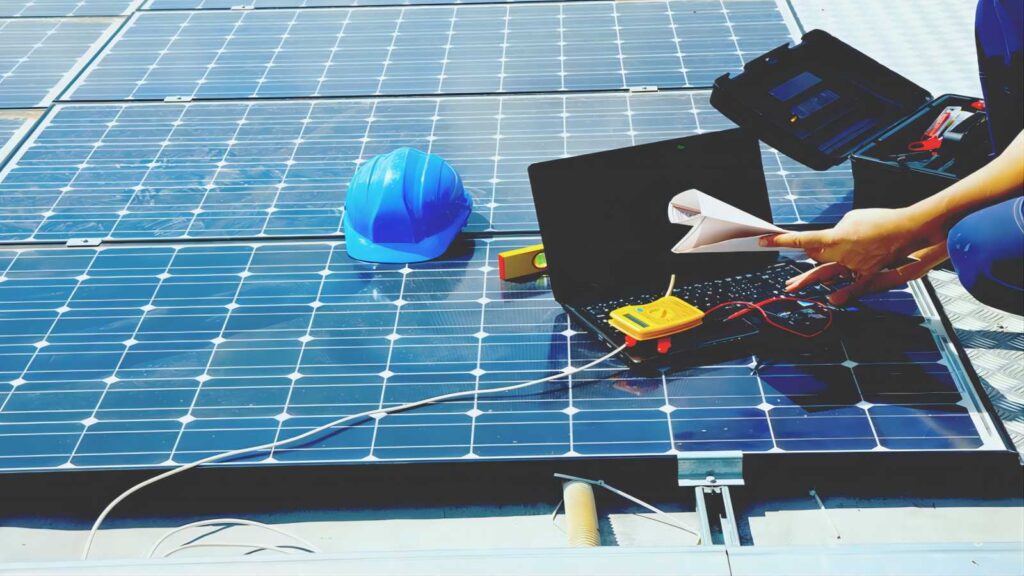
Wiring Inspection
DC-side line losses should be maintained within 1.5%.
Focus inspections on MC4 connector contact resistance; the standard value must be below 0.5 mΩ.
Using infrared thermal imaging, a temperature rise exceeding ambient by 10 degrees is considered abnormal.
Ensure that insulation resistance per kilovolt is no less than 1 megohm.
By comparing the Voc and Isc of each string, the voltage deviation between strings must be controlled within 2% to avoid power drops caused by circulating currents.
Interface Heat Monitoring
In the DC circuit of a monocrystalline silicon PV system, the electrical contact condition of MC4 or EVO2 interfaces determines if the system can maintain low line losses within 1.5%.
These connectors typically use silver-plated copper contacts. According to the IEC 62,852 standard, initial contact resistance should be controlled between 0.25 mΩ and 0.35 mΩ.
In actual operation, if the connector does not produce an audible "click" when locked, or if the seal hardens under long-term UV exposure, moisture and salt spray will penetrate the interface.
This triggers oxidation and chemical corrosion of the metal surface, causing contact resistance to rise rapidly.
When resistance reaches above 1.0 mΩ, a DC current of 15A to 20A creates significant ohmic losses.
This loss dissipates as heat, keeping the PPO or PC material of the shell in a high-temperature environment, accelerating polymer chain breakage.
Monitoring Index | Normal Range | Alert Limit | Abnormal Action |
Interface Temp Rise (Delta T) | < 10 K (vs Ambient) | 15 K to 20 K | Check terminal crimp tightness |
Contact Resistance | 0.2 to 0.5 mΩ | > 1.0 mΩ | Recrimp with new connector |
Voltage Drop across Interface | < 10 mV | > 30 mV | Test crimp pull-out strength |
Shell Surface Temp | < 60 °C | > 85 °C | Shutdown and replace connector |
When performing infrared thermal imaging, the system should be at peak current, and ambient irradiance should ideally be above 600 W/㎡.
Technicians need to set the emissivity of the IR camera to approximately 0.90 to accurately capture radiant heat from the plastic shell.
During inspection, if an interface temperature is 5°C higher than an adjacent one with the same load, a loose connection or internal contact deformation exists.
When the rise reaches above 15°C, internal metal parts may have undergone annealing, weakening elastic pressure and further increasing resistance, creating heat accumulation.
This heat not only reduces the electricity delivered to the inverter but also causes cable insulation near the interface to become discolored and brittle, potentially dropping insulation resistance below 1 megohm.
Environment Type | Corrosion Factor | Monitoring Focus | Suggested Cycle |
Coastal Area | Chloride salt spray | Contact plating peeling | Every 3 months |
Agricultural Ranch | Ammonia and moisture | Seal cracking and mold | Every six months |
Desert Area | High diurnal temp variance | Nut loosening from thermal expansion | Every six months |
Industrial area | Acidic rain | Flame-retardant shell corrosion | Every 12 months |
During wiring, if the cable bending radius is less than 4 times the cable outer diameter due to bracket design limits, the connector will bear lateral mechanical stress.
This stress causes the male and female contacts inside to shift, reducing the effective contact area.
From a microscopic perspective, the reduced area increases current density, and local current overload can trigger micro-arcing.
In 1000 V or 1500 V high-voltage DC systems, the heat generated by these micro-arcs is extremely high.
By comparing the voltage drop at various points in a string, the loss can be quantified: if the total interface drop in a 20-module string exceeds 1V, the heat loss at full load has reached 15W to 20W.
This directly pulls down the output power of the whole string, making the power plant's PR (Performance Ratio) unable to reach the 80% design target.
Cross-mating of different connector brands is also a common cause of abnormal heating.
While connectors from different manufacturers look compatible, there are differences in the elastic modulus of metal shrapnel, plating thickness, and shell thermal expansion coefficients.
In high summer heat, the male part expands more than the female part, causing shell cracking; in winter cold, increased gaps lead to higher contact resistance.
Using a professional digital micro-ohmmeter can accurately measure these differences. If the resistance deviation of a cross-mated interface exceeds 0.2 mΩ, connectors must be unified to the same brand.
Furthermore, DC cable crimping quality must be verified using torque tools.
Connectors complying with the UL 6,703 standard typically require a tightening torque of 2.5 to 3.0 Nm for the cable gland nut to ensure the cable is locked firmly, preventing internal poor contact from wind vibration.
Over the full life cycle of a monocrystalline system, connectors are wear parts. Utilizing online monitoring with IR inspections can establish a complete heating history file.
If an array's interface temperature rise deviation from ambient increases year by year, it indicates irreversible performance decay.
For systems running over five years, focus on checking for mineral residue inside connectors from dried water, as this destroys silver plating and oxidizes the copper base.
For interfaces exceeding alert limits, local reinforcement is not recommended. Instead, cut off 5 cm to 10 cm of the cable end to expose unoxidized copper and use professional hydraulic pliers for 360-degree circumferential crimping to ensure long-term cold connection characteristics.
String Consistency Calibration
In daily O&M of monocrystalline silicon power plants, string consistency calibration is the foundational work for maintaining a PR above 80%.
For a typical 1000V or 1500V DC string composed of 18 to 24 series modules, the dispersion rate of electrical parameters must be controlled within a tiny range.
Under irradiance between 700 W/㎡ and 1,000 W/㎡, the Voc deviation between different strings in the same combiner box should not exceed 2%.
If a string with a design voltage of 900V has a measured voltage more than 18V lower than its neighbor, it indicates an electrical connection defect or module performance mismatch.
This voltage difference leads to circulating currents during parallel operation, causing high-voltage strings to feed back into low-voltage strings.
Measuring string consistency requires strict procedures and environment calibration to ensure data validity:
· Use a multimeter or string tester with accuracy no less than Grade 0.5, measuring Voc within 2 hours before or after noon.
· Record backsheet temperature. Since monocrystalline voltage drops by ~0.3% per degree Celsius rise, measurements must be converted to the 25°C standard condition.
· Compare short-circuit current (Isc) across strings; deviation should be within 3%. Inconsistency usually reflects local soil shading, inconsistent module selection, or high cable internal resistance.
· Check for cable length differences. In large plants, if String A's cable is 30 m longer than String B's, the DC voltage drop increases by ~0.5 V to 1.2 V. This ohmic loss accumulates into a significant energy gap over long-term operation.
When measured data shows a deviation above 5%, it usually indicates non-normal physical damage.
For example, micro-cracks in cells from mechanical stress, though invisible to the eye, cause the operating current (Imp) of that string to drop sharply.
Using an I-V curve scanner to obtain the full characteristic curve allows for deeper analysis of consistency issues.
A healthy string curve should be smooth with a Fill Factor (FF) higher than 0.75.
If the curve shows steps at the knee point, it indicates internal modules are shaded or damaged, increasing internal resistance. In this case, the inverter's MPPT function cannot find the true peak, dropping string output by 10% or more.
· Improper cable selection: Mixing 4mm² and 6mm² wires creates resistivity imbalances, breaking voltage consistency.
· Connector crimping quality: If one of dozens of MC4 points has a resistance of 5mΩ instead of the 0.5mΩ standard, it creates 0.5W extra heat at 10A and causes slight voltage fluctuations.
· Module binning mix: Modules are binned by power at the factory. Mixing 440W and 450W modules in a string limits the whole string to the lowest module current (the "barrel effect"), leading to ~2% energy loss.
To achieve refined management, O&M personnel should establish string consistency files every six months.
By comparing historical data, they can monitor if natural degradation is within the normal range of 0.5% to 0.7% per year.
If a string's voltage drops much faster than others, check if the bracket grounding is firm to prevent the PID effect from concentrating on high-load cells at the string end.
With 1500V systems, consistency is even more vital, as higher voltage means tiny resistance deviations are amplified by the square of the current into significant ohmic losses.
Insulation Strength Testing
Monocrystalline silicon modules are typically installed in 1000V or 1500V high-voltage DC circuits.
System insulation performance is determined by the XLPO layer of PV cables, the composite polymer of the module back sheet, and the sealing of MC4 connectors.
Per IEC 62446, for systems above 120 V, a 500 V or 1000 V DC megohmmeter must be used for ground insulation resistance testing.
In a dry and healthy monocrystalline array, insulation resistance per megawatt should be higher than 40 megohms.
If this drops below 1 megohm per kV of operating voltage, leakage current flows through the aluminum brackets and grounding to the earth.
For 1500V DC systems, the test voltage should be set to 1000V. A pass value is >1.5 megohms, though O&M suggests setting the alert threshold at 10 megohms to handle moisture intrusion on rainy days.
Module back sheets undergo photochemical degradation under long-term UV exposure, especially those using low-end PET, which may develop invisible micro-cracks after 5 to 8 years.
These cracks absorb water molecules when humidity exceeds 85%, forming tiny conductive channels.
Data shows that if three or more modules in a string have back sheet degradation, the total ground leakage current can rise from under 10 mA to over 100 mA.
Under 1500 V pressure, this leakage equals an extra 150 W ohmic loss per hour.
Two main measurement methods are used for insulation testing.
The first is the short-circuit test: temporarily shorting the string's positive and negative poles and measuring resistance between the shorted point and the ground. This gives the comprehensive insulation state of the circuit.
The second is the non-short-circuit test: measuring positive-to-ground and negative-to-ground resistance separately.
If positive-to-ground is much lower than negative-to-ground, it usually indicates insulation damage in cables or connectors near the string's positive end.
Procedures require testing in the early morning or evening when irradiance is below 200 W/㎡, or covering modules with shading cloth to prevent DC high voltage from shocking instruments or personnel during testing.
In coastal areas, chloride salt spray deposits in MC4 connector gaps, forming a conductive salt film.
Data shows insulation resistance drops exponentially as salt spray concentration increases by every 10%. In tropical rainforest climates, long-term mold growth also erodes cable jackets.
O&M personnel should record the rice history under different weather. If insulation recovery after rain increases from 2 hours to over 6 hours, it indicates water in cable trays or a drop in protection rating from IP68 to below IP54 somewhere.
When using a digital insulation tester, read the stable value after 60 seconds. Distribution capacitance between cables and modules interferes with initial readings during the charging phase.
Even if cable insulation is good, if bracket grounding resistance is above 4 ohms, accumulated static and induced overvoltage cannot be discharged, potentially breaking down insulation weak points at module edges.
In arid or rocky areas with high soil resistivity, grounding resistance must be forced below 2 ohms by deep vertical electrodes and resistance-reducing agents.
Regularly checking grounding continuity ensures leakage from insulation failure triggers overcurrent protection, avoiding fires from DC arcs.
For large ground-mounted plants, online insulation monitoring allows for real-time data collection.
The system monitors zero-sequence current via induction coils in the inverter.
If a DC branch's leakage exceeds 50 mA, the system generates a work order with coordinates, improving efficiency over manual inspections by 5 times.
In high-density inspections, using the Dielectric Absorption Ratio (DAR) and Polarization Index (PI) can more scientifically evaluate the moisture level of insulation materials.