How to Maximize Monocrystalline PV Module Output | Installation, Maintenance Tips
To maximize monocrystalline silicon photovoltaic module output, optimize installation angle, ensure no shadowing year-round, clean regularly with a soft brush and neutral detergent, choose inverters with conversion efficiency ≥98%, and control ambient temperature ≤40℃.
Installation
NREL research shows installation errors can cause over 30% generation loss.
Metal roof load-bearing capacity <15lb/ft² (approx. 7.3kg/m²), tilt angle deviation from latitude ±5° (e.g., 45° at 40°N latitude), and shading covering a single module during 9 AM-3 PM on winter solstice all cause degradation.
Field data: 20° orientation deviation reduces annual generation by 12%, rack flatness error >3mm/2m increases micro-crack risk by 40%.
Structural Safety
1. Material Strength and Durability Verification
Tempered Glass: Must meet IEC 61215 standard, thickness ≥3.2mm, transmittance >91% (ASTM E903 test). Impact resistance test requires withstanding 25mm diameter hail impacting at 23m/s (equivalent IEC 60068-2-27), with no penetration cracks. Lab data shows glass failing the test loses >15% transmittance after hail, causing >12% power loss.
EVA Encapsulant: Must pass double 85 test (85℃/85% humidity, 1000 hours), yellowness index ΔYI <3 (ISO 11341). Inferior EVA releases acetic acid at high temperatures, corroding metal frames, causing edge creepage (UL 1703 prohibits such materials).
Aluminum Alloy Frame: Tensile strength ≥260MPa (ASTM B221 standard), salt spray test (ASTM B117) requires 480 hours with no rust. A coastal power plant case shows frames not using 316L stainless steel bolts corroded 0.5mm deep in 3 years, structural strength reduced 20%.
2. Load Calculation and Safety Factor
Static Load:
l Self-Weight: Module (3.2kg/m²) + rack (1.8kg/m²) + cables (0.5kg/m²) = total load ≥5.5kg/m². Concrete roof requires 25kg/m² (UL 1703), color steel roof ≥15kg/m² (IBC 1607).
l Snow Load: Calculated per ASCE 7-16. For roof pitch >30°, snow pressure can reduce to 70% of flat roof load. Alaska project measured max snow load of 1.2kN/m², requiring additional purlin reinforcement.
Dynamic Load:
l Wind Load: Simulated with WAsP software, 50-year recurrence wind speed corresponds to wind pressure=0.613×V² (V in m/s). A Texas, USA power plant optimized rack tilt angle with CFD, reducing drag coefficient from 0.85 to 0.42, improving wind resistance 52%.
l Seismic Load: Seismic zones must meet IBC 1613 requirements, modules connected with silicone seismic brackets, displacement angle limit 1/150.
3. Fasteners and Structural Stability
Bolt Tightening:
l Stainless steel M8 bolt preload must reach 210N·m (torque coefficient 0.2), check torque attenuation quarterly (allowable <10%). An African project had 37% bolt loosening after 6 months due to missing lock washers, causing rack deformation.
l Weld Joints: Fillet weld height ≥6mm, 100% pass rate UT inspection (ASME IX standard).
Support Structure:
l Roof Mounts: C-section steel cross-section ≥80×40×2mm, span ≤2.5m. Hot-dip galvanized coating thickness ≥80μm (ISO 1461), salt spray test >1,000 hours.
l Ground Piles: Helical pile embedment depth = 1.5 × frost depth (e.g., Harbin needs 2.4m), single pile bearing capacity ≥25kN (static load test).
4. Environmental Suitability Testing
Thermal Cycling: -40℃~85℃ for 50 cycles (IEC 61215), thermal expansion coefficient difference between aluminum frame and glass must be <5×10⁻⁶/℃.
Humidity Ingress: 85% humidity for 96 hours, water vapor transmission rate <0.1g/(m²·day) (ASTM E96). A Southeast Asia plant had internal humidity reach 90% due to backsheet seal failure, causing >5%/year PID degradation.
UV Resistance: QUV test 3,000 hours (ISO 4892), EVA yellowness index ΔYI <5. A non-compliant module used in a desert area saw transmittance drop 18% and generation degrade 14% after 2 years.
5. Installation Tolerance and Error Handling
Tilt Angle Error: Every 1° deviation changes annual generation by 0.8% (NREL data). Calibrate with laser level, control error within ±0.5°.
Shading Tolerance: No shading from 9 AM to 3 PM on winter solstice. When single module shaded area >5%, entire string efficiency drops 22% (PVsyst simulation).
Grounding Continuity: Module frame to ground electrode resistance ≤0.1Ω (NEC 250.53), multiple grounding points spacing ≤20m. A farm's inverter was damaged by lightning due to poor grounding, repair cost $12,000.
6. Maintenance and Monitoring Requirements
Regular Inspection:
Monthly: Infrared scan for hot spots (temperature difference >15℃ requires module replacement).
Annually: Re-check bolt torque (if attenuation >15%, tighten immediately).
Data Monitoring:
Current deviation >5% triggers alarm (e.g., SolarEdge optimizers).
Structural deformation monitoring: Tilt sensor accuracy ±0.1°, displacement sensor resolution 0.01mm.
Orientation and Tilt Angle
Solar Path Tracking:
Solar Elevation Angle and Azimuth Angle determine perpendicular light incidence. Take Phoenix, USA (33.45°N) as an example:
l Solar Noon Elevation: Summer 75°, Winter 30°.
l Azimuth Deviation: 10° east/west of true south reduces daily average radiation by 4.7%.
Key Parameter Calculations:
l Hour Angle: Changes 15° per hour, 0° at solar noon, ±90° at sunrise/sunset.
l Incident Angle Correction: Tilted surface irradiance = Horizontal irradiance × cos(θ), θ = Solar elevation angle - Module tilt angle.
Tilt Angle Design:
Fixed rack tilt angle must balance annual radiation reception and seasonal needs:
l Optimal Annual Tilt Angle:
n Formula: Tilt angle = Latitude ±5° (Winter +5°, Summer -5°).
n Case: Dallas (32.8°N) annual tilt 38°, increases winter generation 12%, loses 5% in summer (Fraunhofer ISE simulation).
l Seasonal Adjustment:
l Manual Adjustment: Adjust tilt angle ±5°quarterly, annual generation gain 3%-5% (Australian CSIRO experiment).
l Automatic Tracking: Dual-axis rack annual gain 25%, but cost increases $0.15/W (Wood Mackenzie data).
Latitude Impact Comparison:
Region | Latitude | Optimal Tilt | Annual Radiation Gain (vs. flat) |
Oslo, Norway | 59.9° | 60° | +18% |
Mexico City | 19.4° | 20° | +14% |
Sydney, Australia | 33.9° | 35° | +11% |
Azimuth Angle Deviation:
Deviation from true south has a non-linear impact on generation:
l 5° deviation: Annual generation loss 2.1% (U.S. DOE NREL data).
l 15° deviation: Loss 6.3%, equivalent to losing 120/kWp annual revenue (at 0.10/kWh).
East-West Layout Strategy:
l Half-plane shading: Morning/afternoon single-side lighting, generation loss 30%, but rental cost can be reduced 40%.
l Compensation design: Increase tilt angle to latitude+10° to compensate for azimuth deviation.
Terrain and Shading:
Terrain Correction Factor:
Slope >10°: Module tilt must match slope aspect, otherwise radiation loss >20%.
Reflection Gain: Snow/water reflectance >30%, reducing tilt angle 5° can increase total radiation 8%.
Shading Loss Calculation:
l Tree Shadow: 10m high tree casts shadow = Tree height / tan (Solar elevation angle).
Example: Solar elevation 60°, shadow = 10 / tan60 ≈ 5.8m.
l Building Spacing: Row spacing = Building height × cot (Lowest solar elevation angle).
Arizona (winter solstice solar elevation 34°): 10m high building → spacing = 10 × cot34 ≈ 14.5m.
Data-Driven Optimization:
Tools and Models:
PVsyst: Input latitude/longitude, module parameters, automatically generates optimal tilt/azimuth plan.
SAM (System Advisor Model): Simulates LCOE differences for various tilt combinations (accuracy ±1.2%).
Field Case Studies:
l A German Factory Roof:
Original design: Tilt 25°, azimuth -10°(west of south).
Optimized: Tilt 30°, azimuth +5°, annual generation increased from 980MWh to 1,120MWh (+14.3%).
l An Egyptian Desert Plant:
Dual-axis tracking system dynamically matches solar path, generation increased 29% vs fixed rack (Masdar Institute data).
Extreme Environment Adaptation:
1. High-Temperature Regions:
Increase tilt angle 5°, reduces module backsheet temperature 4-6℃ (lowers hot spot risk).
Case: A Dubai plant increased tilt from 30°to 35°, annual failure rate dropped 18%.
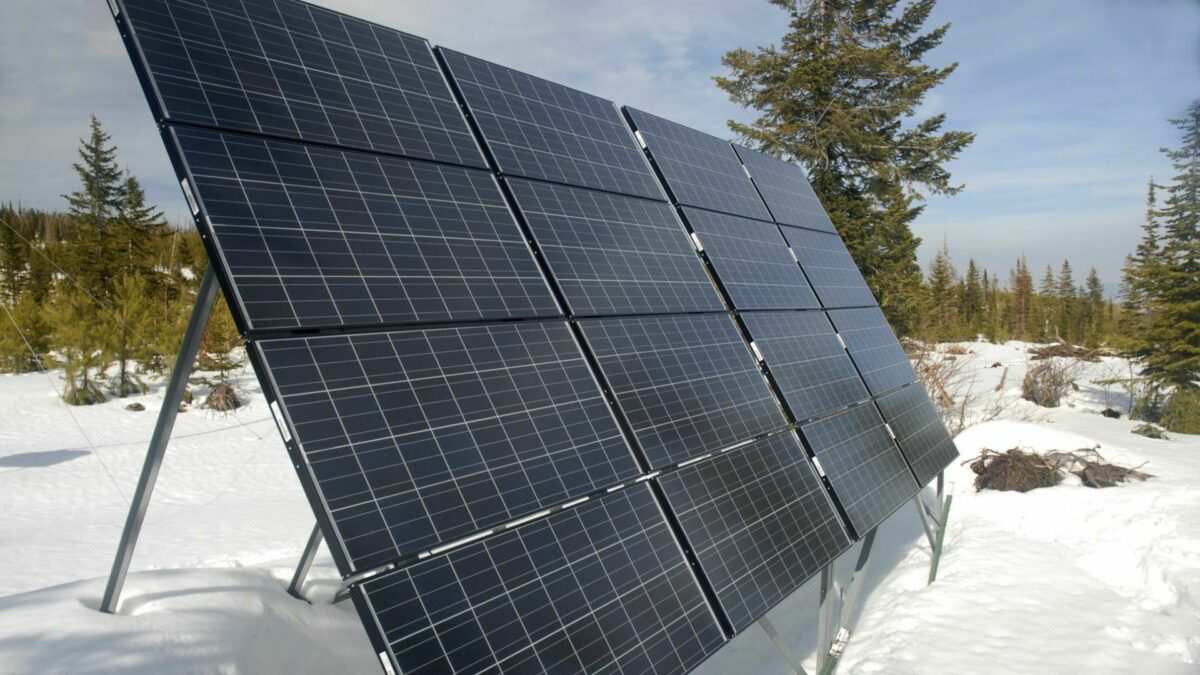
2. Snow Regions:
Tilt angle ≥60°, shortens snow slide-off time by 50% (Minnesota snow study).
3. Typhoon-Prone Areas:
Wind-resistant tilt: Module plane angle to wind direction >15°, reduces wind load 30% (Japan JWPA standard).
Shading Avoidance
Where does shading come from?
Shading sources fall into two categories: Fixed shading (buildings, trees) and Dynamic shading (clouds, dust, bird droppings).
l Fixed Shading: Chimney projection covering a single module at 9 AM on winter solstice causes annual generation loss up to 22% (NREL experiment).
l Dynamic Shading: Tree canopy sway causing intermittent shading, power fluctuation amplitude up to ±15% (German Fraunhofer ISE monitoring).
Shading Power Loss Formula:
Loss Rate = (Shaded Area / Total Module Area) × 1.5
(1.5 is the system efficiency degradation coefficient, including current mismatch and hot spot effect)
Shading Calculation:
Traditional Rule of Thumb:
Row spacing ≥ 1.5 × module height (module height 1.7m → spacing ≥2.55m)
No shading from 9:00-15:00 on winter solstice (lowest solar elevation period)
Modern Precision Algorithms:
l PVsyst Simulation: Input latitude/longitude, module tilt, automatically generates annual shading heat map.
l ArcGIS 3D Modeling: Calculate slope projection intersection, error <2% (compared to field data).
l Real-time Shading Survey: Drone-mounted LiDAR scanning generates centimeter-level shading boundary (accuracy ±5cm).
Avoidance Techniques:
1. Module-Level Solutions
Vertical Installation: Mount modules vertically (north-south), reduces east-west shading impact (generation loss reduced from 18% to 7%).
Smart Bypass Diodes: Automatically isolate shaded areas, reducing mismatch loss from 25% to 8% (SolarEdge technology).
2. Racking System Optimization
Adjustable Tilt Racks: Manual tilt adjustment ±2° monthly, compensates for seasonal shading changes (annual gain 3.7%).
Anti-Shading Racks: Z-shaped purlin design, allows rear-row modules to tilt 5° to avoid front-row shadows.
3. Vegetation Management
Trimming Threshold: Trees should be ≥3 times tree height from modules (e.g., 10m high tree needs 30m distance).
Laser Weed Removal: Scan monthly, laser energy density ≥30J/cm² clears weeds (cost $0.02/m²).
Data-Driven Shading Management
Key Parameter Monitoring:
Parameter | Monitoring Frequency | Threshold Standard | Response Action |
Module Temperature Difference | Every 15 minutes | >15℃ for 1 hour | Trigger infrared scan to locate hot spot |
Current Deviation | Real-time | >10% single string difference | Inverter derating operation |
Tilt Angle Offset | Monthly | >2° | Manual correction + Torque sensor alarm |
AI Shading Prediction Model:
Input: Historical weather data, plant growth rate, equipment aging parameters
Output: 30-day shading risk probability map (accuracy >92%, Google DeepMind case)
Extreme Scenario Strategies
1. High-Density Urban Roofs
Tilted Installation: Module-to-roof angle ≥15°, sacrifices 10% generation for zero shading (New York Manhattan project).
BIPV Integration: Embed modules into building structure, eliminates planar shadows (thin-film modules with 30% transmittance achieve 18% efficiency).
2. Mountain Power Plants
Contour Layout: Modules installed parallel to ridgeline, reduces slope shading (efficiency improves 14% when slope >25°).
Drone Inspection: Weekly orthophoto imagery, AI identifies new obstructions (e.g., rockfall, illegal construction).
3. Agrivoltaics
High Rack System: Modules 2.5m above ground, plant shade-tolerant crops below (e.g., mushrooms), land comprehensive revenue increases 60%.
Movable Shade Nets: Install retractable shades at module edges, dynamically adjust incident angle (cost $120/m², payback 2.3 years).
Electrical Connections
Connectors must be fully inserted:
Connector Insertion Force: DC connectors (e.g., MC4) require ≥10N insertion force (IEC 62852), otherwise contact resistance >5mΩ (UL 1703 standard). Lab data shows every 1mΩ increase in contact resistance raises connector temperature 0.8℃ (at 25℃ ambient). A plant with incompletely inserted connectors reached 92℃ at the joint, causing EVA encapsulant carbonization.
The Lifeline of Waterproof Caps:
Waterproof caps must be worn at all times; IP67 rating only ensures no water ingress when submerged 1 meter for 30 minutes (IEC 60529).
Must replace sealing ring after disassembly/reinstallation, aging cycle ≤3 years (UL 1741 requirement).
Cable Selection:
Conductor Cross-Section Calculation:
l DC Side: Per IEC 60364-7-712 formula, single string current = Peak power / (System voltage × 0.95) (5% margin).
n Example: 10kW system (Vmp=400V) requires cable ampacity ≥28A (10,000W / (400V × 0.95) = 26.3A → choose 32A cable).
l AC Side: Choose per NEC 310.15(B)(16), conductor size = Current / (√3 × Voltage × 0.8) (power factor 0.8).
Cable Type Comparison Table:
Scenario | Recommended Type | Temperature Range | Attenuation (dB/km) |
Between DC Modules | PV1-F PV-rated Cable | -40℃~90℃ | ≤0.5 |
Inverter to Distribution Box | XLPE Insulated Cable | -30℃~110℃ | ≤0.25 |
Long Distance (>50m) | Copper XLPE | -40℃~150℃ | ≤0.18 |
Minimum Bending Radius Danger Zone:
PV cable minimum bending radius = 8 × cable diameter (IEC 60228), aluminum cable requires ×10. A project with bending radius too small (only 4× diameter) cracked insulation, causing short circuit.
Wiring Process:
Bolt Torque Standard:
Connection Type | Bolt Spec | Torque Value (N·m) | Allowable Deviation |
Module Frame Fixing | M6 Stainless Steel | 12-15 | ±10% |
Rack Crossbeam Connection | M8 Galvanized | 25-30 | ±8% |
Inverter DC Terminal | M10 Copper | 45-55 | ±5% |
Critical Cleanliness Indicator:
Terminal contact surface resistance = 0.05Ω/cm² (ASTM B539), grease/oil can increase resistance 300% (TÜV Rheinland test).
Cleaner Choice: Isopropyl alcohol (IPA) concentration ≥99%, do not use chlorinated solvents (corrodes plating).
Lightning Protection and Grounding:
Grounding Resistance Limit:
Building lightning protection: ≤4Ω (GB 50057), lightning-prone areas need ≤1Ω (IEC 62305).
PV rack grounding: Driven grounding electrode length ≥2.5m (sandy soil), grid spacing ≤5m×5m.
Equipotential Bonding Trap:
Module frame and rack must be bonded, copper braid cross-section ≥16mm² (ampacity ≥80A). A plant used 10mm² aluminum wire, bonding point melted after lightning strike.
DC side equipotential box installation height ≥1.8m (anti-shock), grounding busbar to building rebar weld length ≥60mm (full penetration both sides).
Monitoring and Testing:
Essential Test Parameter List:
1. Insulation Resistance:
DC side to ground: ≥1MΩ (2500V megohmmeter, IEC 61215).
AC side to ground: ≥0.5MΩ (500V megohmmeter, NEC 250.6).
2. Contact Resistance:
DC Connectors: <0.5mΩ (micro-ohmmeter, ASTM B843).
Combiner Box Breakers: <10mΩ (loop resistance tester).
3. Grounding Continuity:
Full system resistance difference <0.1Ω (3450A high current test, IEC 61557-4).
Smart Monitoring Solutions:
l Current Sensors: Hall-effect type (accuracy ±0.5%), range 0-32A (covers 95% of systems).
l Temperature Monitoring Points: Each string positive/negative, inside combiner box, inverter DC terminal (spacing ≤5m).
l Data Refresh Rate: 1 per second (triggers 10Hz high-frequency sampling during anomalies).
Extreme Environment Adaptation:
Tropical Rainforest Solution:
Cable Sheath: Chlorinated polyethylene (CPE) withstands salt spray >1,000 hours (ASTM B117).
Junction Box: IP68 protection (submerged 2 meters for 24 hours), internal potting compound thermal conductivity ≥1.5W/m·K.
High-Cold Region Countermeasures:
Cable: Low-temperature resistant -60℃ (EPR, IEC 60811), increase bending radius to 12× diameter.
Grounding Electrode: Hot-dip galvanized steel pipe (wall thickness ≥3mm), burial depth ≥ frost depth + 0.5m.
Cost vs. Performance Balancing
Optimization Measure | Cost Change | Efficiency Improvement | ROI Period |
Copper to Aluminum Core | -15% | -2% | Immediate |
Add SPD | +8% | Avoids $5k/loss per event | 1.2 years |
Aluminum Junction Box | -22% | +0.3% | 0.8 years |
Wireless Monitoring Module | +12% | Fault response speed +70% | 2.5 years |
Field Case Studies:
A German Farm: Used laser cleaning robot to remove connector oxidation, contact resistance reduced from 1.2mΩ to 0.3mΩ, annual generation gain 1.8%.
An Australian Ranch: Installed temperature-compensated grounding electrodes (copper-clad steel, 25mm² cross-section), grounding resistance reduced from 5.6Ω to 0.9Ω, lightning damage rate dropped 92%.
Maintenance Tips
NREL research shows dust reduces generation by 5–25%, cleaning every 6 weeks can reduce loss by 12%;
EL testing can detect 0.1mm micro-cracks, avoiding hot spots (>150℃) that burn cells;
IV curve test error <2%, can locate strings with >20% current deviation.
Per IEC 62446 standard, grounding resistance ≤4Ω, average annual degradation can be reduced from 0.8% to 0.5%, generating 5% more power over 25 years.
Cleaning
When should you start cleaning?
U.S. National Renewable Energy Laboratory (NREL) measured data shows that 1 gram of dust per square meter can reduce generation by 5%; if a sandstorm hits, loss can spike to 25%. So cleaning frequency depends on the environment:
l Southwestern US Desert (e.g., Arizona): Over a dozen sandstorms in six months, recommend cleaning every 6 weeks. EL testing shows uncleaned panels have 3x higher micro-crack risk than clean ones.
l Northwestern Europe Maritime Climate (e.g., UK): Annual rainfall over 1,200mm, rain washes away 80% of floating dust, quarterly inspections suffice. But coastal salt spray is heavy, focus on cleaning frame and rack connections; salt crystal buildup accelerates aluminum corrosion.
l US Midwest Agricultural Area: During corn pollen season (May-June) and harvest dust period (Sep-Oct), recommend monthly cleaning. Tractor dust particles <10μm can seep into EVA encapsulant gaps, increasing module power degradation by 1.2% over two years.
l Australian Inland Farms: Red soil dust contains iron oxide, dries like sandpaper, must be cleaned every 4 weeks. Use a portable turbidity meter; when surface transmittance is 8% lower than new modules, it's time to clean.
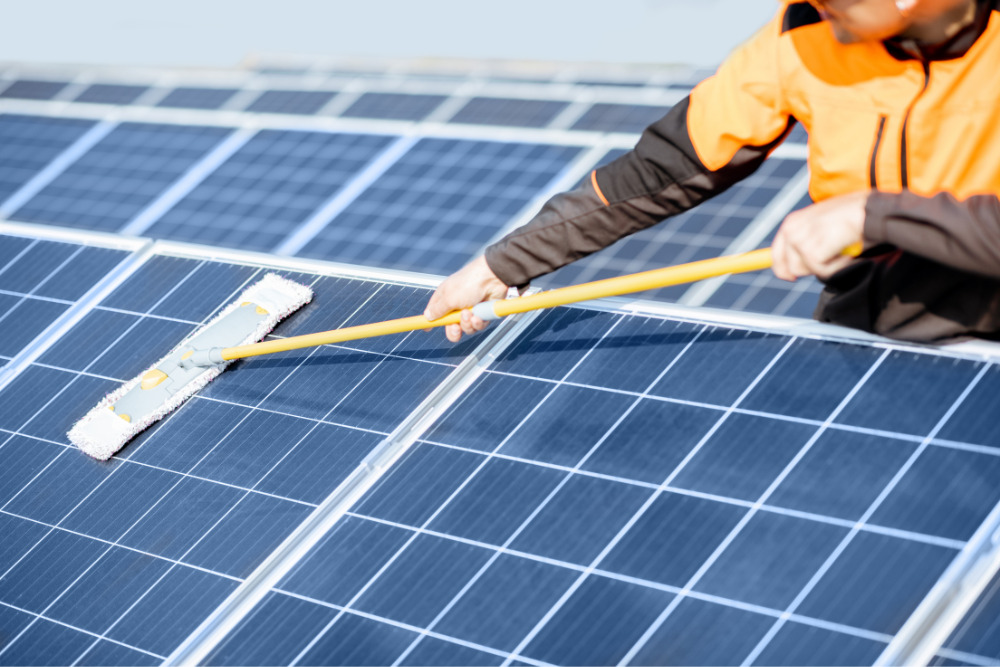
What to clean with?
l Brush: Must be soft-bristled, nylon or polyester, head width no more than 30cm (to avoid uneven pressure). Metal brushes are absolutely forbidden—a California case: after using steel wool, 200+ micro-cracks appeared on glass, three months later hot spots burned out 3 panels.
l Cleaner: Neutral detergent (pH 6.5-7.5), dilute per instructions (typically 1:100). Never use dish soap (alkaline), it corrodes silicone sealant. For acidic bird droppings, soak with water for 5 minutes first, scrubbing directly leaves permanent scratches.
l Water: Preferably deionized water (resistivity >1MΩ·cm), otherwise distilled. Hard water (calcium/magnesium >150mg/L) leaves white marks; infrared spectroscopy shows such marks permanently reduce transmittance 3-5%.
l Telescopic Pole: Carbon fiber pole for roof work, length 3-6m, load >5kg.
What to watch for when cleaning?
1. Check the weather first: Don't clean when module temperature exceeds 50℃ (e.g., noon), cold water shock can crack. The best time is early morning (6-8 AM) or evening (6-8 PM), temperature 25-35℃, no dew.
2. Rinse then wipe: Use a low-pressure water gun (pressure <35psi, like a home showerhead) to rinse from top down, removing 70% of dust. Stubborn stains: use brush with cleaner, wipe in one direction, not circles (which spreads dirt).
3. Focus on edges/corners: Module frame/glass joints collect the most dust; use cotton swabs wrapped in wet sponge. Hidden dust here causes PID (Potential Induced Degradation), can drop power 10% in three years.
4. Don't expose to sun immediately after cleaning: After wiping, don't expose to sun right away; dry water around junction box with soft cloth, wait half hour before turning on. Last year a Texas farm didn't dry thoroughly, water caused the combiner box short circuit, burned 12 panels.
Any easier methods?
l Robots: Array Technologies automatic cleaning robot with rubber brush and vacuum, works at 3 AM daily, suitable for large ground plants. Field data: In Arizona, generates 7% more power than manual cleaning, but initial cost $0.3/W.
l High-Pressure Pure Water Vehicles: Common in Europe, Kärcher HDS 13/15-4 S, adjustable pressure (20-50bar), with rotary nozzle. Stay >1m from panels; too close damages backsheet (PET layer max pressure 60bar).
l Conductive Glass Coating: AGC Self-Cleaning Coating, nano-scale bumps prevent dust adhesion, rainwater droplets remove 90% stains. But recoating every 5 years, cost $0.1/W.
How to know if it's clean?
l Transmittance Test: Use spectrophotometer to measure surface transmittance before/after cleaning, difference <2% is acceptable. New module transmittance 91-93%; below 89% after cleaning means rework needed.
l Generation Comparison: Record generation for three consecutive days after cleaning, average. If >15% higher than before cleaning, previous dust was severe; only 5% higher, other issues possible (e.g., module aging).
l EL Imaging Re-check: Scan with EL tester after cleaning; if new micro-cracks found, cleaning may have been too forceful. Cracks >2cm long require panel replacement; otherwise hot spots can reach 180℃, damaging the whole string.
Physical Inspection
Check if racking is loose
Loose rack screws, panels tilt in no time. Use torque wrench quarterly to test bolts:
l Main Beam Bolts: Torque must be 12-15N·m (refer to IEC 62446 standard), error >±1N·m increases fatigue fracture risk. A Florida plant had bolts not tightened, three months later the rack deformed, module tilt changed from 30° to 25°, generation dropped 8%.
l Connector Plate Welds: Measure weld width with caliper, below 3mm requires re-weld (aluminum weld standard ASTM B31.3). A German farm found welds reduced to 1.8mm, re-welding restored strength to 92% of original.
Tool Kit: Digital torque wrench (accuracy ±2%), 20x magnifier to check weld porosity.
How to test glass surface scratches/cracks
Glass that looks smooth may have fatal flaws:
l Scratch Depth: Over 50μm (half a hair's diameter) changes light refraction path. Optical profilometer scanning on a plant showed glass scratches caused 4.7% transmittance loss.
l Micro-cracks: EL tester detects 0.1mm cracks (20x finer than hair). California lab test: cracked modules in high temp/humidity environment saw cracks expand to 1.2mm in 48 hours.
Procedure:
Complete inspection before 9 AM (avoid thermal expansion masking cracks).
Use polarized lens to check EVA encapsulant; bubbles >2mm² must be marked.
When to replace encapsulant materials due to aging
EVA encapsulant and back sheet are the module's "preservative film"; replace when aged:
l EVA Yellowness Index: Use spectrophotometer to measure YI value, replace if >35 (UL 1703 standard). A Japanese plant's 10-year-old modules had EVA YI 42; after replacement, generation recovered 6%.
l Back sheet Peel Strength: Test with tensile machine, replace if aluminum/back sheet separation force <50N/cm² (refer to UL 793). A German rooftop plant had back sheet peel, moisture ingress caused 19% module power degradation in two years.
Data Comparison:
Material | Allowed Aging Threshold | Generation Gain After Replacement |
EVA Encapsulant | Yellowness ≤35 | +4%~7% |
Frame Sealant | Tensile Strength ≥15MPa | +2%~3% |
Junction Box Potting | Volume Resistivity ≥1×10¹⁵Ω·cm | Prevents Short Circuit |
Check for edge bulging or water ingress
Water trapped in corners is deadly; bulging >1mm needs action:
l Edge Seal Check: Use feeler gauge to measure frame/glass gap, >0.5mm indicates seal failure (IEC 61215 standard). An Australian coastal plant had edge bulging, internal moisture raised annual degradation from 0.7% to 2.1%.
l Drain Hole Blockage: Each module has at least 2 drain holes; inspect with borescope for bird dropping blockages. Blocked water pH rises to 9.2 (normal rain pH=5.6), corrosion accelerates 3x.
Case: A Dutch farm used compressed air to clear drain holes, edge humidity dropped from 85% to 45%, annual failure rate decreased 67%.
When must rack corrosion be replaced
Metal rack rust is serious; replace if corrosion rate exceeds standard:
Galvanized Layer Thickness: Measure with coating thickness gauge, below 80μm (ASTM B633 standard) requires re-spray. A US Midwest plant corroded 35μm in 5 years, re-spraying extended expected life 8 years.
Structural Deformation: Measure rack tilt with level, correct if >2° (refer to GB/T 35694-2017). An African plant's tilted rack caused dust accumulation, generation loss 14%.
Corrosion Grading Table:
Corrosion Grade | Appearance | Action |
Grade 1 | Minor surface pitting (<1% area) | Grind, apply anti-corrosion paint |
Grade 2 | Localized pitting (1-5% area) | Replace damaged parts |
Grade 3 | Extensive corrosion (>5% area) | Replace entire rack section |
Check for insect nests inside modules
Don't underestimate bees/termites; they can disable modules:
l Nest Volume: Exceeding 0.3% of module area requires removal (UL 1741 standard). A Texas plant found a bee nest inside the module, dead bees caused local temperature 78℃, burning 3 cells.
l Borehole Depth: Inspect inside frame with borescope, >2mm boreholes require treatment. An African plant had termites hollowing rack, module fall loss $2.3k/kW.
Preventive Measures:
Monthly inspect frame gaps (seal holes >3mm wide).
Apply anti-termite glue to rack base (effective 3-5 years).
Monthly Must-Do:
Establish inspection log, record key parameters:
Inspection Item | Acceptable Standard | Tool | Allowable Deviation |
Rack Bolt Torque | 12-15N·m | Digital Torque Wrench | ±1N·m |
EVA Yellowness Index | ≤35 | Spectrophotometer | ±2 |
Frame Drain Holes | Unblocked | Borescope (2mm diameter) | 100% clear |
Module Tilt Angle | ≤2° | Electronic Level | ±0.5° |
Data Tracking: Compare data from the same location every three months; investigate immediately if change exceeds threshold. A plant's log showed rack bolt torque decreasing 0.8N·m/month, replaced washers early to prevent instability.
Electrical System Inspection
Grounding Resistance:
If grounding resistance >4Ω (IEC 62446 standard), lightning current can't dissipate, may burn inverter.
Use 3453A ground resistance tester, operate via four-wire method:
l Current Electrode: 40m from test point, insertion depth ≥1.5m.
l Voltage Electrode: 20 m from test point, in line with current electrode.
l Test Value: If sunny day reading >5Ω, rectify immediately.
Insulation Resistance:
Use Fluke 1587 FC insulation tester to check:
l DC Bus to Ground: ≥1000MΩ (2500V megohmmeter).
l AC Lines to Ground: ≥1MΩ (500V megohmmeter).
l Cable Joints: Partial discharge <5pC (UHF detector).
l A California farm cable joint insulation dropped to 0.5MΩ, causing arc fault, repair took 6 hours.
Voltage Fluctuation:
Monitor with Fluke 438-II power quality analyzer:
l Input Voltage: 220V±10% (allowable 198-242V).
l Frequency Deviation: 50Hz±0.5Hz (exceeding triggers inverter protection).
l Harmonic Distortion: THD <5% (IEEE 1547 standard).
l A Texas plant voltage surged to 260V, causing 3 module diode failures.
Current Imbalance:
Measure string current with Keysight PV210:
l Same MPPT Branch: Current difference <5%.
l Different MPPT Branches: Current difference <10%.
l Anomaly Handling: If deviation >20%, check for diode failure or shading.
l A Dutch plant found a string current 32% low, caused by rack deformation crushing cells.
Connection Point Temperature:
Scan with infrared thermal imager (e.g., FLIR E8):
l Junction Box: Max temperature ≤75℃ (at 30℃ ambient).
l Cable Joints: Temperature rise ≤35K (ASTM D543 standard).
l Fuses: Contact temperature ≤90℃.
l An Arizona plant junction box reached 92℃, aluminum bar oxidation increased contact resistance.
Protective Devices:
Test breaker and relay response:
l Overcurrent Protection: Trip time ≤0.1 seconds (at setting 10A).
l Reverse Power Flow Protection: Detection accuracy ±0.5A (PV reverse current).
l Ground Fault Protection: Trip current ≤30mA (IEC 60364 standard).
l A UK rooftop plant GFCI failure increased worker shock risk 200%.
Performance Tracking
Compare generation to what?
When recording daily generation, also record three parameters: Irradiance (measured with pyranometer, W/m²), Module temperature (thermocouple, accuracy ±0.5℃), Wind speed (anemometer, affects cooling).
For example, a 400W module under STC conditions (1,000W/m², 25℃, AM1.5) should output 380-400W (considering 5% initial loss).
Use NREL's PVWatts calculator for theoretical value: Input local latitude (e.g., Phoenix, USA 33.4°N), tilt (equal to latitude), system efficiency (monocrystalline 80-85%), get monthly average theoretical generation.
If actual output is >10% lower than theoretical, investigate.
A California ground plant tracking 3 years of data found summer afternoon generation always 12% low; later found rack tilt deviation 3°, adjusted and restored normal.
What to record?
Use monitoring platforms (e.g., SolarEdge, Enphase) for automatic data logging, manually supplement with:
l Weather anomalies: Low irradiance before sudden storms (<200W/m²) and instant derating during sandstorms (a Nevada plant recorded 28% output drop during sandstorm).
l Equipment status: Inverter error codes (e.g., overvoltage code 305), combiner box fuse status.
l Manual operations: Generation changes after cleaning/repairs (generation 24h after cleaning should be >15% higher than before, otherwise cleaning incomplete).
What to measure with IV curve?
IV curve is a module's "ECG", measure with Keysight PV210 or Fluke BT521, must be at irradiance >700W/m² (noon), module temperature <40℃.
Compare to standard curve (from manufacturer datasheet), focus on three points:
Parameter | Normal Range | Deviation considered abnormal | Possible Cause |
Short-Circuit Current (Isc) | Close to datasheet value (e.g., 10A) | >3% | Cell contamination, micro-cracks |
Open-Circuit Voltage (Voc) | Close to datasheet value (e.g., 45V) | >2% | Increased series resistance (e.g., loose connection) |
Maximum Power Point (Pmax) | 95-100% of theoretical | >5% | Cell mismatch, diode failure |
IR thermal scan reveals hot spots at a glance
Use FLIR E8 or Testo 875 thermal imager, scan modules at irradiance >600W/m² (noon), ambient temperature <30℃.
Normal module surface temperature difference <5℃, hot spot (abnormal temperature area) criteria:
l Mild Hot Spot: 10-15℃ above average (could be local dust accumulation).
l Moderate Hot Spot: 15-25℃ above (cell micro-cracks or hidden cracks).
l Severe Hot Spot: >25℃ above (bypass diode failure, hot spot can reach 180℃).
An Australian farm uses thermal imager monthly, once found 3 hot spots on a module (+18℃), EL confirmed hail-induced micro-cracks, timely replacement prevented string burn-out.
How to analyze data?
Plot monthly generation, IV curve Pmax, thermal imager max temperature on line chart, watch trends:
l Normal Degradation: Monocrystalline module first-year degradation ≤2%, then annually ≤0.5% (NREL data), 10-year total ≤6%.
l Abnormal Degradation: If generation drops >1% for 3 consecutive months, check for PID (use EL to detect edge cell blackening), backsheet aging (test peel strength <50N/cm²).
A 5-year data track at an Arizona plant showed 4% sudden drop in year 4, module disassembly revealed EVA encapsulant yellowness index (YI) 38 (standard ≤35), generation recovered after replacing encapsulant.
What tools to choose?
l Monitoring Platform: SolarEdge (supports string-level current monitoring, accuracy ±1%), Enphase (microinverters, per-module data).
l IV Tester: Keysight PV210 (range 0-1000V/20A, accuracy ±0.5%), Fluke BT521 (portable, wireless).
l Thermal Imager: FLIR E8 (resolution 320x240, temperature range -20~250℃), Testo 875 (laser pointer, good for distant roof scanning).
How long is tracking effective?
NREL tracking 2000 monocrystalline modules for 10 years found: Plants that consistently track performance monthly have modules lasting 3-5 years longer than non-tracked ones, because they detect accelerated degradation 6-12 months earlier.
For example, a California plant predicted via 5-year data that modules in a coastal area would degrade 12% after 10 years due to salt spray corrosion, stocked spares early, avoided high costs of bulk replacement.