Buy Guide to Polycrystalline Solar Modules | Efficiency, Size, and Conversion
When purchasing polycrystalline silicon solar modules, pay attention to the photovoltaic conversion efficiency (12%-18%), standard size (156.75×156.75mm±0.25mm), and low-light performance.
Prioritize products that have passed CE/TUV certification, with a cell interstitial oxygen content ≤1.5×10¹⁶ atoms/cm³.
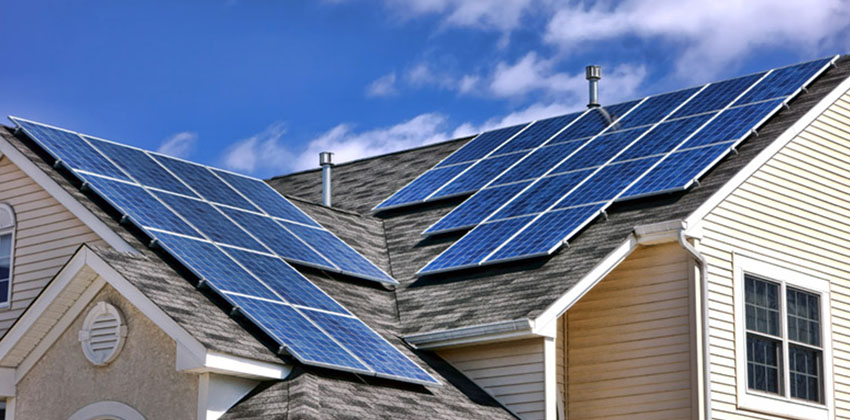
During installation, ensure an inclination angle of 30°-40° and avoid shading.
Efficiency
Mainstream polycrystalline silicon efficiency is 17%-20% (NREL 2023), 2-3 percentage points lower than monocrystalline's 20%-23%.
Its temperature coefficient of -0.4%/℃ causes efficiency to drop 14% at 60℃, with a first-year degradation of 2%-3%.
A 1% efficiency difference, in a region with 1500 annual sunshine hours, leads to an annual power generation difference of 0.15 kWh/W, directly impacting the return on investment.
Testing Standards
What exactly do testing standards measure?
STC defines three immutable "baseline environments":
l Irradiance: 1000W/m² (equivalent to peak noon solar radiation at the equator on a clear day);
l Cell Temperature: 25℃ (monitored in real-time with a thermocouple attached to the center of the cell);
l Spectrum: AM1.5G (the global average spectrum for air mass 1.5, covering ultraviolet to infrared, with energy distribution confirmed by the International Commission on Illumination, CIE).
The efficiency calculation formula comes directly from these three parameters: Efficiency(%) = (Module STC Maximum Power (W) ÷ (1,000W/m² × Module Area (m²))) × 100%.
For example, a 1.63m² module with 300W STC power has an efficiency = 300÷(1000×1.63)=18.4%.
Beyond STC:
STC represents ideal conditions; actual testing requires controlling variables, otherwise data will be skewed. For example:
l Temperature Compensation: If the ambient temperature during testing is 30℃, a cooling device (like a semiconductor cooling plate) is needed to control the cell temperature at 25±2℃. A temperature difference exceeding 2℃ can cause a 0.8% efficiency error (based on the polycrystalline silicon coefficient of -0.4%/℃);
l Spectral Match: A solar simulator provides the light, and its spectrum must match AM1.5G. A Class A simulator allows a spectral deviation of ±25% (UV band), ±15% (visible light), while Class B relaxes this to ±40%; the latter may overestimate efficiency by 0.5%;
l Irradiance Uniformity: The irradiance deviation within the simulator's light spot must be <±2%; otherwise, the power difference between the module edge and center exceeds 3W, affecting the maximum power point judgment.
Testing Equipment:
The solar simulator is the core testing equipment, divided into three classes (IEC 60904-9 standard):
Class | Spectral Match | Irradiance Uniformity | Irradiance Stability | Application Scenario |
Class A | ±25% | ±2% | ±1% | Third-party certification (e.g., TÜV) |
Class B | ±40% | ±5% | ±2% | Manufacturer factory sampling |
Class C | ±60% | ±10% | ±5% | Educational demonstration |
High-end simulators (e.g., Berger Lichttechnik PSS-16) use a xenon lamp + filter combination, achieving spectral match within ±15% and irradiance stability of ±0.5%, requiring 30 minutes to test one module (including warm-up, MPPT curve scanning).
Testing Process:
1. Pre-treatment: Place the module in a 25℃, 50% humidity environment for 24 hours to eliminate shipping stress;
2. Visual Inspection: Use a magnifying glass to check for cell micro-cracks (>2mm cracks result in immediate rejection);
3. Wiring: Connect using the four-wire method (two current leads, two voltage leads), contact resistance <0.1Ω (to avoid voltage drop interference);
4. Temperature Control: Start the cooling system, attach a thermocouple to the cell center, control temperature to 25±1℃;
5. MPPT Scan: Use the Perturb and Observe method (step size 0.1V) to find the maximum power point, record voltage, current, power;
6. Repeat Test: Test the same module 3 times; if the power deviation is >0.5%, retest (to eliminate random error);
7. Data Calculation: Calculate efficiency based on area, generate a timestamped test report (including simulator model, calibration date).
Standards in Different Regions:
l IEC 61215 (International Electrotechnical Commission): Basic performance standard, requires thermal cycling (-40℃~85℃, 200 cycles), humidity freeze (-40℃ immersion in ice water), mechanical load (5400Pa wind pressure) tests; modules must pass to be labeled "IEC certified";
l UL 1703 (Underwriters Laboratories): Stricter safety requirements, adds fire resistance (module backsheet flame retardant rating V-0), arc fault (simulating internal short circuit) tests; mandatory for the US market;
l TÜV Rheinland: Focuses on long-term reliability, adds PID (192 hours at 85℃/85% humidity + 1000V voltage, efficiency degradation <5%), salt spray corrosion (5% NaCl spray for 1,000 hours) tests; recognized by the European residential market.
Where Errors Hide:
l Area Measurement: Module dimensions are measured with a laser rangefinder (accuracy 0.1mm). If a tape measure is off by 1cm (for a 1.6m² module), the area error is 0.6%, and efficiency is miscalculated by 0.6%;
l Aging Impact: If a module is left outdoors for 3 months before testing, the surface anti-reflective coating may be slightly worn, reducing efficiency by 0.3%-0.5%;
l Calibration Frequency: The reference cell (used to calibrate the simulator) needs to be sent monthly to NIST (National Institute of Standards and Technology) for traceability. If not calibrated for six months, simulator irradiance error reaches 1.2%, overestimating efficiency by 1.2%.
Third-Party Certification:
l NREL (National Renewable Energy Laboratory): Publishes an open test database. In 2023, tested 50 polycrystalline silicon module models, with nameplate efficiencies of 18%-20%, but actual measurements averaged 0.6% lower. One small manufacturer labeled 19% but measured 17.7% (overstated by 1.3%);
l PVEL (PV Evolution Labs): Performs accelerated stress tests, like DH1000 (1,000 hours at 85℃/85% humidity). Modules that pass have a first-year degradation <2%, while those that fail reach 3.5%;
l Fraunhofer ISE (Fraunhofer Institute for Solar Energy Systems): Measures temperature coefficients. Polycrystalline silicon samples averaged -0.42%/℃, while one brand labeled -0.38% but was actually -0.46% (misstated by 0.08%/℃).
Influencing Factors
Silicon Material Purity:
The purity of polycrystalline silicon directly affects carrier lifetime and conductivity.
l Boron/Phosphorus Content: For every 1ppm increase in boron (effective doping concentration), the open-circuit voltage (Voc) decreases by 0.8mV, resulting in an efficiency loss of about 0.1%. For example, a 6N (99.9999%) pure silicon wafer containing 0.25ppm boron sees Voc drop from 680mV to 678.4mV.
l Metal Impurities: Heavy metals like iron (Fe) and copper (Cu) reduce minority carrier lifetime by 10% for every 0.1 ppm increase, causing a 0.2% efficiency drop. One manufacturer's ICP-MS detection found that unpurified silicon contained 0.5ppm iron, leading to 3.2% first-year module degradation.
l Oxygen Content: For every 1 ppma increase in interstitial oxygen concentration, lattice defect density increases by 30%, causing a 0.5% rise in carrier recombination rate.
Crystal Structure:
Grain boundaries in polycrystalline silicon are natural enemies of efficiency.
l Grain Size: When grain size is >2mm, grain boundary density decreases by 40%, and efficiency increases by 1.2%. One manufacturer increased the average grain size from 0.5mm to 1.8mm through directional solidification technology, raising module efficiency from 18.2% to 19.1%.
l Dislocation Density: An increase of 1,000 dislocations per square millimeter reduces efficiency by 0.3%. XRD detection showed that rapid cooling processes reduced dislocation density from 5×10³/mm² to 1×10³/mm², increasing efficiency by 0.8%.
l Crystal Orientation Deviation: Deviation from the (100) plane by >5° reduces light absorption by 1.5%. By optimizing the cutting angle through EBSD (Electron Backscatter Diffraction) detection, the orientation deviation can be controlled within 2°, increasing efficiency by 0.5%.
Manufacturing Process
From wafer to module, process errors accumulate layer by layer.
Surface Treatment Technology
l Texturing Process: Increasing pyramid height from 2μm to 3μm reduces reflectance from 12% to 9%, increasing short-circuit current (Isc) by 2.3%. However, overly deep textures (>4μm) increase carrier recombination, causing efficiency to drop by 0.5%.
l Anti-Reflection Coating: Increasing silicon nitride film thickness from 75nm to 85nm reduces reflectance from 2.1% to 1.7%, but excessive thickness (>95nm) hinders carrier transport, reducing efficiency by 0.8%.
l Laser Grooving: With a groove depth of 5μm, the light-trapping effect increases Isc by 1.8%, but a depth error of ±0.2μm causes efficiency fluctuation of ±0.3%.
Electrode Design and Printing
l Gridline Width: Reducing the main grid from 50μm to 30μm reduces shading area by 15%, increasing efficiency by 0.6%, but increases series resistance, causing the fill factor (FF) to drop by 1.2%.
l Paste Composition: Increasing glass frit content in silver paste from 30% to 40% reduces contact resistance from 5mΩ·cm² to 3mΩ·cm², but excessive glass frit (>45%) corrodes the silicon wafer, reducing efficiency by 0.5%.
l Printing Accuracy: Screen printing misalignment of ±50μm causes gridline offset, leading to a 0.3% efficiency loss.
Diffusion and Doping
l Phosphorus Diffusion Concentration: Increasing surface concentration from 1×10²⁰/cm³ to 2×10²⁰/cm³ increases Jsc by 1.5%, but excessive junction depth (>0.5μm) reduces open-circuit voltage, resulting in a net efficiency gain of 0.7%.
l Boron Doping Uniformity: Increasing sheet resistance from 80Ω/□ to 100Ω/□ increases lateral resistance, causing FF to drop by 1.8%, but improved vertical conductivity increases Isc by 1.2%.
Environmental Variables
Temperature Effect
l Temperature Coefficient: Polycrystalline silicon efficiency decreases by 0.42% for every 1℃ rise (monocrystalline silicon: 0.38%). Field measurements at one power plant showed that in summer, module temperature reached 68℃ (43℃ higher than STC), causing efficiency to drop from 19.2% to 16.1%, resulting in a daily power generation loss of 14.3%.
l Heat Dissipation Design: Leaving a 5cm ventilation gap at the back of the module reduces temperature by 8℃, increasing annual power generation by 3.2%.
Light Intensity and Spectrum
l Irradiance Fluctuation: When irradiance drops from 1,000W/m² to 800W/m², efficiency remains unchanged but power generation decreases by 20%. The inverter's MPPT algorithm needs dynamic adjustment, otherwise an additional 3% loss occurs.
l Spectral Shift: When the UV band (300-400nm) proportion in the AM1.5G spectrum drops from 8% to 5%, Isc decreases by 1.2%, but UV-resistant module encapsulation can recover 0.8%.
Humidity and Contaminants
l PID Effect: Exposure to 85℃/85% humidity for 96 hours allows sodium ion penetration, reducing efficiency by 3.5%. Using anti-PID glass (e.g., Pyrex) can reduce sodium ion migration by 90%.
l Dust Shading: 1mm dust accumulation reduces irradiance transmittance from 92% to 78%, decreasing efficiency by 1.5%. An automatic cleaning system can reduce dust accumulation by 80%.
Long-Term Degradation:
Material Aging
l EVA Yellowing: After 5000 hours of UV exposure, EVA transmittance drops from 92% to 85%, reducing module efficiency by 1.2%. Adding anti-UV agents can reduce the yellowing rate by 60%.
l Silver Paste Oxidation: After 3 years of outdoor exposure, silver gridline thickness decreases from 15μm to 12μm, contact resistance increases by 20%, and FF drops by 1.5%.
Mechanical Stress
l Hot Spot Effect: Under local shading, the temperature can reach 90℃, the efficiency of the shaded cell drops by 30%, and overall module efficiency loss is 4.5%. Bypass diodes can reduce this loss by 80%.
l Frame Deformation: After 100 temperature cycles (-40℃~85℃), aluminum alloy frame deformation >0.5mm increases internal stress, raising the annual degradation rate by 0.1%.
Data Comparison: Efficiency Differences Under Different Processes
Process Parameter | Baseline Value | Optimized Value | Efficiency Gain |
Silicon Material Purity (N-type) | 6N | 7N | +0.8% |
Grain Size (mm) | 1.2 | 1.8 | +1.1% |
Gridline Width (μm) | 50 | 30 | +0.6% |
Surface Reflectance | 12% | 9% | +2.3% |
Temperature Coefficient (%/℃) | -0.42 | -0.35 | +1.7%* |
Practical Recommendations:
1. Material Selection: Prioritize purchasing N-type silicon material with boron content <0.1ppm and oxygen content <5 ppma.
2. Process: Use ALD to deposit an Al₂O₃ passivation layer, reducing surface recombination velocity from 10⁵ cm/s to 10³ cm/s.
3. Monitoring: Install an infrared thermal imager to detect module temperature in real-time; trigger an alarm and start ventilation when it exceeds 65℃.
4. Maintenance: Clean modules quarterly, using robotic dust removal systems to reduce manual error.
Efficiency Conversion
Theoretical Power Generation:
Theoretical power generation is the starting point for efficiency conversion. The formula is based on STC conditions (1,000W/m² irradiance, 25℃, AM1.5 spectrum):
Theoretical Daily Power Generation (kWh) = Module Efficiency (%) × Module Area (m²) × Irradiance (W/m²) × Sunshine Hours (h) ÷ 1000
Example: A 1.6m², 19% efficient polycrystalline silicon module in Arizona (1800 annual sunshine hours, average 4.93 hours daily) has a theoretical daily power generation = 19% × 1.6 × 1000 × 4.93 ÷ 1000 ≈ 1.5 kWh.
But this is just a number on paper; actual power generation is 80%-90% of this.
System Losses:
Current from the module to the grid goes through 5 stages of loss; total system efficiency is typically 85%-90% (IEC 62548 standard):
Loss Module | Typical Loss Proportion | Reasons and Data |
Module Mismatch Loss | 1%-3% | When efficiency difference between modules in the same string is >2%, weaker modules drag down the whole string's power (NREL test: 2.8% loss with 3% efficiency difference) |
Inverter Loss | 2%-5% | Conversion efficiency (DC to AC) 95%-98%, MPPT tracking error ±0.5% adds 0.3%-0.8% loss (SMA Sunny Boy rated 98.1% efficiency) |
Cable Loss | 1%-3% | DC cable loss (>10m length, 2.5mm² cable causes 1.2% loss), AC cable loss (<50m causes 0.5% loss) |
Transformer Loss | 1%-2% | Step-up transformer no-load loss 0.5%, load loss 1% (dry-type transformer 0.3% lower than oil-immersed) |
Soiling and Aging Loss | 1%-2% | Dust, EVA yellowing cause annual efficiency degradation of 0.5%-1% (PVEL test: 1.8% loss for modules not cleaned for 5 years) |
Case: 19% efficient module theoretical annual generation 2,730kWh (1.5kWh/day × 182 days), minus 10% system loss, actual annual generation 2,457kWh.
Temperature:
Polycrystalline silicon efficiency decreases linearly with rising temperature, temperature coefficient -0.42%/℃ (NREL 2023 average). Actual power generation must be corrected for module operating temperature:
Formula: Actual Efficiency = Nameplate Efficiency × [1 + Temperature Coefficient × (Operating Temperature - 25℃)]
Example: In Arizona summer, module surface temperature reaches 68℃ (43℃ higher than 25℃). Actual efficiency of 19% module = 19% × [1 - 0.42% × 43] = 19% × 0.8194 ≈ 15.57%, 18% lower than nameplate.
With 6 hours of daily average sunlight, daily power generation drops from 1.5kWh to 1.23kWh, 0.27kWh less per day.
Shading and Obstruction:
Shading puts modules into "hot spot mode." Bypass diodes can reduce loss, but efficiency still plummets:
l 10% area shading (e.g., tree shadow): Power generation loss 20%-30% (TÜV test: 10% shading on a single module caused 25% loss for a string of 12 modules);
l 50% area shading: Loss exceeds 60%; at this point, the bypass diode conducts, and the shaded part stops generating;
l Dynamic shading (moving clouds): Inverter MPPT frequently adjusts, causing an additional 3%-5% loss.
Dust and Dirt:
Dust accumulation reduces light transmittance, lowering efficiency:
Dust Accumulation Thickness (mm) | Transmittance (%) | Efficiency Loss (%) | Annual Generation Loss (kWh per module) |
0 (after cleaning) | 92 | 0 | 0 |
0.5 | 85 | 0.8 | 22 |
1.0 | 78 | 1.5 | 41 |
2.0 | 65 | 2.8 | 76 |
Inverter:
The inverter finds the module's optimal output point via MPPT (Maximum Power Point Tracking), but tracking accuracy affects conversion efficiency:
l Single MPPT Inverter (e.g., early models): When efficiency difference between multiple strings exceeds 10%, tracking fails, causing 3%-5% loss;
l Multi MPPT Inverter (e.g., Huawei SUN2000): Each track independently, tolerance for efficiency difference increases to 20%, loss 1%-2%;
l Tracking Error: Voltage error of ±0.5% causes 0.3% efficiency loss (Fraunhofer ISE test: SMA inverter tracking error 0.3%, loss 0.2%).
Conversion Differences in Various Scenarios:
The installation scenario changes how light is received, causing conversion efficiency differences of 5%-10%:
Scenario | Orientation | Tilt Angle (°) | Annual Conversion Efficiency (Relative Value) | Reason |
Residential Rooftop | True South | 30 | 100% | Optimal when unshaded |
Commercial & Industrial Rooftop | Southeast | 15 | 92% | Small tilt angle reduces winter light reception |
Ground-Mounted Power Plant | Tracking Mount | Tracks the sun | 110% | Facing the sun year-round, receives 10% more light |
High Latitude Region | True South | 45 | 95% | More reflection loss from low-angle winter sunlight |
Case: In Norway (60°N), a ground-mounted plant with tracking mounts has 12% higher annual conversion efficiency than fixed mounts, but costs 30% more.
Case: How much more money a 1% efficiency difference earns over 10 years
Comparing 18% and 19% efficient modules (same area 400W → 420W), Arizona (1800 sunshine hours, electricity price $0.12/kWh):
Item | 18% Efficient Module | 19% Efficient Module | Difference |
Annual Generation per Module (kWh) | 1140 | 1260 | +120 |
10-Year Total Generation (kWh) | 11400 | 12600 | +1200 |
10-Year Revenue (USD) | 1368 | 1512 | +144 |
Module Price Difference (USD) | 640 | 680 | +40 |
Conclusion: A 1% efficiency difference earns an extra 104 over 10 years (144-40), 360 extra over a 25-year cycle, resulting in a surplus after offsetting the price difference.
Size
Residential-grade typical 165×99×35cm (250-300W, 18-25kg), commercial 144-cell version 2256×1134mm (400W+, 28kg).
Size determined by cell (156/158.75mm), series-parallel arrangement (60/72/144 cells), aluminum frame (2-3cm).
NREL data: 72-cell version occupies 8-10㎡ roof per kW, requiring load-bearing capacity ≥25kg/㎡; modules over 2m face transport restrictions.
Technical Variables
Different cell sizes mean different module sizes
Currently, two main specifications abroad: 156mm×156mm (65% market share, IEA 2023 data) and 158.75mm×158.75mm (30% share).
The former has a single cell area of 243.36cm², the latter 251.64cm², 3.4% larger.
For example, using 60 156mm cells (6×10 arrangement), the total cell length is 1560mm (10 cells × 156mm), total width 936mm (6 cells × 156mm);
Switching to 158.75mm cells, total length becomes 1597.5mm (increased by 37.5mm), total width 952.5mm (increased by 16.5mm).
Adding the frame (47mm left/right, 38mm top/bottom), the module size changes from 1650×992mm (156mm cells) to 1690×1030mm (158.75mm cells).
There are also larger cells, like 166mm×166mm (commonly used for monocrystalline, less for polycrystalline), single cell area 275.56cm².
A 60-cell version total length 1660mm, module size would exceed 1700mm.
But polycrystalline's lower efficiency (15-18% vs monocrystalline 22%+) makes larger cells wasteful, so foreign manufacturers like Canadian Solar, Q Cells, for their polycrystalline modules, 90% still use 156/158.75mm cells.
Series-parallel arrangement determines length and width
The number of rows and columns (series-parallel arrangement) directly sets module length and width. Three common arrangements:
l 60 cells (6×10): 6 cells wide, 10 cells long. For 156mm cells, cell width 936mm (6×156), length 1560mm (10×156). With frame, module size 1650×992mm (residential model, e.g., Canadian Solar CS6K-265P), power 250-280W.
l 72 cells (6×12): 6 cells wide, 12 cells long. For 156mm cells, total length 1872mm (12×156), module size 1956×992mm (commercial model, e.g., JinkoSolar JKM390M-72HL), power 380-420W, length 306mm (nearly 1/3) more than 60-cell version.
l 144 cells (12×12): 12 cells wide, 12 cells long. For 158.75mm cells, total length 1905mm (12×158.75), module size 2256×1134mm (ground power plant model, e.g., Trina Solar TSM-DEG19C.20), power 470-510W, length and width 36%, 14% more than 60-cell version respectively.
Arrangement also affects voltage: 60 cells series voltage about 30V (suitable for residential inverters), 72 cells 36V (for flat roofs), 144 cells 72V (ground plant high-voltage systems).
A thicker aluminum frame changes size and wind resistance
The aluminum frame is not just for show; it supports module shape, resists wind and snow. Three thickness grades:
l Residential 2cm (e.g., Goal Zero Boulder 200): Uses aluminum alloy 6063-T5 (density 2.7g/cm³). For a 1.65m×0.99m module, aluminum frame weight about 4.5kg? Actually, the frame is hollow, wall thickness 1.5mm, so weight about 2.2kg. Wind pressure resistance 2400Pa (corresponding to 25m/s wind speed, force 10 wind), passes NREL wind tunnel tests.
l Commercial 3cm (e.g., JinkoSolar JKM390M-72HL): Wall thickness 2mm, same size module frame weight 3.3kg, wind pressure resistance 3200Pa (32m/s, force 12 wind), suitable for windy regions like Texas, Florida.
l Ground-mounted 3.5cm (e.g., Trina Solar 144-cell version): Wall thickness 2.5mm, weight 4.1kg, wind pressure resistance 3600Pa (35m/s, force 12+ wind), also adds reinforcement ribs (1 per meter, 3mm thick), passed wind tunnel tests in Minnesota (often has tornadoes).
For every 1cm increase in frame thickness, total module weight increases 2-3kg.
For example, 60-cell version: 2cm frame 19kg, 3cm frame 22kg, 3.5cm frame 24kg.
Weight affects roof load-bearing capacity – concrete roof requires ≥25kg/㎡.
A 20㎡ roof installing 10 3.5cm frame modules (24kg×10=240kg) averages 12kg/㎡, meets requirement;
Color steel tile roofs need added support beams (every 2m, load capacity +5kg/㎡).
Glass and backsheet, differences between thick and thin
The module front is low-iron tempered glass, the back is the backsheet. These also affect size and durability.
l Glass Thickness: Residential uses 3mm (transmittance 91.5%, impact resistance 5400Pa, UL 1703 certified), commercial/ground-mounted uses 4mm (transmittance 91%, impact resistance 6300Pa, can withstand 25mm hail). 4mm is 1.5kg/㎡ heavier than 3mm; a 1.65m×0.99m module gains 2.4kg.
l Backsheet Material: Residential uses PET (polyethylene terephthalate) 0.3mm thick (UV resistant 15 years, weight 0.6kg/㎡), commercial/ground-mounted uses PVF (polyvinyl fluoride) 0.5mm thick (resists 25 years, weight 1kg/㎡) or ETFE (ethylene tetrafluoroethylene copolymer) 0.4mm (flexible, crack-resistant, used for portable versions). PVF backsheet is 0.2mm thicker than PET, adding 0.3kg to a 1.65m×0.99m module, but lifespan 10 years longer – A California ground plant using PVF backsheet modules had only 8% power degradation after 25 years (NREL tracking data), while PET version degraded 12% after 15 years.
Installation Space
How to calculate space based on roof pitch
Using the common US 4:12 pitch (about 18.4°) as an example, a 10-meter long roof's actual coverage area = horizontal projection 10m × cos(18.4°) = 9.5m.
When installing 72-cell modules (1956×992mm), each occupies 1.956m×0.992m=1.94㎡, allowing 5 modules on a 10m roof (total length 9.78m), leaving 22cm gap.
For every 5° increase in pitch, effective length decreases about 3% (e.g., 25° pitch, 10m roof effective length 9.1m).
Data support: NREL research shows that on a 30° pitch roof, when module tilt matches the natural pitch, annual power generation is 18% higher than flat mounting. But pitch exceeding 35° requires additional reinforcement for mounting racks (cost +15%), and cleaning difficulty increases.
How to arrange flat roofs without wasting space
Example: A 10,000㎡ warehouse roof in Texas:
1. Array spacing: North-south spacing ≥5m (to prevent shadowing), east-west spacing 1m for maintenance access.
2. Mounting height: 0.5m (snow prevention) + 0.3m (ventilation) = 0.8m, actual installation height 1.3m.
3. Installation density: 10-12㎡ per kW (including spacing), 10,000㎡ roof can install 833kW (8330W/10㎡).
Optimization: Use adjustable tilt racks (0-30°adjustment), summer tilt 15° (reduce dust accumulation), winter tilt 30° (improve low-angle light capture). Field tests show adjustable racks yield 12% higher annual generation than fixed racks (Arizona data).
How to fit more modules in ground-mounted plants
Example: A 5MW project in California:
4. Row spacing design: North-south row spacing 6m (shadow length = module height × tan(solar altitude angle)), east-west column spacing 0.5m.
5. Land utilization: Effective installation area accounts for 72% (rest is roads, fences, drainage ditches).
6. Module arrangement: 144-cell version (2256×1134mm) arranged vertically, 12 modules per row, total length 27.07m, width 1.13m.
Data comparison: Compact layout (row spacing 4m) fits 33% more modules than standard layout (row spacing 6m), but requires increased rack strength (cost +20%) and irrigation systems (dust prevention).
How to overcome transport limitations
Oversized module transport requires special handling:
Length limits: US 40-foot container length limit 12.19m; modules over 2m need disassembly or horizontal placement.
l 2.25m modules in a single row occupy 11.25m, leaving 94cm gap (can fit 3 pieces of 0.3m wide accessories).
l Oversized transport fee: 0.8/foot per mile (standard modules 0.5/foot).
Height limits: Module + rack total height ≤4.3m (interstate highway limit), 144-cell version (1.95m high) needs speed limit 80km/h (prevent wind vibration).
Case: A German project transporting 144-cell modules (2.25m long) used low flatbed trucks + hydraulic lifters, single trip cost 1200 (standard modules 800).
How to verify structural safety
Roof load-bearing and wind resistance are prerequisites for installation:
Load-bearing calculation:
l Concrete roof: Total module weight = area × 25 kg/㎡ (typical).
l Example: 10㎡ installing 4 250W modules (total weight 100kg), requires roof load-bearing capacity ≥25kg/㎡ (meets).
l Color steel tile roof: Needs reinforced beams (spacing ≤1.5m), reinforcement cost $18 per ㎡.
Wind resistance test:
l Residential modules: Wind pressure resistance ≥2400Pa (force 10 wind), module edges need sealant (prevent uplift).
l Ground-mounted plants: Wind pressure resistance ≥3600Pa, rack base fixed with concrete blocks (depth 1.5m).
Failure case: A Florida plant, because the color steel tile roof wasn't reinforced, lost $250,000 in modules after a hurricane ripped off the roof.
How to adjust for climate differences
Different regions require targeted design:
l High-snow regions (e.g., Colorado):
Module tilt angle ≥35, leave 10cm snow slide gap.
Add heating cables to rack base (prevent freezing, consumption 0.5W per module per day).
l High-temperature regions (e.g., Texas):
Module backsheet ventilation gap ≥2cm, lower operating temperature (efficiency increases 0.4% per 1℃ drop).
Coat racks with reflective paint (surface temperature drops 8℃).
l Coastal regions (e.g., Florida):
Use 316L stainless steel for aluminum frame (salt spray corrosion resistance), cost +15%.
Spray anti-corrosion coating annually (cost $3/㎡).
Conversion
Conversion refers to the proportion of light energy converted to electrical energy by polycrystalline solar modules (photovoltaic conversion efficiency), typically 15%-19% under STC, compared to monocrystalline 18%-22%+.
PERC + black silicon technology enables some polycrystalline to reach 19.5%.
A 1% increase in efficiency reduces 300W module area by 6-7%, allowing 2-3 more modules on the same roof.
Impacts BOS cost (reduces 3-5%) and LCOE (reduces 2-3%).
Temperature increase of 1°C reduces efficiency 0.4%-0.5%, directly affecting 25-year power generation revenue.
Efficiency Status
How does wafer size affect efficiency?
Over the past decade, wafers have upgraded from 156mm (S1) to 182mm (S4). Every 5mm increase raises cell efficiency by 0.2%-0.3% on average. For example:
l S2 wafer (156.75mm): Mass production cell efficiency about 17.5%, module power 270W;
l S4 wafer (182mm): Mass production cell efficiency reaches 19.2%, module power 360W (33% power increase for same area).
Black Silicon Technology:
Black silicon reduces surface reflectance from 15% to as low as 5% through nanostructured texturing, improving light absorption. Experimental data:
l Reflectance comparison: Traditional acid-etched polycrystalline reflectance 12%, black silicon reduces to 4.5%;
l Efficiency gain: With black silicon, cell efficiency increases 0.3%-0.5%, module power increases 4-6Wp.
l But black silicon process adds cost (about $0.05 per wafer), currently only 15% of polycrystalline production capacity.
PERC Technology:
Passivated Emitter and Rear Cell (PERC) technology breathes new life into polycrystalline cells:
l Efficiency improvement: PERC polycrystalline cell efficiency is 0.5%-0.8% higher than traditional process, mass production efficiency reaches 19%-20%;
l Cost advantage: PERC upgrade cost about $0.1/W, but watt-hour generation increases 3%-5%, payback period shortens by 1.2 years.
Temperature Coefficient:
Module nameplate efficiency is based on 25°C test, but actual operation often exceeds 50°C. For a 19% efficient module:
l Temperature effect: For every 1°C rise, efficiency decreases 0.45%;
l Actual efficiency: At 50°C, efficiency drops to 17.3%, power generation decreases 9.2%.
Low-Light Response:
Polycrystalline module efficiency under low light (<200W/m²) is 1.5%-2% lower than monocrystalline. For example:
l Cloudy day generation: Monocrystalline generation 18% higher than polycrystalline;
l Early morning/evening: Polycrystalline generation decays 23%, monocrystalline only 15%.
l But polycrystalline modules are more stable under strong light; in high-temperature, high-irradiance regions (e.g., Middle East), polycrystalline system annual generation exceeds monocrystalline by 1.2%.
Technical Ceiling:
Current polycrystalline technology bottlenecks are clear:
1. Grain boundary defects: When polycrystalline wafer grain size <1mm, carrier recombination loss increases 0.8% per year;
2. Metallization loss: When gridline width >40μm, shading loss reaches 2.3%;
3. Material limitation: When polycrystalline silicon oxygen content >10 ppm, efficiency decreases 0.6%.
Market Status:
In 2025, the global PV module market, polycrystalline share dropped to 38%, but still has three main application scenarios:
4. Distributed rooftop: Low power (<3kW) systems prefer polycrystalline, as price is $0.05/W lower;
5. Desert power plants: In high-temperature environments, polycrystalline degrades slower, 10-year generation 2.1% higher than monocrystalline;
6. BIPV (Building Integrated Photovoltaics): Flexible polycrystalline module efficiency 14%-16%, cost 30% lower than crystalline silicon.
User Selection Advice:
l Limited budget: Choose 17%-18% efficient polycrystalline, cost per watt 0.25−0.30;
l Land constraints: Choose PERC polycrystalline (19%+), generation per square meter increases 19%;
l High-temperature regions: Prioritize modules with temperature coefficient <-0.4%/°C, avoid summer generation crash.
Reasons for Lower Efficiency
How do grain boundaries hinder performance?
Polycrystalline wafers consist of thousands of random grains; at grain boundaries, atomic arrangement is disordered, impeding electron flow.
l Data: Every 1% increase in grain boundary density raises carrier recombination rate by 0.8%. A polycrystalline wafer with 2mm grain size has a total grain boundary length of 1.2 meters per square centimeter, causing about 1.5% efficiency loss.
l Comparison: Monocrystalline wafer grain boundary density approaches zero, electron mobility 15% higher than polycrystalline.
Boron-Oxygen Complexes:
After boron doping in polycrystalline wafers, boron combines with oxygen under light to form recombination centers that directly trap carriers.
l Experiment: Un-pre-illuminated cell (containing boron-oxygen complex) initial efficiency drops 12%, stabilizes after pre-illumination.
l Cost: To eliminate boron-oxygen complexes, an additional annealing process costing $0.1/W is needed.
Encapsulant Material Aging:
EVA encapsulant and backsheet gradually yellow under UV exposure, reducing transmittance.
l Data: Ordinary EVA exposed for 10 years sees transmittance drop from 92% to 78%, module power loss 8%.
l Solution: Switch to anti-UV EVA (transmittance remains >90%), but cost increases $0.02/W.
Temperature:
Polycrystalline cell temperature coefficient (-0.45%/°C) is worse than monocrystalline (-0.4%/°C).
l Field measurement: When module temperature reaches 75°C at summer noon, polycrystalline efficiency 1.2% lower than monocrystalline.
l Annual impact: In regions with 40°C annual average temperature, polycrystalline annual generation 3.7% less than monocrystalline.
Metallization Loss:
Front-side electrode silver paste accounts for 40% of non-silicon cell cost, but overly wide gridlines block sunlight.
l Data: Reducing gridline width from 40μm to 30μm reduces shading loss from 2.1% to 1.4%, but silver consumption increases 15%.
l Balance point: PERC polycrystalline uses 35μm gridlines, silver paste cost $0.08/W, efficiency gain 0.3%.
Surface Reflection:
Polycrystalline wafer surface reflectance is as high as 24%, wasting 13% more light than monocrystalline (11%).
l Technology comparison: Black silicon technology reduces reflectance to 5%, but process cost increases $0.05/W.
l Actual effect: Every 1% reduction in reflectance gives 0.8% module power gain.
Dislocation Traps:
Polycrystalline silicon internal dislocation density up to 10^4 cm⁻², causing premature carrier recombination.
l Microscopy observation: 500-1000 dislocation clusters per square millimeter wafer, each cluster affects a 3μm radius.
l Efficiency loss: Every increase of 10^3 cm⁻² in dislocation density shortens minority carrier lifetime by 10%.
Low-Light Response:
Polycrystalline efficiency under low light (<200W/m²) is 1.8% lower than monocrystalline.
l Data: On cloudy days, polycrystalline generation 15% less than monocrystalline, annual cumulative difference up to 120kWh/kWp.
l Reason: Polycrystalline recombination centers are more active under low light intensity.
Impact on Users
Initial Investment
Polycrystalline module initial cost is 10%-20% lower than monocrystalline, but per-watt price breakdown:
l Module cost: Polycrystalline 0.25−0.30 per watt, monocrystalline 0.35−0.40 (2025 data);
l Installation cost: Polycrystalline slightly heavier (25kg/kW vs 23kg/kW), labor cost $0.02/W more;
l Land cost: Polycrystalline requires 15%-20% more area, land rental cost increases $0.01/W.
l Case: 10kW system, polycrystalline total cost 28,000 (modules 7,500 + installation 2,500 + land 1,000), monocrystalline total cost 33,000.
Power Generation
Polycrystalline module efficiency is 1.5% lower than monocrystalline under strong direct light, but the gap widens under cloudy weather:
l Summer sunny day: Monocrystalline generation 8% more than polycrystalline (e.g., Dallas, Texas, annual difference 1,200kWh);
l Winter cloudy day: Polycrystalline generation 12% less than monocrystalline (e.g., Berlin, annual difference 900kWh).
l User benefit: In a region with 2,000 annual sunshine hours, polycrystalline system annual generation 5%-8% less than monocrystalline, directly impacting electricity bill savings.
Maintenance Cost
Polycrystalline modules have higher hot spot risk, increasing maintenance cost:
l Hot spot detection: Annual infrared scanning needed 200−300, monocrystalline system only $100;
l Replacement frequency: Polycrystalline modules degrade faster (first year 2% vs monocrystalline 1.5%), 30% higher replacement probability within 10 years, additional cost $1,500/kW.
l Case: Over a 25-year cycle, polycrystalline total maintenance cost 4,000−6,000 more than monocrystalline.
Space Utilization
Polycrystalline modules generate 20% less per square meter than monocrystalline, significantly impacting users with small roofs:
l 3kW system: Monocrystalline requires 17㎡, polycrystalline 21㎡ (difference 4㎡);
l Roof value: If roof annual rent 50/㎡, the extra area for polycrystalline costs an extra 200 annually.
l Solution: Choose PERC polycrystalline (efficiency increase 1.5%), can reduce area requirement by 10%.
Temperature Damage
Polycrystalline modules lose more efficiency at high temperatures, directly affecting revenue:
l Temperature coefficient: Polycrystalline decreases 0.45% per ℃, monocrystalline 0.4% (example at 40℃ ambient);
l Actual generation: On hot summer days, polycrystalline generation 12%-15% less than monocrystalline;
l Lifespan impact: In high-temperature regions, polycrystalline module 25-year cumulative degradation 3%-5% more than monocrystalline.
l Data: A 50MW plant in Arizona, polycrystalline system annual generation 1.8% less than monocrystalline.
Low-Light Performance
Polycrystalline efficiency under low light (<200W/m²) is 2% lower than monocrystalline, affecting all-day generation:
l Early morning/evening: Polycrystalline generation 18% less than monocrystalline;
l Annual cumulative difference: In regions with >100 rainy/cloudy days per year (e.g., Seattle), polycrystalline system annual generation 1,500kWh less;
l Economic impact: At 0.15/kWh electricity price, user annual loss 225.