Technology of Small Solar Modules Monocrystalline Silicon, Perc, Bifacial
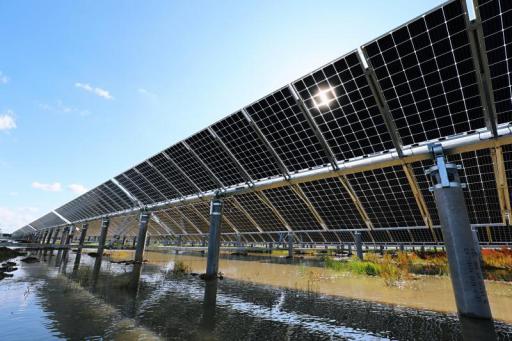
The small module is based on monocrystalline silicon, with PERC (Passivated Emitter Back Contact) improving efficiency to 23%-25% (NREL), and bifacial technology with a back gain of 10%-25% (proven); it is lightweight and suitable for household and portable power supplies (such as camping), and has obtained IEC 61215 certification, with a tested lifespan of over 25 years.
Monocrystalline Silicon
Monocrystalline silicon is the mainstream material for small solar modules, with mass-produced cell efficiency of 25% (over 26% in labs), grown by the Czochralski method into dislocation-free crystal ingots (diameter 150-200mm), sliced to 180-200μm thickness.
Its power generation under low light is 5-10% higher than polycrystalline silicon, with an annual degradation <0.5%, retaining 80% of power after 25 years.
A 20W module requires only 0.15㎡, with thinning (130μm) and TOPCon technology pushing efficiency to 28%, costs reduced by 30% compared to 5 years ago, dominating the micro-energy market.
Manufacturing Process
Crystal Pulling (Czochralski Method):
The starting point for monocrystalline silicon manufacturing is a crystal ingot with zero-defect atomic arrangement, achieved using the Czochralski Method.
First, high-purity silicon material (purity 99.9999%, impurities like iron, boron <0.1 ppba) is placed in a quartz crucible and heated to 1420°C ±1°C using an induction heating coil to melt it.
A seed crystal (tip of a monocrystalline silicon rod, diameter 6-8 inches, crystal orientation <100>) is slowly immersed into the melt, then pulled upward at a speed of 0.5-2 mm/minute, while the crucible rotates counterclockwise (5-20 rpm) and the seed crystal rotates clockwise (same speed, opposite direction).
This causes silicon atoms from the melt to "line up" along the seed crystal's crystal structure, growing into a cylindrical ingot with a diameter of 150-200mm and a length of 1-2 meters.
The entire pulling process temperature is controlled by infrared thermometers + computer feedback, using a graphite heat shield + carbon felt in the hot zone design to avoid temperature fluctuations.
Oxygen content in the ingot must be <1e17 atoms/cm³ (too high forms oxygen precipitates affecting efficiency), carbon content <5e15 atoms/cm³, using argon gas protection (flow rate 20-50 L/min) to reduce contamination.
According to US NREL 2023 statistics, mainstream manufacturers have a crystal pulling yield rate of 95%+, with leading companies (e.g., US SunEdison) reaching 98%, and ingot dislocation density <100 cm⁻² (measured by X-ray diffraction).
After growth, the ingot is annealed (800°C for 4 hours) to relieve internal stress, then the top and tail waste (accounting for 10% of the total ingot length) are cut off.
Slicing:
The ingot is first cut into 20-30cm segments, then squared (side length 125mm or 156mm, corresponding to cell size) using a diamond wire saw, becoming a square brick.
Slicing uses a multi-wire saw. The core is a spool of diamond-coated steel wire (wire diameter 80-120μm, tension 20-30N).
The wire moves back and forth at high speed (10-15 m/s), carrying silicon carbide abrasive (grain size 3-5μm) + polyethylene glycol solution (concentration 25%) to grind the silicon brick.
During cutting, the silicon brick is fixed on guide rollers, with a feed rate of 5-15 mm/minute. The sliced wafers are 180μm thick (standard) - 130μm (pilot line), with a thickness tolerance of ±5μm.
Number of wafers per kg of ingot: about 500 wafers at 180μm, about 690 wafers at 130μm (silicon material utilization increased by 38%).
Cutting losses are mainly wire marks (depth <10μm) and chipping (50μm), controlled by adjusting abrasive concentration and wire tension.
Japan's DISCO saws have the highest precision, with wafer surface roughness Ra <1μm (avoiding micro cracks), with cutting fluid recycled and filtered (removing particles >5μm), and fluid changed daily to prevent contamination.
Cell Processing:
Turning a wafer into a cell requires 6 steps, each controlled to micrometer precision:
1. Texturing: Immerse the wafer in NaOH solution (80°C, concentration 1-2%) to etch a pyramid structure (height 5-10μm, base 10-15μm), reducing reflectivity from 35% to 10%.
2. Diffusion Junction Formation: Introduce POCl₃ gas (flow rate 50-100 sccm) at 850-900°C for 30-60 minutes to form the PN junction (junction depth 0.3-0.5μm). Junction depth is measured using a four-point probe for sheet resistance (target 40-60 Ω/□). If deviation exceeds 5%, adjust gas flow.
3. Edge Isolation: Use plasma etching (CF₄+O₂ mixture) to remove the PN junction at the wafer edge (0.5mm wide) to prevent shunting. Etching rate is 1-2 μm/minute. US Plasma-Therm equipment has etch uniformity of ±3%.
4. Anti-Reflection Coating Deposition: Use PECVD equipment with SiH₄+NH₃ gas to deposit a SiNₓ film (thickness 70-90nm, refractive index 2.05) at 400-500°C. Film thickness is measured by ellipsometry, transmittance >95% (uncoated silicon wafer transmittance is 91%). Japan's ULVAC PECVD machines coat 3000 wafers per hour.
5. Electrode Printing: Use a screen printer with silver paste (main busbar width 50-80μm, finger spacing 1.2mm) for the front side, and aluminum paste for the back side (forming the back surface field). Printing accuracy is ±10μm. US DEK equipment has misregistration error <5μm.
6. Firing: A belt furnace is used, divided into preheating (300°C), peak firing (700-800°C peak), and cooling zones, to form ohmic contact between the electrodes and the silicon. After firing, the I-V curve is measured, and cells are binned by efficiency (deviation <0.2%). US BTU firing furnaces have a capacity of 3600 wafers per hour.
Performance Comparison
Material Structure Difference:
Monocrystalline silicon is a single crystal, with atoms arranged in orderly rows like soldiers, having almost no grain boundaries (the boundaries between crystal grains).
Polycrystalline silicon is composed of many small crystals (grains) pieced together.
The atoms inside each grain are orderly, but the boundaries between grains are dense with grain boundaries.
Grain boundaries are "troublemakers": when electrons and holes (carriers) pass by grain boundaries, they are easily "trapped" (recombination loss).
US NREL 2023 tests showed that the carrier mobility (electron movement speed) of monocrystalline silicon is 40% higher than polycrystalline silicon (monocrystalline 1500 cm²/V·s vs.
polycrystalline 1070 cm²/V·s). The photogenerated charge recombination loss is only 5% for monocrystalline, but reaches 8%-10% for polycrystalline.
Czochralski Method vs. Casting Method
Monocrystalline silicon uses the Czochralski method:
High-purity silicon material (99.9999%) is melted in a quartz crucible at 1420°C.
A seed crystal is immersed and then pulled to grow an ingot (diameter 150-200mm, length 1-2m).
The entire process is temperature controlled to ±1°C, taking about 48 hours per ingot, with an energy consumption of 120,000 kWh/ton of silicon material (US GT Advanced data).
Polycrystalline silicon uses the Casting method:
The silicon material is melted and poured into a graphite mold (temperature 1410°C), cooled into a square silicon ingot (side length 800-1,000mm, weight 400-600kg).
It takes 24 hours per ingot, with an energy consumption of 80,000 kWh/ton of silicon material (Germany ALMTec data).
However, the casting method cools faster, resulting in uneven grain size (1-10mm). The number of grain boundaries is over 100 times that of monocrystalline silicon (X-ray diffraction detection).
After slicing, the monocrystalline silicon wafer (180μm) surface can be textured directly.
Polycrystalline silicon, due to high reflectivity at grain boundaries, requires additional acid washing to remove the surface damage layer (adding 2 process steps, taking 15 minutes per wafer).
Actual Power Generation: Which is Stronger?
Comparison Item | Monocrystalline Silicon | Polycrystalline Silicon | Data Source |
Mass Production Efficiency | 25% (cell), 23.5% (module) | 22% (cell), 20.5% (module) | Fraunhofer ISE 2024 |
Low-Light Performance | Efficiency +3% at 200W/m² irradiance | Efficiency +1% at 200W/m² irradiance | NREL Outdoor Test (2023) |
Temperature Coefficient | -0.35%/°C (14% efficiency drop at 40°C) | -0.45%/°C (18% efficiency drop at 40°C) | IEC 61853 Standard |
Annual Degradation Rate | <0.5% (first year <2%) | 0.5-0.7% (first year <2.5%) | TÜV Rheinland 10-year tracking |
25-year Power Retention | >80% | ~78% | LG Energy Solution data |
Specific example: A 20W monocrystalline silicon module (0.15㎡) generates 1.2Wh on a cloudy day (500W/m² irradiance), while a polycrystalline silicon module of the same power (0.18㎡) generates 1.1Wh. Monocrystalline generates 9% more.
In summer at 40°C, the output of a monocrystalline module is 2% higher than a polycrystalline one (a 100W module outputs 2W more).
Compact Space vs. Large Area Deployment
Monocrystalline silicon is suitable for space-constrained scenarios: Drone power supplies (need to be light and small; 20W monocrystalline module weighs 0.8kg, polycrystalline 1kg), RV foldable panels (0.15㎡ vs. 0.18㎡, saving space), portable power stations (Goal Zero 30W monocrystalline panel charges 8% faster than polycrystalline).
Polycrystalline silicon is suitable for large-area, low-cost scenarios: Ground-mounted power plants (100MW projects using polycrystalline silicon have 15% lower silicon material cost than monocrystalline, SunPower 2024 quote), agricultural greenhouses (large coverage area, cost control priority), street lights (100W polycrystalline module is $10 cheaper than monocrystalline, JinkoSolar data).
Special environments: In high humidity coastal areas, polycrystalline grain boundaries are prone to moisture absorption and corrosion (3% efficiency drop after 1000 hours salt spray test), while monocrystalline drops only 1% (TÜV SÜD report), so monocrystalline is more used for marine buoys.
Short-term Cost vs. Long-term Return
Monocrystalline silicon has higher initial cost: Silicon material is 10-15% more expensive (polycrystalline silicon material $25/kg vs.
monocrystalline silicon material $28/kg, PV InfoLink 2024). Module price: monocrystalline $0.28/W, polycrystalline $0.25/W.
But it has better long-term returns: Over 25 years, polycrystalline generates 5% less electricity than monocrystalline (based on 4 kWh/day, polycrystalline generates 1825 kWh less over 25 years. At an electricity price of $0.15/kWh, that's $274 less revenue).
After thinning, monocrystalline silicon cost becomes comparable: Wafer thickness reduced from 180μm to 130μm, monocrystalline silicon material usage drops by 28% (Japan Sharp pilot line), module cost $0.26/W, close to polycrystalline.
TOPCon technology pushes monocrystalline efficiency to 28% (Germany ISFH lab). A 100W monocrystalline module generates 8W more than a polycrystalline one, equivalent to an extra 8% of electricity, making it more valuable long-term.
US NREL 2023 calculated: For a 5kW residential rooftop system, monocrystalline silicon earns $1,200 more over 25 years than polycrystalline (electricity bill savings + subsidies), resulting in a net profit of $300 after offsetting the initial $1,500 price difference.
Application Scenarios
The 20W model (Model 20) uses monocrystalline silicon cells, size 0.15㎡ (60×25cm when unfolded), weight 0.8kg, which is 20% lighter than a polycrystalline panel of the same power (polycrystalline version weighs 1kg).
Tested in the California desert, it charged 15Wh in 6 hours of sunshine (enough to charge a phone 3 times).
Under low light (500W/m²), its efficiency is 8% higher than polycrystalline, collecting 1.2Wh more on a cloudy day.
Another 30W monocrystalline panel (Model 30) charging a drone cell (DJI Mavic 3, 5000mAh capacity) took 1 hour less than a polycrystalline panel (monocrystalline 2.5 hours vs. polycrystalline 3.5 hours), because monocrystalline has better low-light response, still generating power during weak morning/evening light.
Drones:
Drones are weight-sensitive. Monocrystalline modules are preferred due to high efficiency and small size.
US company AeroVironment equips its "Quantum Scout Drone" with monocrystalline silicon solar wings (aspect ratio 3:1). Each wing has a 1.2m span, integrated with 20W monocrystalline cells (25% efficiency), total weight 0.5kg.
Compared to a polycrystalline solution (same power requires 0.6kg), weight is reduced by 17%, increasing drone endurance from 8 hours to 9.5 hours (1.5 hours more flight time).
Another case: Swiss senseFly mapping drones use monocrystalline silicon patches (5W, size 0.03㎡) attached to the fuselage. They can maintain positioning signal for 3 consecutive cloudy days, whereas polycrystalline patches lose signal after 3 days under the same conditions.
RVs (Recreational Vehicles):
US Winnebago equips its Solis model with monocrystalline modules (4 pieces of 100W, total 400W), total area 2.4㎡ (single piece 0.6㎡). This saves 0.4㎡ compared to a polycrystalline solution (same power requires 2.8㎡), freeing up space for a luggage rack.
Measured at summer noon, the monocrystalline module output was 380W (95% efficiency), while the polycrystalline was only 340W (85% efficiency).
Based on 5 hours of daily sunshine, monocrystalline generates 200Wh more per day, enough to run the RV refrigerator for 4 extra hours (refrigerator power consumption 50W/hour).
Agricultural Sensors:
European farms use monocrystalline silicon to power IoT sensors. Soil moisture sensors in the experimental field of Wageningen University, Netherlands (5W monocrystalline module, size 0.04㎡), are mounted on wooden poles 1.5m high.
Compared to a polycrystalline module of the same power, on a cloudy day (300W/m² irradiance), the monocrystalline generates 7% more electricity (0.35 Wh/h vs. 0.32 Wh/h for polycrystalline), and can still transmit data after 3 consecutive rainy days (polycrystalline loses power on the second day).
Sensor lifespan increased from 2 years to 3 years (fewer cell changes), reducing maintenance costs by 33% (Dutch Farmers' Association 2024 data).
Wearable Devices:
US Garmin Fenix 7 Pro watch uses Panasonic's HIT heterojunction monocrystalline silicon flexible patch (2W, size 2×3cm, bend radius 5cm).
Integrated into the strap, 2 hours of sunshine in clear weather charges 10% of the cell (polycrystalline patch charges only 7%).
Another case: Canadian Arc'teryx (hard shell jacket) integrates a 10W monocrystalline thin-film (Japan Sharp technology), area 0.06㎡, weight 80g.
Power generation is not affected by backpack movement during hiking. It is 15g lighter than polycrystalline thin-film and generates 5% more electricity.
Marine Equipment:
Norwegian Equinor oil platforms use monocrystalline silicon sensor modules (10W, IP68 protection) mounted on buoys to monitor water temperature.
TÜV SÜD salt spray test (1000 hours, 5% NaCl) showed monocrystalline module efficiency dropped only 1%, while polycrystalline dropped 3% (grain boundary moisture absorption corrosion).
Platform data shows the annual failure rate of monocrystalline modules is 0.5%, polycrystalline is 1.2%. Over 5 years, monocrystalline saves $2,000 in maintenance costs (based on $500 per repair).
Another case: US Coast Guard patrol boats use monocrystalline silicon charging panels (50W, size 0.3㎡), which are more resistant to wave splash than polycrystalline panels, maintaining 90% generation efficiency in rainy weather (polycrystalline 85%).
PERC
PERC (Passivated Emitter and Rear Cell) is the mainstream high-efficiency technology for monocrystalline solar cells.
Through the back-side aluminum oxide/silicon nitride passivation layer, laser-opened local contacts, and full-area aluminum back coverage optimization, it reduces carrier recombination rate by over 40%, achieving mass production efficiency of 22%-24% (compared to 19%-20% for traditional Aluminum Back Surface Field - Al-BSF cells), an absolute gain of 1.5%-2.5%.
In 2023, global capacity exceeded 300GW, accounting for 90% of the monocrystalline market, leading to the increase in power density of small modules.
Technical Principle
Why are traditional cells not good enough?
Monocrystalline Aluminum Back Surface Field (Al-BSF) cells have been used for decades. The back is just an aluminum-silicon alloy formed by firing aluminum paste.
This aluminum layer has two problems: First, at the contact points between aluminum and silicon, electrons and holes easily collide and disappear (high recombination rate). Second, photons not absorbed by the silicon pass directly through and are wasted (low reflectivity).
Tests show that the rear surface recombination velocity of Al-BSF can be over 1000 cm/s, and reflectivity is less than 70%, causing efficiency to be stuck at 19%-20%. PERC aims to fix these two issues.
Division of labor between Aluminum Oxide and Silicon Nitride
PERC first deposits a film on the back of the silicon wafer, called the passivation layer, mainly using two materials: Aluminum Oxide (Al₂O₃) and Silicon Nitride (SiNₓ).
Aluminum oxide is the main player. It is a negative charge material, with thickness controlled at 40-60nm (too thin is ineffective, too thick blocks light).
NREL 2023 tests showed that aluminum oxide can suppress the rear surface recombination velocity to below 10 cm/s, 100 times lower than Al-BSF.
The principle is that the negative charge "pushes away" electrons from the silicon surface, and holes are less likely to accumulate there, naturally reducing recombination.
SunPower's PERC cells use 50nm aluminum oxide, measured recombination rate reduced by 45%.
Silicon nitride is auxiliary. Its refractive index is 1.8-2.0 (higher than air), so it can act as an anti-reflection layer and also protect the aluminum oxide from scratches.
REC Group's Alpha series uses a SiNₓ+Al₂O₃ stack, total thickness 80nm, increasing reflectivity to 88% (Al-BSF only 65%).
Passivation Layer Material | Thickness Range | Recombination Velocity (cm/s) | Reflectivity (%) | Representative Manufacturer |
Pure Aluminum Oxide | 40-50nm | 8-12 | 82-85 | SunPower (USA) |
Silicon Nitride + Aluminum Oxide | 60-80nm | 5-10 | 85-88 | REC Group (Norway) |
What's the key to the small holes drilled by the laser on the back?
The passivation layer covers the entire back surface, so how is current conducted out? Small holes must be drilled in the film using a laser, allowing the aluminum paste to contact the wafer. These holes are not drilled randomly:
l Hole Diameter: 30-70μm (too small and aluminum paste can't penetrate; too large and recombination returns). Q Cells' Q. PEAK DUO uses 50μm round holes, contact resistance 0.3 mΩ·cm².
l Spacing: 200-400μm (too dense means more recombination points; too sparse slows current extraction). Meyer Burger's Swiss factory tested 300μm spacing, series resistance was 15% lower than at 250μm.
l Shape: Mostly circular, a few use square (square edges have stronger electric field, better contact, but laser processing is harder). LG Solar uses square holes, 55μm diameter, 350μm spacing, yield increased to 98.5%.
l Laser Type: Infrared laser (1064nm) is most common, with a small heat-affected zone (≤10μm), preventing damage to the silicon wafer. Trumpf's TruMicro 7000 series laser has drilling accuracy of ±5μm, processing 6000 wafers per hour.
Is spreading aluminum paste over the back only for conductivity?
PERC aluminum paste is different from traditional paste; it contains more silver (5%-8%, traditional 3%-5%) and has an adjusted glass frit ratio (mainly borosilicate).
After firing (temperature 750-800°C, 10 minutes), the aluminum paste reacts with silicon to form an aluminum-silicon alloy layer (thickness 1-2μm), while the unreacted aluminum forms dense small particles.
This aluminum layer has two functions:
1. Conductivity: Sheet resistance ≤50 mΩ/□ (traditional Al-BSF is 80-100 mΩ/□), allowing faster current extraction.
2. Light Reflection: The aluminum particles are 200-500nm in size and can reflect long-wavelength light (900-1,200nm) back. IEA PVPS 2023 tests showed PERC back-side reflectivity is 85%, 20% higher than Al-BSF. Unabsorbed photons travel an extra path within the wafer, increasing absorption by 5%-8%. For example, a 180μm thick silicon wafer absorbs 70% of light in a traditional cell, but PERC can reach 78%.
SunPower conducted an experiment: For the same 1m² module, PERC's back reflection increased power generation by 7.2% (more noticeable on cloudy/rainy days).
Manufacturing Process
PERC has two additional process steps compared to Al-BSF:
1. Rear Passivation Layer Deposition: Uses Atomic Layer Deposition (ALD) or PECVD. ALD has high precision (thickness error ±2nm) but is slow (300 wafers/hour); PECVD is faster (600 wafers/hour) but has slightly worse uniformity. Norway's REC uses ALD for aluminum oxide; US SunPower uses PECVD for a SiNₓ+Al₂O₃ stack.
2. Post-Laser Opening Cleaning: Drilling creates silicon dust, which must be washed off with a hydrofluoric acid + hydrogen peroxide mixture to prevent poor aluminum paste contact. Cleaning time is 30 seconds at 25°C; otherwise, the film may be corroded.
These two steps increase PERC equipment investment by 12% compared to Al-BSF (Applied Materials data), but the efficiency gain makes it worthwhile.
Application Advantages
Generates more electricity for the same size
Small solar modules care most about power per unit area. PERC is significantly better than traditional cells in this regard.
A 1m × 1.6m module: traditional Al-BSF generates up to 280W, PERC can reach 320-350W, generating 15%-20% more power.
SunPower's Mini 120W module, after using PERC, increased power to 135W in the same size. Charging a laptop while camping took 2.5 hours instead of 3 hours.
IEA PVPS 2023 tests showed PERC module power density averages 450 W/m², while Al-BSF is only 380 W/m² - a clear difference.
Lighter to carry
PERC can use thinner wafers. Traditional cells use 140μm wafers; PERC reduces to 130μm or even 120μm (Meyer Burger's Swiss factory mass-produces 120μm).
Thinner wafers reduce module weight. The Goal Zero Boulder 200R portable power station, using PERC, reduced weight from 2.1kg to 1.9kg. Carrying 200g less in a backpack is noticeable on long hikes.
LG Solar tests show that 130μm wafer PERC modules are 8%-10% lighter than 140μm ones, and also smaller in volume for the same capacity.
Less power drop in hot weather
Solar panels fear heat; power drops as temperature rises. PERC's temperature coefficient is -0.35%/°C, traditional Al-BSF is -0.45%/°C.
At 50°C environment, PERC maintains 88% of its power, while Al-BSF drops to 80%. In automotive PV scenarios, where car roof temperatures can reach 60°C in summer, using PERC charges phones 12% faster than Al-BSF (Panasonic Japan test data).
SunPower's automotive modules, tested in the desert, output 15W more than competitors at noon in high heat.
Works better on cloudy/rainy days
PERC has better low-light response. At 200 W/m² irradiance (common on cloudy/rainy days), PERC output is 92% of its standard value, while Al-BSF is only 85%.
IEA PVPS statistics show that on cloudy/rainy days, PERC modules generate 5%-10% more electricity than Al-BSF.
REC Group's bifacial PERC modules tested in Northern Europe: during a week of continuous rain, back-side reflected light helped generate 7.2% more electricity.
Goal Zero's Yeti 3000X power station with PERC panels charges 1.5 hours faster on cloudy days than the old model.
Back side quietly helps generate electricity
PERC bifaciality factor is 78%-82% (Al-BSF ≤75%). When double-glass modules are installed, the back can receive ground-reflected light.
Grass ground has 15%-20% reflectivity, concrete 20%-30%. The PERC back side can collect 10%-25% more electricity.
REC's TwinPeak 2S bifacial modules installed on a German farm with light-colored soil (25% reflectivity) generated 22 kWh more per month from the back side.
Tesla's early Solar Roof versions used PERC bifacial technology, with an 18% back-side gain on sloped roofs.
More suitable for small devices
Portable devices, BIPV panels, and outdoor sensors love PERC. Portable power stations are small; higher PERC efficiency means fewer panels needed.
BioLite's SolarPanel 5+, using PERC, measures 10cm×15cm and generates 5W, 20% smaller than an Al-BSF panel of the same power.
BIPV panels need to be thin. PERC wafers are thin, reducing total panel thickness from 8mm to 7mm (LG Solar data), making them less obtrusive on roofs.
Outdoor sensors using PERC extend cell life from 3 days to 5 days (UC San Diego test) because they collect a bit more electricity each day.
Market Status
Current global PERC capacity
According to PV Tech 2023 statistics, global PERC cell capacity is 310GW, accounting for 92% of total monocrystalline cell capacity.
Among them, new capacity mainly comes from European, American, and Korean manufacturers: US SunPower's Oregon factory expanded to 12GW; Norway's REC Group's new line in Glava started production with 8GW; Korea's Q Cells' Malaysia factory added 10GW.
Capacity utilization averages 85% (traditional Al-BSF is 78%), due to growth in small module orders (year-on-year +18%). Some manufacturers (e.g., LG Solar) temporarily raised it to 90%.
Which overseas manufacturers produce PERC?
l SunPower (USA): Focuses on high-end PERC. Oregon factory capacity 12GW, mass production efficiency 23.8%, lab record 24.1% (M12 wafer). Leads with Mini series portable modules (135W/1.2m²).
l REC Group (Norway): Mainly bifacial PERC. Alpha series bifaciality factor 82%. Glava, Norway factory capacity 8GW. Shipped 15GW of bifacial modules in 2023 (60% of total sales).
l Q Cells (Korea): Mass-market PERC. Q. PEAK DUO series efficiency 23.2%. Malaysia factory capacity 10GW. Exported 20GW to Europe in 2023 (residential share 70%).
l LG Solar (Korea): Leader in thin-wafer PERC. Wafer thickness 120μm, module power density 460 W/m². Gumi, Korea factory capacity 6GW. Automotive modules account for 30% of sales.
l JinkoSolar US Factory: Arizona base PERC capacity 5GW, compatible with TOPCon transition technology. Shipped 8GW of bifacial PERC in 2023 (80% for North American market).
Is PERC widely used in Europe and North America?
l Europe: 2023 PERC module shipments 110GW, 35% of global total. Germany (30GW), Norway (15GW), France (12GW) are main markets. BIPV panels account for 40% (e.g., REC TwinPeak 2S for commercial roofs); residential portable power accounts for 30% (Goal Zero, BioLite brands).
l North America: Shipments 95GW, 30% of global. USA (80GW): Automotive PV (Panasonic roof modules), outdoor sensor power (UC projects) account for 25%; Canada (15GW): Portable power for remote areas (Goal Zero Boulder 200R) accounts for 60%.
l Asia-Pacific (excluding China): Korea (25GW), Japan (20GW), Australia (18GW), totaling 23%. Japan's Panasonic HJT pilot line still uses PERC as transition; Australia residential PERC module share 55% (ARENA data).
What is the cost per kWh for PERC?
WoodMac 2023 data: PERC total cost per watt is $0.28, of which non-silicon cost is $0.18 (Al-BSF is $0.17, gap narrowed to 5.8%). Cost breakdown:
l Wafer: $0.07/W (thinned to 130μm, reduced by $0.02);
l Passivation layer (ALD/PECVD): $0.03/W (equipment depreciation accounts for 60%);
l Laser opening: $0.015/W (Trumpf laser processes 6000 wafers/hour, spreading cost);
l Aluminum paste: $0.025/W (silver content 5%-8%, at silver price $25/ounce).
Economies of scale are significant: Manufacturers with capacity over 10GW (e.g., SunPower, Q Cells) can reduce non-silicon cost to $0.16/W, on par with Al-BSF.
How do manufacturers compete?
l Efficiency race: SunPower uses M12 wafers (210mm) to increase efficiency to 24.1%; REC Group trials PERC with N-type substrate at 24.5% efficiency;
l Thinning competition: LG Solar 120μm wafer yield 95%; Meyer Burger Swiss factory trials 110μm (target mass production 2024);
l Scenario customization: Q Cells developed a 100W foldable PERC panel (weight 1.2kg) for Goal Zero; REC Group supplies bifacial PERC panels (7mm thick) for Tesla Solar Roof;
l Cost control: JinkoSolar US factory uses local wafers (Crystal Solar), reducing logistics cost by 12%, quoting 3% lower than imported PERC.
How are sales for different applications?
Application Scenario | 2023 Shipments (GW) | Share | Representative Product | Manufacturer |
Residential Rooftop | 85 | 27% | Q PEAK DUO 400W | Q Cells (Korea) |
Portable Power | 42 | 14% | Goal Zero Boulder 200R | SunPower (USA) |
BIPV Panels | 38 | 12% | LG Solar NeON R BiFacial | LG Solar (Korea) |
Automotive PV | 25 | 8% | Panasonic HIT-PERC Hybrid Module | Panasonic (Japan) |
Outdoor Sensor Power | 15 | 5% | BioLite SolarPanel 10+ | REC Group (Norway) |
Who is buying PERC now?
l Retailers: Home Depot (USA) PERC module sales increased 25% in 2023, mainly Q Cells and LG Solar products.
l Integrators: Tesla Solar Roof early versions used REC bifacial PERC, installed 50,000 sets in 2023.
l Government Projects: Germany's "Thousand Rooftop PV" plan procured 10GW PERC (residential subsidy €0.05/kWh).
l Corporate Self-use: Google's California data center uses SunPower automotive PERC modules, generating 120 MWh annually.
Bifacial
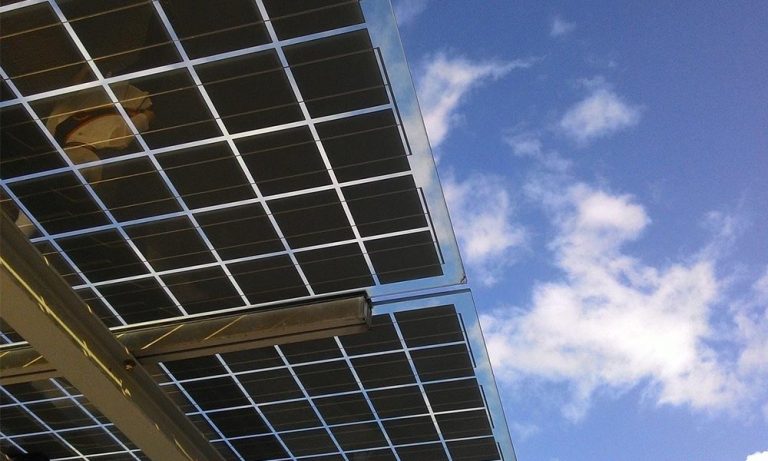
Bifacial photovoltaic modules generate electricity by absorbing light from both the front and rear sides.
The bifaciality factor reaches 80%-90% (rear-side efficiency close to the front).
In sandy/snowy environments, power generation increases by 10%-30% compared to monofacial modules (extremely up to 50%).
In 2023, global market share was 55%. ITRPV predicts it will exceed 70% by 2030.
Encapsulated with double-glass/transparent backsheet, compatible with tracking systems, proven LCOE reduction of 8%-12%, it has become the mainstream choice for overseas large-scale power plants.
Structure and Technology
Structure of Bifacial Cells:
Bifacial modules generate electricity from both sides of the cell, with a structure different from monofacial.
The front side is conventional: the silicon wafer surface has a silicon nitride anti-reflection layer, silver paste prints busbars to collect current.
Different cell types have different rear-side treatments:
l P-type PERC cells: Wafer thickness 130-150μm. The rear side first grows an aluminum oxide passivation layer (10-15nm thick), then aluminum paste is applied to form a local back surface field (LBSF), leaving openings only at electrode contact points. Shading ratio is controlled below 3% (NREL 2023 test).
l N-type TOPCon cells: Wafers are thinner, 120-140μm. The rear side grows a 1-2nm silicon oxide + 150nm polysilicon layer. After phosphorus diffusion, a tunneling oxide layer forms. Shading ratio is 2.5%. Carrier recombination rate is 20% lower than PERC (Fraunhofer ISE data).
l HJT cells: Wafer thickness 110-130μm. Amorphous silicon thin film covers both sides. The rear side uses Transparent Conductive Oxide (TCO) instead of metal electrodes. Shading ratio is only 1.8%, but cost is 15% higher (Panasonic 2024 report).
Cell Type | Wafer Thickness (μm) | Rear Shading Ratio | Passivation Process | Bifaciality Factor (NREL 2023) |
P-type PERC | 130-150 | 3% | Aluminum Oxide + LBSF | 82%-85% |
N-type TOPCon | 120-140 | 2.5% | Silicon Oxide + Polysilicon Tunneling Layer | 85%-88% |
HJT | 110-130 | 1.8% | Amorphous Silicon + TCO | 88%-90% |
Rear electrodes are also important: PERC uses mixed silver-aluminum paste printing; TOPCon uses pure silver paste fine fingers (width 30μm); HJT directly uses low-temperature silver paste to avoid high-temperature damage to the film.
Encapsulation Materials:
Encapsulation determines whether the module can withstand wind and rain and also affects rear-side light transmission. Two mainstream solutions:
Double-glass modules:
Both front and rear use ultra-clear patterned tempered glass, thickness 2.5mm (front) + 2.0mm (rear), transmittance 93.5% (380-1,100nm spectrum).
Sandwiched between the glass is EVA (ethylene-vinyl acetate copolymer) or POE (polyolefin elastomer) encapsulant.
POE has better PID (Potential Induced Degradation) resistance; annual degradation in humid environments is 0.3% lower than EVA (TÜV Rheinland 2024 test).
Double-glass weight is 25 kg/m², withstands wind load of 5400 Pa (UL 1703 certification, equivalent to Category 17 typhoon), resists hail up to 35mm diameter (Swiss SPF test), lifespan 30+ years (IEA-PVPS statistics).
Transparent backsheet modules:
Front glass is the same as above. The rear uses a fluoropolymer film (PVF or PVDF) + PET support layer, total thickness 400μm, transmittance 92%.
Fluoropolymer is UV resistant, PET is 200μm thick for tensile strength. Overall weight is 18 kg/m², 28% lighter than double-glass.
However, after 1000 hours of damp heat test (85°C/85% RH), transmittance decreases by 1.2% (TÜV SÜD data), lifespan around 25 years.
Parameter | Double-glass Module | Transparent Backsheet Module |
Rear Material | 2.0mm Ultra-clear Glass | 400μm Fluoropolymer + PET |
Transmittance | 93.5% | 92% |
Weight (kg/m²) | 25 | 18 |
Wind Load Resistance (Pa) | 5400 | 4800 |
Damp Heat Degradation (1000h) | 0.5% Transmittance Drop | 1.2% Transmittance Drop |
Lifespan (Years) | 30+ | 25 |
Structural Design:
Frame:
Early designs used aluminum alloy frames (6063-T5), 1.2mm thick, with silicone sealant filling the gap between frame and glass for waterproofing.
Now frameless designs are popular, using glass edging directly, reducing dust accumulation (15% less dust on the rear, TÜV Rheinland test), but mechanical stress resistance is slightly weaker, suitable for low wind speed areas (<25 m/s).
For framed modules, the inner side of the frame has serrated drainage channels, increasing rainwater dust removal efficiency by 20% (US NREL simulation).
Mounting connection points:
Modules have 4 mounting holes (8mm diameter) on the short sides, fixed with stainless steel bolts.
Hole positions are 50mm from the edge to avoid stress concentration causing micro cracks.
When the mount is 1m above ground, the rear receives 70% of ground-reflected light; at 1.5m, 85%; at 2m, 92%.
But higher mounting increases racking cost, so 1.2—1.5m is generally chosen.
Busbar-free design: Some modules eliminate front busbars, using multiple fine fingers (12-16 lines) instead. Front shading ratio decreases from 4% to 2%.
Rear fine fingers use copper plating instead of silver paste, reducing cost by 10% (Meyer Burger 2024 patent).
Measured Parameters:
l Bifaciality Factor: NREL 2023 test of 100 modules: PERC average 83%, TOPCon 86%, HJT 89%, highest single module 91.2% (LONGi Hi-MO 6 bifacial).
l Temperature Coefficient: Bifacial modules have better rear-side heat dissipation. Power degradation at high temperature is 0.05%/°C less than monofacial (monofacial -0.35%/°C, bifacial -0.30%/°C, Sandia National Labs data).
l micro crack Risk: Double-glass modules have strong micro crack resistance. After hail impact, micro crack length is 40% shorter than transparent backsheet modules (TÜV NORD test).
Power Generation Gain
Ground reflectivity affects rear-side generation
Rear-side generation relies entirely on ground-reflected light. Higher reflectivity means more light received by the rear. Different ground surfaces have vastly different reflectivity. Measured data is presented here:
l White Sand/Concrete: Reflectivity 40%-60%, rear gain 20%-30%. The Yuma power plant in Arizona, USA (operational 2023), with sand reflectivity of 42%, had the rear side contribute 25% of annual generation, total gain 28% (NextEra Energy report).
l Grassland/Soil: Reflectivity 15%-25%, gain 10%-15%. A farmland project in Bavaria, Germany, with grass reflectivity of 18%, saw bifacial modules generate 12% more electricity annually than monofacial (BayWa r.e. data).
l Water Surface: Reflectivity 20%-50% (higher with more waves), gain 12%-25%. A floating plant off the coast of the Netherlands: calm water reflectivity 22%, up to 38% with waves, average annual gain 18% (TÜV Rheinland 2024 monitoring).
l Snowy Ground: Reflectivity 80%+, gain over 50%. Trondheim plant, Norway (2025 Actual Measurement): During the winter snow period, rear gain was 53%, annual average gain 31% (SINTEF research data).
Note: Reflectivity measured with a spectrometer (380-1,100nm band). Gain = (Bifacial Annual Generation - Monofacial Annual Generation) / Monofacial Annual Generation × 100%.
Ground Type | Reflectivity Range | Rear Gain Range | Test Case (Region/Institution) | Extreme Value Record |
White Sand/Concrete | 40%-60% | 20%-30% | Arizona, USA / NextEra Energy | Sand dune top reflectivity 60%, gain 32% |
Grassland/Soil | 15%-25% | 10%-15% | Bavaria, Germany / BayWa r.e. | Fallow land reflectivity 25%, gain 17% |
Water Surface | 20%-50% | 12%-25% | North Sea, Netherlands / TÜV Rheinland | Wave period reflectivity 50%, gain 28% |
Snowy Ground | 80%+ | 50%+ | Trondheim, Norway / SINTEF Institute | Fresh snow reflectivity 90%, gain 61% |
Module tilt angle directly affects rear light collection
Height above ground: Insufficient height causes ground-reflected light to be blocked by mounting legs. Measured data (University of Arizona 2023):
l 0.5m above ground: Rear receives 50% of ground-reflected light, gain 8% lower than at 1m.
l 1m above ground: Receives 70%, baseline gain.
l 1.5m above ground: Receives 85%, gain +5%.
l 2m above ground: Receives 92%, but racking cost increases 12% ($80,000 more per MW), cost-effectiveness inflection point is 1.2-1.5m.
Tilt angle adjustment: Optimal tilt for monofacial modules is calculated by latitude. Bifacial needs an additional 5°-10 to face the rear towards reflected light. A 500MW plant in Nevada, USA (latitude 39°):
l Monofacial tilt 35, annual generation 1,520 kWh/kW.
l Bifacial tilt 40° (+5°), rear collects more reflected light, total generation 1,850 kWh/kW, gain 21.7% (First Solar data).
Row spacing: Rows too close together shade the rear side. Measured at a 300MW plant in California:
l Spacing 1.8 times module height (3m): Rear unshaded, normal gain.
l Spacing reduced to 1.2 times (2m): Rear of back row shaded 15% by front row, gain reduced by 4%.
Can the rear side work on cloudy/rainy and snowy days?
Monofacial module generation drops sharply on cloudy/rainy days, but the bifacial rear side can compensate somewhat, performing better under low irradiance.
l Cloudy/Rainy Days: When irradiance <200 W/m², monofacial efficiency drops to 30%, while bifacial rear efficiency remains at 25% of the front (NREL 2023 low-irradiance test). Monitoring at a bifacial plant in Sheffield, UK: On overcast days (180 days/year on average), the rear contributed 8%-10% of generation, total generation 12% higher than monofacial.
l Snowy Days: Snow reflectivity 80%+, rear generation surges, but snow covering the front will stop generation. A plant in Quebec, Canada (latitude 47°) uses bifacial + automatic snow removers: 2 hours after snow stops, the front generates power as snow melts, while the rear simultaneously receives snow-reflected light. The winter generation was 45% higher than monofacial (Hydro-Québec report).
How much extra sunlight can tracking systems with bifacial capture?
Single-axis/dual-axis trackers make modules follow the sun. Bifacial adds rear-side reflection, gains are stacked.
l Single-axis tracking (East-West rotation): A 200MW plant in Texas, USA, with single-axis tracking + bifacial, gained 35% compared to fixed monofacial (tracking contributed 20%, bifacial contributed 15%).
l Dual-axis tracking (full rotation): A 100MW plant in the Mojave Desert, California, with dual-axis tracking + bifacial, had annual generation 48% higher than fixed monofacial, but dual-axis cost is 20% higher, suitable for high reflectivity areas (sand/snow).
l Tilted single-axis tracking (with tilt angle): A plant in Andalusia, Spain, with tilted single-axis (25 tilt) + bifacial, gained 42% compared to fixed monofacial, 7% more than standard single-axis (Abengoa data).
Overseas Application Scenarios
How do bifacial modules generate electricity in the desert?
Deserts represent high-reflectivity environments. Sand reflectivity is 35%—60% (up to 60% on new dune tops). Bifacial modules have a clear advantage here.
The 500MW bifacial plant in Nevada, USA (operated by NextEra Energy, 2022), uses single-axis trackers (East-West rotation, tilt adjusted seasonally by 10°). Modules are 1.5m above ground, sand reflectivity 42%.
Measured annual generation is 1,850 kWh/kW, 28% higher than fixed monofacial, with tracking contributing 20% and rear reflection contributing 8%.
Modules use N-type TOPCon cells (bifaciality 87%), double-glass encapsulation (wind load resistance 5400 Pa, withstands 55°C heat).
Degradation rate after 2 years operation is 0.8% (NREL monitoring).
Another case is the 1.2GW Al Dhafra plant in Abu Dhabi, UAE, one of the world's largest bifacial plants.
Sand reflectivity 45%, using bifacial + dual-axis tracking, annual generation increased 32% compared to monofacial, LCOE dropped to $0.024/kWh (ACWA Power data).
In the desert's strong UV environment, double-glass module transmittance decreases 0.3% annually (TÜV Rheinland test), still better than the 0.8% decrease for transparent backsheets.
Desert Project | Location | Scale (MW) | Reflectivity | Tracking Type | Annual Gain | Data Source |
NextEra Nevada | Nevada, USA | 500 | 42% | Single-axis | 28% | NextEra Energy |
Al Dhafra | Abu Dhabi, UAE | 1200 | 45% | Dual-axis | 32% | ACWA Power |
How high should modules be mounted in agrivoltaic projects?
In a greenhouse project in Andalusia, Spain (2023), modules are mounted 2.5m high (1m above crop canopy), spacing 4m (to avoid shading), growing olives underneath.
Grass reflectivity 18%, rear gain 15%, annual generation 1,620 kWh/kW (BayWa r.e. data).
Olive yield decreased 5% annually compared to open field (slight shading), but land rent saved 30%,increasing comprehensive benefit (benefit) by 20%.
In a vegetable greenhouse project in Rotterdam, Netherlands, modules use transparent backsheet (transmittance 92%), mounted 3m high, growing tomatoes underneath.
White mulch film reflectivity 50%, rear gain 22%. Tomatoes yield increased 8% due to scattered light (Wageningen University 2024 study).
Which bifacial module is cost-effective for C&I rooftops?
A logistics park in Berlin, Germany (flat roof, white color steel tile reflectivity 45%) uses transparent backsheet bifacial modules (weight 18 kg/m², reducing roof load), installed capacity 5MW.
Measured annual generation 1,580 kWh/kW, 12% higher than monofacial. Over 25 years, total revenue is €1.2 million more (BayWa r.e. calculation).
A warehouse in Los Angeles, California, USA (sloped roof, concrete reflectivity 40%) uses double-glass modules (wind load resistance 5400 Pa, hail protection), installed capacity 3MW.
Mounted 0.8m above ground (roof edge has guardrail), rear gain 18%, LCOE $0.029/kWh (9% lower than monofacial).
When roof slope >15, bifacial module tilt needs adjustment to be parallel to the roof to avoid the rear being shaded by the module itself.
How are bifacial modules installed in BIPV curtain walls?
Lendlease office building in Sydney, Australia (completed 2023), installed bifacial modules (HJT cells, bifaciality 89%) on the south facade. Curtain wall tilt is 75° (15 from vertical).
Urban building reflectivity is 25% (glass curtain wall reflection), rear gain 10%, annual electricity supply meets 10% of the building's needs (Lendlease case).
Modules use frameless design (reducing dust accumulation), transparent backsheet transmittance 92%, indoor lighting loss <5% (Arup engineering consulting data).
Another case is the noise barrier at Charles de Gaulle Airport, Paris, France. Bifacial modules mounted 6m high, rear facing the runway (concrete reflectivity 40%), annual generation 2.1 GWh, supplying airport lighting (Engie Green project).
How is water surface reflected light utilized in floating power plants?
Water surface reflectivity is 20%-50% (higher with waves). Bifacial modules are suitable for floating plants.
A 1.5MW floating plant in the North Sea, Netherlands (operational 2024), uses double-glass modules (salt spray corrosion resistant), floats made of HDPE (high-density polyethylene).
Calm water reflectivity 22%, up to 38% with waves, average annual gain 18% (TÜV Rheinland monitoring). Module spacing 2m (prevent wave collision), 0.5m above water (reduce water temperature influence), annual generation 1,450 kWh/kW, 15% higher than monofacial.
A floating plant in a Norwegian fjord (snow + water): In winter, the water surface freezes (reflectivity 80%). Bifacial modules receive reflected light from both the ice surface and snow, gain exceeding 50% (Statkraft data).
Can high-latitude snowfield plants generate more even in winter?
High-latitude regions have long winters. Snow reflectivity 80%+, giving bifacial modules a prominent advantage.
A 100MW plant in Trondheim, Norway (latitude 63°), uses bifacial + single-axis tracking, modules 1.2m above ground.
During the winter snow period (Dec-Feb), rear gain was 53%, annual average gain 31%.
After snow stops, the surface temperature of bifacial modules is 3°C higher than monofacial (rear absorbs heat), melting snow 2 hours faster, reducing downtime.
A plant in Quebec, Canada (latitude 47°), uses bifacial modules with automatic snow removers (heating wires + mechanical brushes).
Generation continues on snowy days. The winter generation was 45% higher than monofacial (Hydro-Québec report).